| Fire incidents reported |
|---|
| Sreet name | Count |
|---|
| 16817 S HWY 71 | 8 | | 16078 WYOLA ROAD | 6 | | 16381 S HWY 71 | 6 | | 18524 S HWY 71 | 6 | | 21968 S HWY 71 | 6 | | 438 EARL AVENUE | 6 | | S WHITEHOUSE RD | 6 | | 10422 WEST DEVILS DEN ROAD | 4 | | 11939 CANOVA TRAIL | 4 | | 17251 BETHLEHEM ROAD | 4 | | 17891 N HWY 71 | 4 | | 18740 S HWY 71 | 4 | | 20335 HWY 71 | 4 | | 20791 S HWY 71 | 4 | | 20922 PINE DR | 4 | | 25414 FREEDOM ROAD | 4 | | 2920 NE HWY 71 | 4 | | 567 N HWY 71 | 4 | | HIGHWAY 71 | 4 | | I49 SOUTH OF TUNNEL 1 MILE | 4 | | MILLERS CHAPEL TOWER ROAD | 4 | | WC 38 | 4 | | WYOLA | 4 | | 10040 COLT ROAD | 2 | | 10064 WEST DEVILS DEN ROAD | 2 |
| | | Fire incidents reported |
|---|
| Sreet name | Count |
|---|
| 10208 BUNYARD ROAD | 2 | | 10300 DOLLARD ROAD | 2 | | 10398 E DEVILS DEN ROAD | 2 | | 10398 WEST DEVILS DEN ROAD | 2 | | 10521 DEVILS DEN ROAD | 2 | | 108 S WINSLOW BLVD | 2 | | 10964 E DEVILS DEN RD | 2 | | 10971 DOYLE RD | 2 | | 1098 EASTGATE LANE | 2 | | 11333 W DEVILS DEN ROAD | 2 | | 11511 E DEVILS DEN ROAD | 2 | | 11908 CANOVA TR | 2 | | 12218 DEVILS DEN ROAD | 2 | | 12219 SIGNAL HILL ROAD | 2 | | 12480 DEVILS DEN ROAD | 2 | | 1298 TRESTLE STREET | 2 | | 13040 SCHABERG RD | 2 | | 13125 EAST DEVIL'S DEN ROAD | 2 | | 13212 BUNYARD ROAD | 2 | | 137 E VAN BUREN AVENUE | 2 | | 1417 WEST FRONT AVENUE | 2 | | 14220 SUGAR MOUNTAIN | 2 | | 14221 TRUE LOVE | 2 | | 14261 SUNSET WC 38 | 2 | | |
|
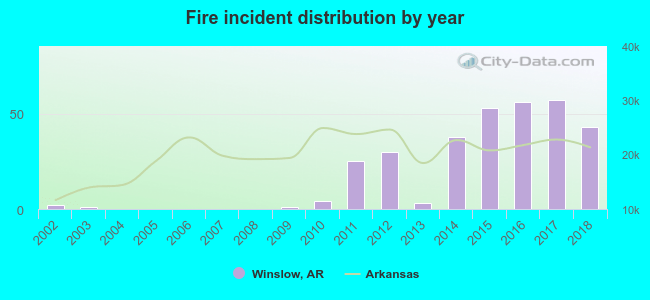 According to the data from the years 2002 - 2018 the average number of fire incidents per year is 18. The highest number of reported fire incidents - 57 took place in 2017, and the least - 0 in 2004. The data has an increasing trend.
 24.6% incidents where reported in the morning and 75.4% in the evening. The most fires (17.9%) took place on Sunday, and the least (12.5%) on Wednesday.
 Based on the 313 fires from years 2002 - 2018 most fires (18.2%) took place during January, and the least (2.2%) in September.
 Out of all 1,561 cases reported during the years 2002 - 2018, the most belonged to the categories: Rescue & EMS (62.1%), Fire (20.1%), and Good Intent Call (10.0%).
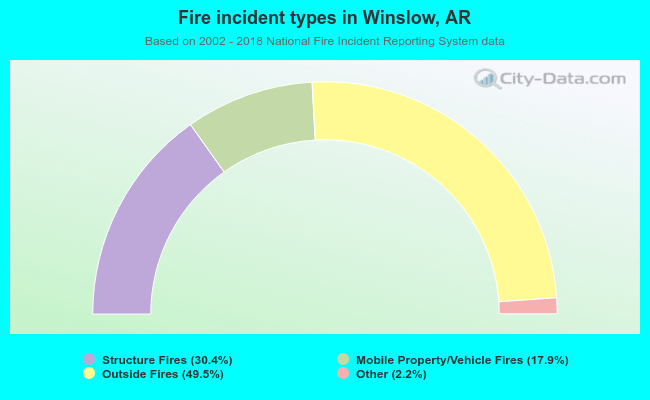 When looking into fire subcategories, the most incidents belonged to: Outside Fires (49.5%), and Structure Fires (30.4%).