Winterhaven: Fire Incidents, California (CA)
Where are fire incidents reported in Winterhaven, CA
Something went wrong! Please refresh the page.
|
| |||||||||||||||||||||||||||||||||||||||||||||||||||||||||||||||||||||||||||||||||||||||||||||||||||||||||||||
2005 - 2018 National Fire Incident Reporting System (NFIRS) incidents
- Incident types reported to NFIRS in Winterhaven, CA
- 2,26175.5%Rescue & EMS
- 33211.1%Good Intent Call
- 2618.7%Fire
- 652.2%Service Call
- 361.2%Hazardous Condition
- 341.1%False Alarm
- 30.1%Special Incident
- Fire incident types reported to NFIRS in Winterhaven, CA
- 14856.7%Outside Fires
- 6524.9%Structure Fires
- 3111.9%Mobile Property/Vehicle Fires
- 176.5%Other
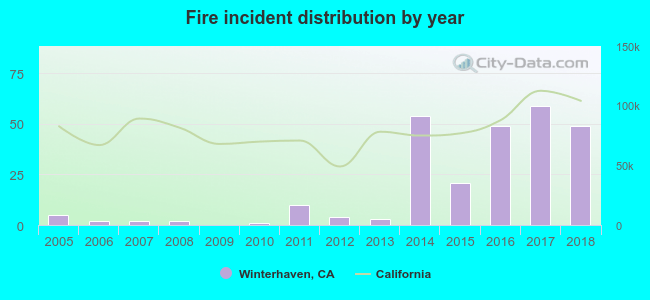 According to the data from the years 2005 - 2018 the average number of fires per year is 19. The highest number of reported fire incidents - 59 took place in 2017, and the least - 0 in 2009. The data has a growing trend.
 34.9% incidents where reported in the morning and 65.1% in the evening. The most fires (19.5%) took place on Monday, and the least (10.3%) on Sunday.
 According to the 261 fires from years 2005 - 2018 most fires (14.9%) took place during June, and the least (4.6%) in August.
 Out of all 2,993 cases reported during the years 2005 - 2018, the most belonged to the categories: Rescue & EMS (75.5%), Good Intent Call (11.1%), and Fire (8.7%).
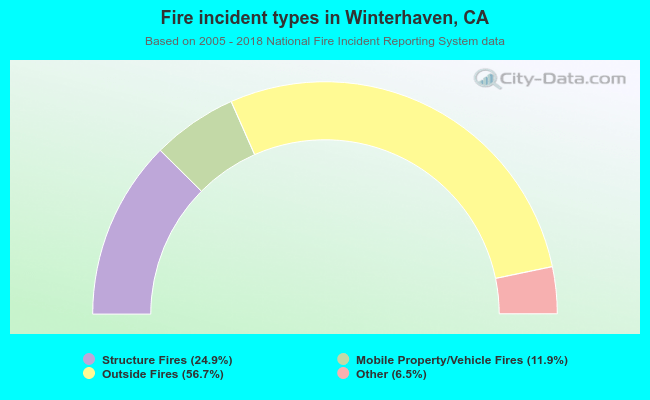 When looking into fire subcategories, the most reports belonged to: Outside Fires (56.7%), and Structure Fires (24.9%).