Wisner: Fire Incidents, Nebraska (NE)
Where are fire incidents reported in Wisner, NE
Something went wrong! Please refresh the page.
|
| |||||||||||||||||||||||||||||||||||||||||||||||||||||||||||||||||||||||||||||||||||||||||||||||||||||||||||||
| Other | 48 | |||||||||||||||||||||||||||||||||||||||||||||||||||||||||||||||||||||||||||||||||||||||||||||||||||||||||||||
2002 - 2018 National Fire Incident Reporting System (NFIRS) incidents
- Incident types reported to NFIRS in Wisner, NE
- 18468.7%Fire
- 4817.9%Rescue & EMS
- 134.9%Hazardous Condition
- 93.4%Good Intent Call
- 83.0%False Alarm
- 51.9%Service Call
- 10.4%Severe Weather
- Fire incident types reported to NFIRS in Wisner, NE
- 9250.0%Outside Fires
- 5429.3%Structure Fires
- 2815.2%Mobile Property/Vehicle Fires
- 105.4%Other
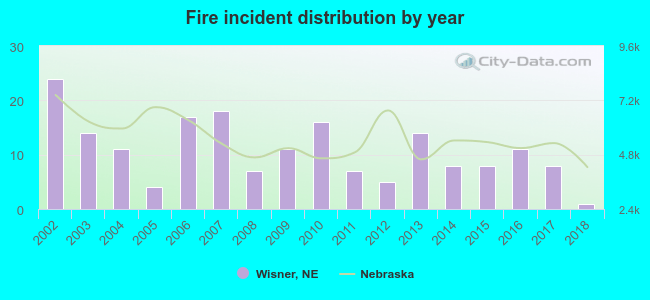 According to the data from the years 2002 - 2018 the average number of fires per year is 11. The highest number of reported fire incidents - 24 took place in 2002, and the least - 1 in 2018. The data has a decreasing trend.
 29.9% incidents where reported in the morning and 70.1% in the evening. The most fires (19.0%) took place on Friday, and the least (9.2%) on Monday.
 According to the 184 fire incidents from years 2002 - 2018 most fires (13.6%) took place during October, and the least (3.8%) in May.
 Out of all 268 cases reported during the years 2002 - 2018, the most belonged to the categories: Fire (68.7%), Overpressure Rupture (17.9%), and Rescue & EMS (4.9%).
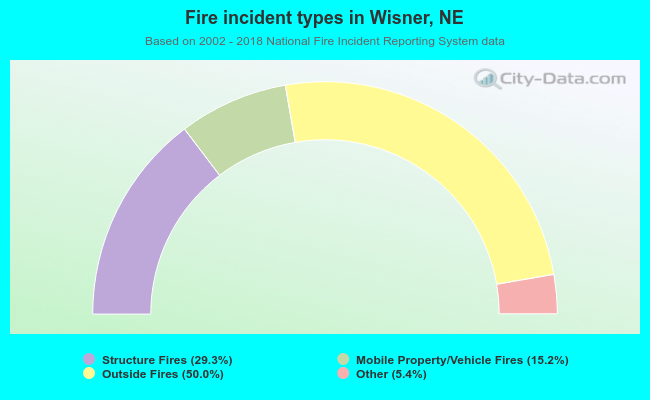 When looking into fire subcategories, the most reports belonged to: Outside Fires (50.0%), and Structure Fires (29.3%).