Wolfeboro: Fire Incidents, New Hampshire (NH)
Where are fire incidents reported in Wolfeboro, NH
Something went wrong! Please refresh the page.
| Fire incidents reported | |
|---|---|
| Sreet name | Count |
| MAIN ST | 154 |
| CENTER ST | 124 |
| PINE HILL RD | 52 |
| MIDDLETON RD | 34 |
| BEACH POND RD | 32 |
| LAMB CT | 32 |
| GOVERNOR WENTWORTH HWY | 30 |
| MASON CT | 26 |
| SEWALL RD | 26 |
| UNION ST | 22 |
| BAY ST | 18 |
| PLEASANT VALLEY RD | 18 |
| NORTH MAIN ST | 16 |
| TROTTING TRACK RD | 16 |
| WAUMBECK RD | 16 |
| ENDICOTT ST | 14 |
| MEMORIAL DR | 14 |
| SOUTH MAIN ST | 14 |
| ACADEMY DR | 12 |
| ELM ST | 10 |
| ESTABROOK RD | 10 |
| FOREST RD | 10 |
| KNOLL RD | 10 |
| LEHNER ST | 10 |
| LINE RD | 10 |
| PORT WEDELN RD | 10 |
| TIMBER LN | 10 |
| BRACKETT RD | 8 |
| BROWN RD | 8 |
| BROWNS RIDGE RD | 8 |
2003 - 2018 National Fire Incident Reporting System (NFIRS) incidents
- Incident types reported to NFIRS in Wolfeboro, NH
- 2,74545.2%Rescue & EMS
- 78012.8%False Alarm
- 72411.9%Service Call
- 69611.5%Fire
- 61910.2%Good Intent Call
- 4868.0%Hazardous Condition
- 110.2%Overpressure Rupture
- 100.2%Severe Weather
- Fire incident types reported to NFIRS in Wolfeboro, NH
- 48169.1%Structure Fires
- 13920.0%Outside Fires
- 547.8%Mobile Property/Vehicle Fires
- 223.2%Other
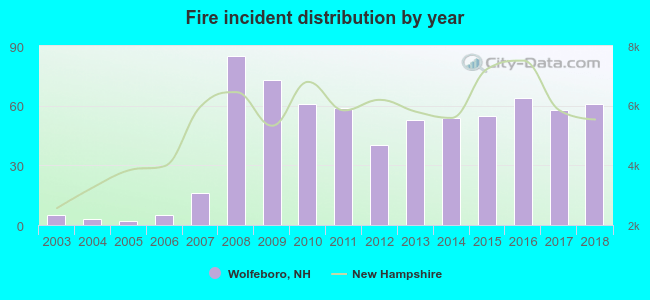 According to the data from the years 2003 - 2018 the average number of fire incidents per year is 43. The highest number of reported fires - 85 took place in 2008, and the least - 2 in 2005. The data has a rising trend.
 The median response time based on all reported fire incidents is 7 minutes. This is similar to the New Hampshire median value.
The median response time in Wolfeboro, NH compared to nearest cities:
(Note: Based on data for all years, including only cities with at least 500 fire incidents)
| Wolfeboro: | 7 minutes |
| Alton: | 14 minutes |
| Gilford: | 8 minutes |
| Wakefield: | 10 minutes |
| Laconia: | 6 minutes |
| Farmington: | 7 minutes |
| Meredith: | 7 minutes |
| Belmont: | 9 minutes |
| Sanbornton: | 12 minutes |
 Based on the data from the years 2003 - 2018 the average number of fire-related casualties per year is 1. The highest number of reported casualties - 2 took place in 2013, and the lowest - 0 in 2003. The data has a constant trend.
The average number of injuries per 1,000 fire incidents is 14. This indicator was the highest - 63 in 2007, and the lowest 0 in 2003. The trend for casualties per 1,000 fires is constant. Compared to the New Hampshire value the number of injuries per 1,000 fire incidents is higher.
Based on the data from the years 2003 - 2018 the average number of fire-related casualties per year is 1. The highest number of reported casualties - 2 took place in 2013, and the lowest - 0 in 2003. The data has a constant trend.
The average number of injuries per 1,000 fire incidents is 14. This indicator was the highest - 63 in 2007, and the lowest 0 in 2003. The trend for casualties per 1,000 fires is constant. Compared to the New Hampshire value the number of injuries per 1,000 fire incidents is higher.Casualties per 1,000 incidents in Wolfeboro, NH compared to nearest cities:
(Note: Based on data for all years, including only cities with at least 500 fire incidents)
| Wolfeboro: | 14.4 |
| Alton: | 1.5 |
| Gilford: | 3.8 |
| Wakefield: | 2.0 |
| Laconia: | 17.4 |
| Farmington: | 1.2 |
| Meredith: | 4.6 |
| Belmont: | 39.7 |
| Sanbornton: | 28.6 |
 30.6% incidents where reported in the morning and 69.4% in the evening. The most fires (16.8%) took place on Friday, and the least (12.4%) on Sunday.
 According to the 696 fire incidents from years 2003 - 2018 most fires (10.5%) took place during April, and the least (6.5%) in June.
 Out of all 6,073 cases reported during the years 2003 - 2018, the most belonged to the categories: Rescue & EMS (45.2%), False Alarm (12.8%), and Service Call (11.9%).
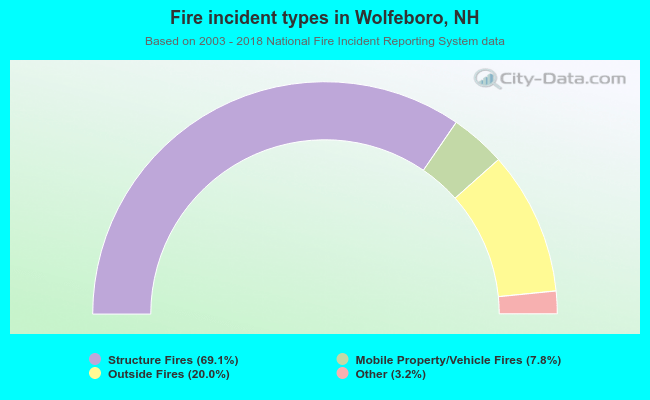 When looking into fire subcategories, the most incidents belonged to: Structure Fires (69.1%), and Outside Fires (20.0%).