Woodbridge: Fire Incidents, Virginia (VA)
Where are fire incidents reported in Woodbridge, VA
Something went wrong! Please refresh the page.
|
| |||||||||||||||||||||||||||||||||||||||||||||||||||||||||||||||||||||||||||||||||||||||||||||||||||||||||||||
| Other | 518 | |||||||||||||||||||||||||||||||||||||||||||||||||||||||||||||||||||||||||||||||||||||||||||||||||||||||||||||
2006 - 2018 National Fire Incident Reporting System (NFIRS) incidents
- Incident types reported to NFIRS in Woodbridge, VA
- 37,25072.5%Rescue & EMS
- 4,9189.6%Good Intent Call
- 2,5535.0%Service Call
- 2,4024.7%Special Incident
- 1,9903.9%False Alarm
- 1,1262.2%Hazardous Condition
- 1,1222.2%Fire
- Fire incident types reported to NFIRS in Woodbridge, VA
- 37333.2%Outside Fires
- 36932.9%Structure Fires
- 28225.1%Other
- 988.7%Mobile Property/Vehicle Fires
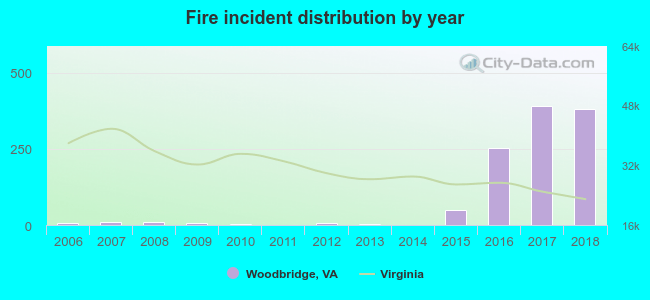 According to the data from the years 2006 - 2018 the average number of fire incidents per year is 86. The highest number of fire incidents - 392 took place in 2017, and the least - 0 in 2014. The data has a rising trend.
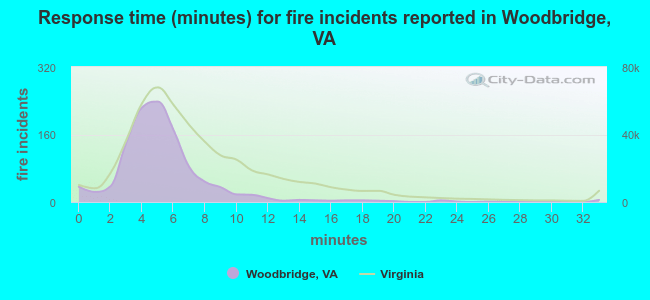 The median response time based on all reported fire incidents is 5 minutes. This is lower compared to the state median value.
The median response time in Woodbridge, VA compared to nearest cities:
(Note: Based on data for all years, including only cities with at least 500 fire incidents)
| Woodbridge: | 5 minutes |
| Lorton: | 6 minutes |
| Indian Head: | 6 minutes |
| Bryans Road: | 6 minutes |
| Springfield: | 6 minutes |
| Accokeek: | 9 minutes |
| Annandale: | 5 minutes |
| Manassas Park: | 4 minutes |
| Manassas: | 5 minutes |
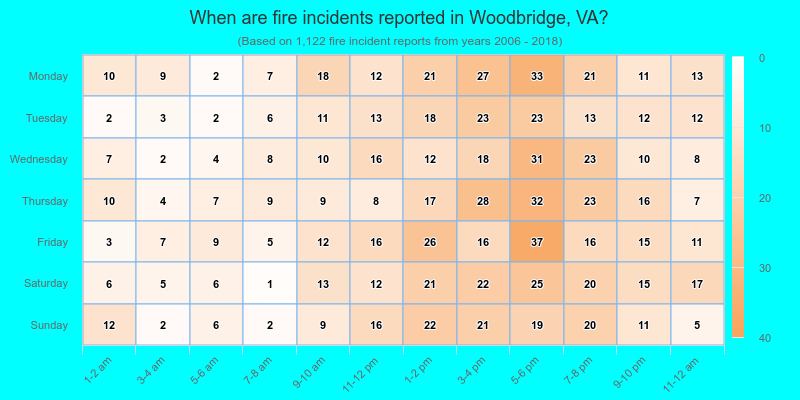
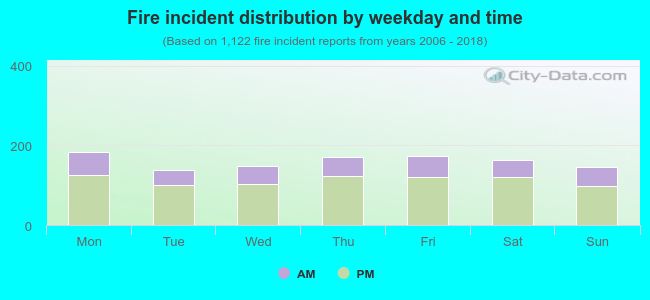 29.5% incidents where reported in the morning and 70.5% in the evening. The most fires (16.4%) took place on Monday, and the least (12.3%) on Tuesday.
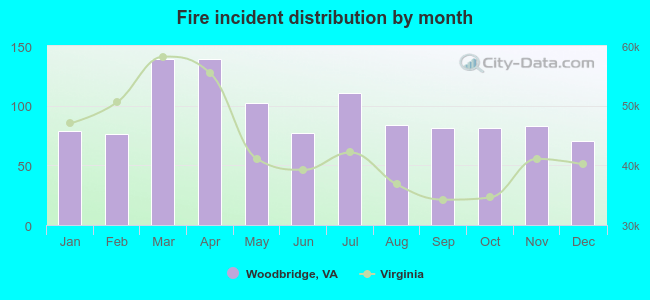 According to the 1,122 fires from years 2006 - 2018 most fires (12.4%) took place during March, and the least (6.2%) in December.
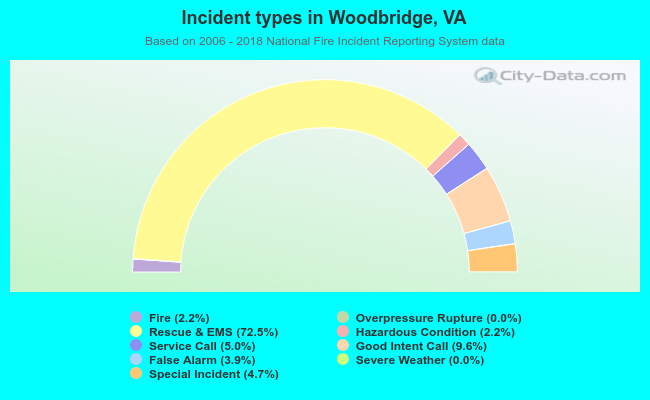 Out of all 51,390 cases reported during the years 2006 - 2018, the most belonged to the categories: Rescue & EMS (72.5%), Good Intent Call (9.6%), and Service Call (5.0%).
 When looking into fire subcategories, the most incidents belonged to: Outside Fires (33.2%), and Structure Fires (32.9%).