Woodbury: Fire Incidents, New Jersey (NJ)
Where are fire incidents reported in Woodbury, NJ
Something went wrong! Please refresh the page.
| Fire incidents reported | |
|---|---|
| Sreet name | Count |
| BROAD ST | 550 |
| EVERGREEN AVE | 260 |
| RED BANK AVE | 106 |
| BARBER AVE | 68 |
| DELAWARE ST | 66 |
| KINGS HWY | 62 |
| CENTRE ST | 58 |
| CRESCENT AVE | 56 |
| MANTUA AVE | 56 |
| COOPER ST | 52 |
| TATUM ST | 52 |
| MANTUA PIKE | 50 |
| ROUTE 45 | 50 |
| SALEM AVE | 48 |
| WASHINGTON AVE | 48 |
| ROUTE 295 | 46 |
| CROWN POINT RD | 42 |
| HIGH ST | 40 |
| PENN ST | 40 |
| HOPKINS ST | 38 |
| MYRTLE AVE | 38 |
| LAUREL ST | 34 |
| CURTIS AVE | 30 |
| HUNTER ST | 30 |
| PARKVILLE STATION RD | 30 |
| PROGRESS AVE | 30 |
| DUBOIS AVE | 28 |
| MAPLE AVE | 26 |
| HESSIAN AVE | 24 |
| ROUTE 130 | 24 |
2002 - 2018 National Fire Incident Reporting System (NFIRS) incidents
- Incident types reported to NFIRS in Woodbury, NJ
- 1,73636.4%Fire
- 1,52732.0%Hazardous Condition
- 64813.6%False Alarm
- 4208.8%Good Intent Call
- 2495.2%Service Call
- 1613.4%Rescue & EMS
- 130.3%Special Incident
- 110.2%Severe Weather
- Fire incident types reported to NFIRS in Woodbury, NJ
- 1,08462.4%Structure Fires
- 41624.0%Outside Fires
- 1438.2%Mobile Property/Vehicle Fires
- 935.4%Other
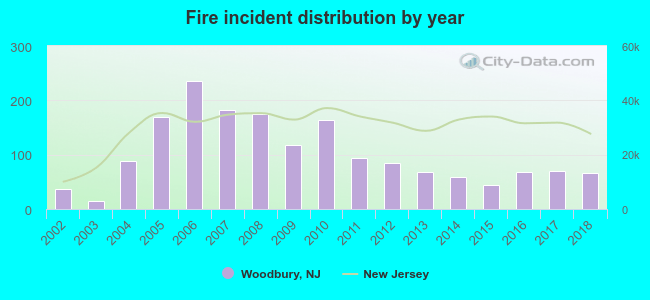 Based on the data from the years 2002 - 2018 the average number of fires per year is 102. The highest number of reported fire incidents - 235 took place in 2006, and the least - 14 in 2003. The data has a growing trend.
The average number of yearly fire incidents per 10k residents in Woodbury, NJ compared to nearest cities:
(Note: Based on data for the last 3 years, including only cities with population 5,000 and above)
| Woodbury: | 68.6 |
| Bellmawr: | 51.2 |
| Runnemede: | 46.2 |
| Gloucester City: | 52.7 |
| Paulsboro: | 76.8 |
| Haddon Heights: | 29.4 |
| Audubon: | 35.6 |
| Barrington: | 61.0 |
| Collingswood: | 84.3 |
 The median response time based on all reported fire incidents is 7 minutes. This is higher than the state median value.
The median response time in Woodbury, NJ compared to nearest cities:
(Note: Based on data for all years, including only cities with at least 500 fire incidents)
| Woodbury: | 7 minutes |
| Westville: | 6 minutes |
| Bellmawr: | 6 minutes |
| Runnemede: | 7 minutes |
| Gloucester City: | 4 minutes |
| Paulsboro: | 8 minutes |
| Haddon Heights: | 6 minutes |
| Blackwood: | 6 minutes |
| Audubon: | 5 minutes |
 Based on the reports from the years 2002 - 2018 the average number of fire-related yearly casualties is 1. The highest number of reported injuries - 6 took place in 2005, and the lowest - 0 in 2002. The data has a constant trend.
The average number of casualties per 1,000 fires is 14. This indicator was the highest - 48 in 2012, and the lowest 0 in 2002. The trend for injuries per 1,000 incidents is declining. Compared to the state value the number of casualties per 1,000 fires is higher.
Based on the reports from the years 2002 - 2018 the average number of fire-related yearly casualties is 1. The highest number of reported injuries - 6 took place in 2005, and the lowest - 0 in 2002. The data has a constant trend.
The average number of casualties per 1,000 fires is 14. This indicator was the highest - 48 in 2012, and the lowest 0 in 2002. The trend for injuries per 1,000 incidents is declining. Compared to the state value the number of casualties per 1,000 fires is higher.Casualties per 1,000 incidents in Woodbury, NJ compared to nearest cities:
(Note: Based on data for all years, including only cities with at least 500 fire incidents)
| Woodbury: | 13.8 |
| Westville: | 20.4 |
| Bellmawr: | 13.4 |
| Runnemede: | 0.0 |
| Gloucester City: | 7.4 |
| Paulsboro: | 0.0 |
| Haddon Heights: | 3.8 |
| Blackwood: | 7.5 |
| Audubon: | 6.2 |
 30.5% incidents where reported in the morning and 69.5% in the evening. The most fires (15.7%) took place on Sunday, and the least (12.2%) on Monday.
 Based on the 1,736 fire incident reports from years 2002 - 2018 most fires (10.4%) took place during April, and the least (6.3%) in August.
 Out of all 4,768 cases reported during the years 2002 - 2018, the most belonged to the categories: Fire (36.4%), Hazardous Condition (32.0%), and False Alarm (13.6%).
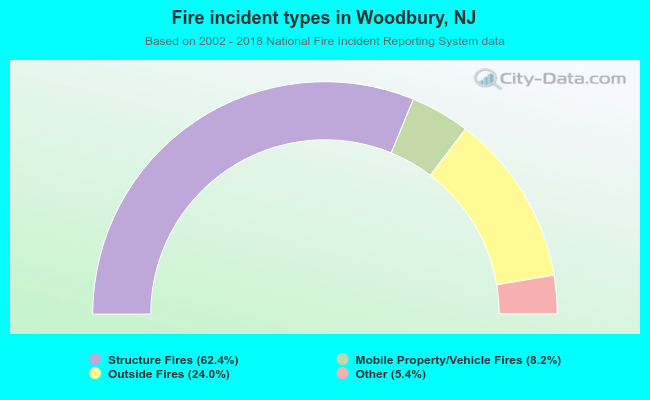 When looking into fire subcategories, the most incidents belonged to: Structure Fires (62.4%), and Outside Fires (24.0%).