Woodhull: Fire Incidents, Illinois (IL)
Where are fire incidents reported in Woodhull, IL
Something went wrong! Please refresh the page.
|
| |||||||||||||||||||||||||||||||||||||||||||||||||||||||||||||||||||||||||||||||||||||||||||||||||||||||||||||
2002 - 2018 National Fire Incident Reporting System (NFIRS) incidents
- Incident types reported to NFIRS in Woodhull, IL
- 24841.6%Fire
- 20534.4%Rescue & EMS
- 7813.1%Hazardous Condition
- 315.2%Good Intent Call
- 172.9%Service Call
- 81.3%False Alarm
- 50.8%Severe Weather
- 40.7%Overpressure Rupture
- Fire incident types reported to NFIRS in Woodhull, IL
- 9839.5%Outside Fires
- 8032.3%Structure Fires
- 5823.4%Mobile Property/Vehicle Fires
- 124.8%Other
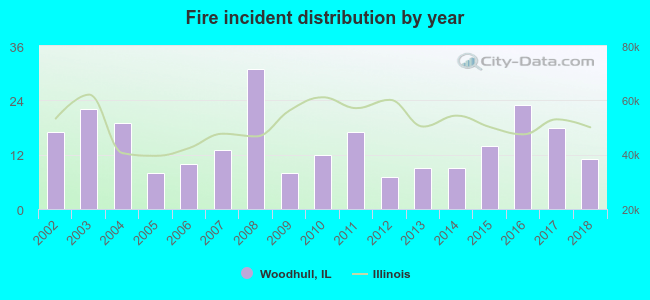 According to the data from the years 2002 - 2018 the average number of fire incidents per year is 15. The highest number of fire incidents - 31 took place in 2008, and the least - 7 in 2012. The data has a dropping trend.
 33.9% incidents where reported in the morning and 66.1% in the evening. The most fires (18.5%) took place on Saturday, and the least (11.3%) on Monday.
 Based on the 248 incident reports from years 2002 - 2018 most fires (12.9%) took place during April, and the least (2.4%) in August.
 Out of all 596 cases reported during the years 2002 - 2018, the most belonged to the categories: Fire (41.6%), Rescue & EMS (34.4%), and Hazardous Condition (13.1%).
 When looking into fire subcategories, the most incidents belonged to: Outside Fires (39.5%), and Structure Fires (32.3%).