| Fire incidents reported |
|---|
| Sreet name | Count |
|---|
| TOMAHAWK TRAIL | 10 | | 507 WEST MAIN ST | 6 | | GRIFFINTOWN RD | 6 | | WILL SLADE RD | 6 | | 1840 BENTHALL BRIDGE RD. | 4 | | 449 HIGHWAY 305 | 4 | | 569 DUSTY HILL ROAD | 4 | | 5951 HIGHWAY 258 | 4 | | BENTHALL BRIDGE RD | 4 | | BENTHALL BRIDGE RD. | 4 | | COLLIER ROAD | 4 | | DUSTY HILL RD | 4 | | HWY 258 | 4 | | POTECASI LN | 4 | | WALNUT STREET | 4 | | 101 WHEELER LN. | 2 | | 103 WALNUT ST. | 2 | | 103 WHEELER LN. | 2 | | 103 WHEELER LANE | 2 | | 10568 HWY 258 | 2 | | 109 EAST MAIN STREET | 2 | | 1115 LASKER GOLF COURSE ROAD | 2 | | 112 TOMAHAWK TRAIL | 2 | | 1150 FENNEL RD | 2 | | 1151 LASKE GOLF COURSE ROAD | 2 |
| | | Fire incidents reported |
|---|
| Sreet name | Count |
|---|
| 121 INDIAN TRAIL | 2 | | 143 GRIFFIN TOWN RD | 2 | | 153 DEANS TRAIL | 2 | | 1617 EAGLETOWN RD | 2 | | 1908 BENTHELL BRIDGE RD | 2 | | 203 S. SYCAMORE ST. | 2 | | 203 SOUTH PERSIMMONS | 2 | | 203 SOUTH PERSIMONS | 2 | | 209 CHESTNUT | 2 | | 212 WALNUT | 2 | | 212 WALNUT STREET | 2 | | 2450 INDIAN TRAIL | 2 | | 255 HEBRON CHURCH ROAD | 2 | | 263 INDIAN TRAIL | 2 | | 267 LOT 119 TOMAHAWK TRAIL | 2 | | 283 POTECASI LANE | 2 | | 300 BLOCK WILLIAM VINSON RD. | 2 | | 305 HWY | 2 | | 305 WILLIAM VINSON RD. | 2 | | 312 BRIDGERS ROAD | 2 | | 3321 HWY. 35 | 2 | | 413 SPRUCE ST. | 2 | | 414 ASH ST. | 2 | | 418 ASHE ST | 2 | | |
|
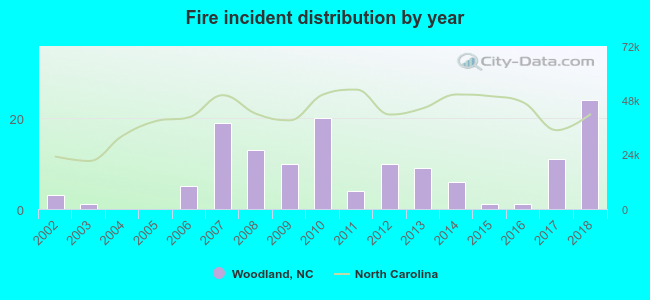 According to the data from the years 2002 - 2018 the average number of fires per year is 8. The highest number of reported fire incidents - 24 took place in 2018, and the least - 0 in 2004. The data has an increasing trend.
 Based on the reports from the years 2002 - 2018 the average number of fire-related yearly deaths is 0. The highest number of deaths - 1 took place in 2010, and the lowest - 0 in 2002. The data has a rising trend.
 33.6% incidents where reported in the morning and 66.4% in the evening. The most fires (19.0%) took place on Thursday, and the least (9.5%) on Wednesday.
 Based on the 137 fire incident reports from years 2002 - 2018 most fires (14.6%) took place during February, and the least (4.4%) in August.
 Out of all 330 cases reported during the years 2002 - 2018, the most belonged to the categories: Fire (41.5%), Overpressure Rupture (22.1%), and Rescue & EMS (17.0%).
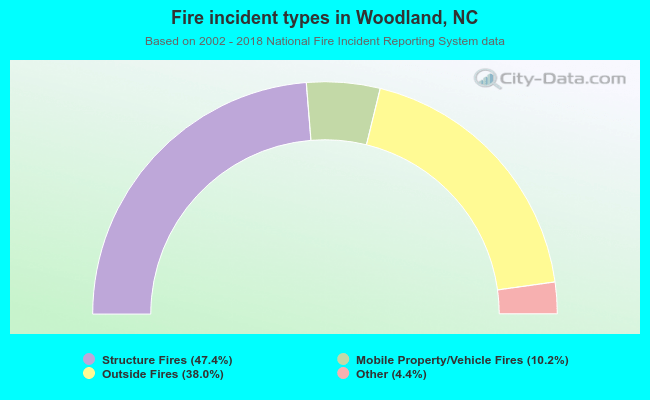 When looking into fire subcategories, the most reports belonged to: Structure Fires (47.4%), and Outside Fires (38.0%).