| Fire incidents reported |
|---|
| Sreet name | Count |
|---|
| CARROLLTON PIKE | 40 | | BREEZY RIDGE RD | 14 | | MT ZION RD | 12 | | FOREST OAK RD | 10 | | JOY RANCH RD | 10 | | MCGHEE RD | 10 | | WOODLAWN RD | 10 | | COULSON CHURCH RD | 8 | | COULSON CHURCH ROAD | 6 | | BIRCHTREE RD | 4 | | BUCKWOODS RD | 4 | | ELKHORN RD | 4 | | GLADE CREEK RD | 4 | | MCGEE RD | 4 | | MCMILLIAN RD | 4 | | MOUNT ZION RD | 4 | | OAK GROVE RD | 4 | | OXFORD LN | 4 | | SENIOR RD | 4 | | TRAPPER DR | 4 | | TYLER LN | 4 | | 110 FORREST OAK GROVE | 2 | | 1593 COULSON CHURCH RD | 2 | | 225 MONORAT RD | 2 | | 2265 PORTERFIELD RD | 2 |
| | | Fire incidents reported |
|---|
| Sreet name | Count |
|---|
| 2372 BREEZY RIDGE ROAD | 2 | | 3682 CARROLLTON PIKE | 2 | | 4778 OAK GROVE RD. | 2 | | 506 ECHO VALLEY | 2 | | 58 RT | 2 | | 82 COMMONWEALTH DRIVE | 2 | | 91 PHOTO LANE | 2 | | AIRPORT RD | 2 | | APACHE RD | 2 | | APPLE TREE LN | 2 | | ARABIAN LN | 2 | | ASPON DRIVE | 2 | | BERKSHIRE RD | 2 | | BIRCHTREE RD | 2 | | BREEZY RIDGE | 2 | | BROADWAY | 2 | | BROADWAY LANE | 2 | | BROARDWAY LANE | 2 | | BUCKWOODS RD | 2 | | BUCKWOODS ROAD | 2 | | BURNETT RD | 2 | | BYRD DR | 2 | | CAMERON LN | 2 | | CARROLLTON | 2 | | |
|
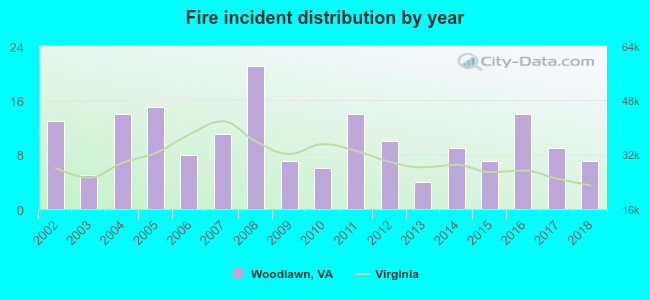 According to the data from the years 2002 - 2018 the average number of fire incidents per year is 10. The highest number of fire incidents - 21 took place in 2008, and the least - 4 in 2013. The data has a declining trend.
 24.7% incidents where reported in the morning and 75.3% in the evening. The most fires (17.8%) took place on Thursday, and the least (9.8%) on Monday.
 Based on the 174 fires from years 2002 - 2018 most fires (20.7%) took place during February, and the least (2.3%) in August.
 Out of all 659 cases reported during the years 2002 - 2018, the most belonged to the categories: Rescue & EMS (31.3%), Fire (26.4%), and Hazardous Condition (22.5%).
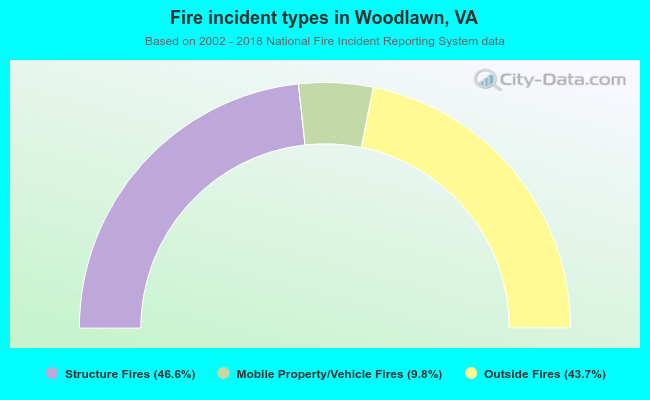 When looking into fire subcategories, the most reports belonged to: Structure Fires (46.6%), and Outside Fires (43.7%).