Wooster: Fire Incidents, Ohio (OH)
Where are fire incidents reported in Wooster, OH
Something went wrong! Please refresh the page.
| Fire incidents reported | |
|---|---|
| Sreet name | Count |
| BURBANK RD | 100 |
| CLEVELAND RD | 74 |
| BEALL AVE | 58 |
| ASHLAND RD | 54 |
| MILLERSBURG RD | 52 |
| BEVER ST | 50 |
| BOWMAN ST | 48 |
| HONEYTOWN RD | 48 |
| ELYRIA RD | 46 |
| LARWILL ST | 44 |
| LIBERTY ST | 44 |
| GRANT ST | 40 |
| HEYL RD | 40 |
| MARKET ST | 40 |
| PORTAGE RD | 40 |
| PRAIRIE LANE RD | 40 |
| BLACHLEYVILLE RD | 38 |
| OLD COLUMBUS RD | 38 |
| SYLVAN RD | 38 |
| FRIENDSVILLE RD | 36 |
| LINCOLN WAY | 36 |
| MELROSE DR | 36 |
| DOVER RD | 34 |
| MORELAND RD | 34 |
| SECREST RD | 34 |
| SPINK ST | 34 |
| CRATER RD | 32 |
| HENRY ST | 32 |
| OLD LINCOLN WAY | 32 |
| SPRUCE ST | 32 |
| Other | 875 |
2002 - 2018 National Fire Incident Reporting System (NFIRS) incidents
- Incident types reported to NFIRS in Wooster, OH
- 10,04159.6%Rescue & EMS
- 2,17912.9%Fire
- 1,67810.0%Service Call
- 1,2767.6%Hazardous Condition
- 8154.8%False Alarm
- 7764.6%Good Intent Call
- 390.2%Special Incident
- 260.2%Overpressure Rupture
- 180.1%Severe Weather
- Fire incident types reported to NFIRS in Wooster, OH
- 1,10950.9%Structure Fires
- 73733.8%Outside Fires
- 31114.3%Mobile Property/Vehicle Fires
- 221.0%Other
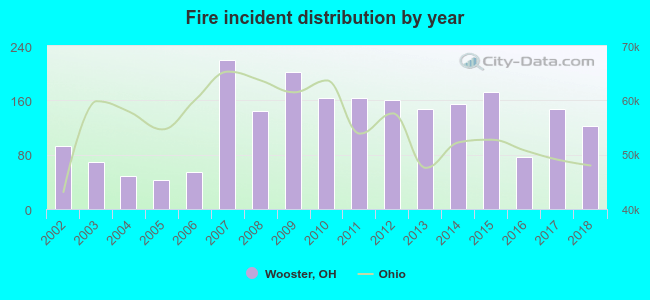 According to the data from the years 2002 - 2018 the average number of fires per year is 128. The highest number of reported fires - 219 took place in 2007, and the least - 42 in 2005. The data has a rising trend.
The average number of yearly fire incidents per 10k residents in Wooster, OH compared to nearest cities:
(Note: Based on data for the last 3 years, including only cities with population 5,000 and above)
| Wooster: | 43.3 |
| Orrville: | 74.5 |
| Rittman: | 43.2 |
| Wadsworth: | 30.6 |
| Canal Fulton: | 32.8 |
| Ashland: | 43.4 |
| Norton: | 30.4 |
| Massillon: | 27.6 |
| Barberton: | 18.0 |
 The median response time based on all reported fire incidents is 7 minutes. This is similar to the state median value.
The median response time in Wooster, OH compared to nearest cities:
(Note: Based on data for all years, including only cities with at least 500 fire incidents)
| Wooster: | 7 minutes |
| Orrville: | 6 minutes |
| West Salem: | 12 minutes |
| Millersburg: | 12 minutes |
| Wadsworth: | 6 minutes |
| Canal Fulton: | 8 minutes |
| Ashland: | 7 minutes |
| Norton: | 7 minutes |
| Massillon: | 5 minutes |
 Based on the reports from the years 2002 - 2018 the average number of fire-related casualties per year is 2. The highest number of casualties - 10 took place in 2007, and the lowest - 0 in 2002. The data has a constant trend.
The average number of casualties per 1,000 fires is 15. This indicator was the highest - 74 in 2006, and the lowest 0 in 2002. The trend for casualties per 1,000 incidents is constant. Compared to the Ohio value the number of injuries per 1,000 fire incidents is about the same.
Based on the reports from the years 2002 - 2018 the average number of fire-related casualties per year is 2. The highest number of casualties - 10 took place in 2007, and the lowest - 0 in 2002. The data has a constant trend.
The average number of casualties per 1,000 fires is 15. This indicator was the highest - 74 in 2006, and the lowest 0 in 2002. The trend for casualties per 1,000 incidents is constant. Compared to the Ohio value the number of injuries per 1,000 fire incidents is about the same.Casualties per 1,000 incidents in Wooster, OH compared to nearest cities:
(Note: Based on data for all years, including only cities with at least 500 fire incidents)
| Wooster: | 16.1 |
| Orrville: | 18.8 |
| West Salem: | 1.4 |
| Millersburg: | 1.5 |
| Wadsworth: | 17.4 |
| Canal Fulton: | 5.5 |
| Ashland: | 7.3 |
| Norton: | 10.3 |
| Massillon: | 13.5 |
 29.6% incidents where reported in the morning and 70.4% in the evening. The most fires (16.2%) took place on Monday, and the least (12.6%) on Tuesday.
 Based on the 2,179 fire incidents from years 2002 - 2018 most fires (11.6%) took place during April, and the least (6.2%) in February.
 Out of all 16,848 cases reported during the years 2002 - 2018, the most belonged to the categories: Rescue & EMS (59.6%), Fire (12.9%), and Service Call (10.0%).
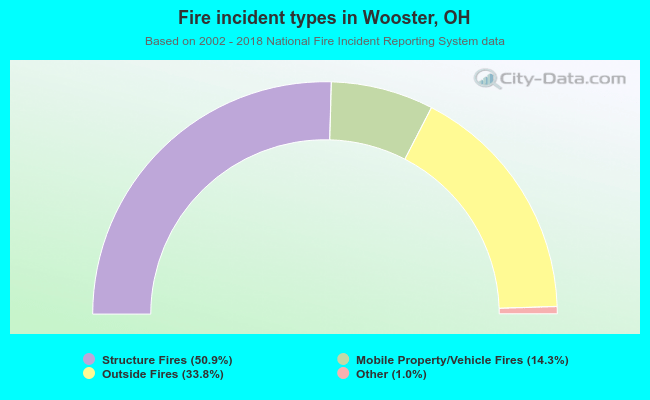 When looking into fire subcategories, the most incidents belonged to: Structure Fires (50.9%), and Outside Fires (33.8%).