| Fire incidents reported |
|---|
| Sreet name | Count |
|---|
| RR #1 | 18 | | RT 17 | 16 | | RR1 | 14 | | RR2 | 10 | | GALENA AVE | 8 | | 900 N GALENA | 6 | | MAIN ST | 6 | | RR 1 | 6 | | WILLIAMS ST | 6 | | 14669 TR 500N | 4 | | 1700 S VALLEY | 4 | | CASTLETON | 4 | | COUNTY LINE RD | 4 | | FIELD FIRE N OF WYOMING | 4 | | R.R. #1 | 4 | | RR | 4 | | RR 2 | 4 | | RT 91 | 4 | | 100 E 950 N | 2 | | 100N | 2 | | 101 E FRANKLIN | 2 | | 1011 N MAIN | 2 | | 10247 SNAREVILLE RD | 2 | | 10315 RT 17 | 2 | | 1050E 400S | 2 |
| | | Fire incidents reported |
|---|
| Sreet name | Count |
|---|
| 107 W ELM | 2 | | 10810 TR 400N | 2 | | 110 W OLIVE ST. | 2 | | 11467 MODENA ROAD | 2 | | 11780 MODENA ROAD | 2 | | 12 MILE WEST OG HOLMES ROAD | 2 | | 1200E | 2 | | 12375 S VALLEY | 2 | | 1300 N LAPRAIRIE RD | 2 | | 1362 CR 100 E | 2 | | 1400E | 2 | | 145 CR 1MILE N 1 M EAST TANN | 2 | | 15601 TR 1050E | 2 | | 1600 E CASTLETON RD | 2 | | 1600 RT17 | 2 | | 16669 500 N | 2 | | 16925 TWP RD 00N | 2 | | 1700 E LGTS | 2 | | 175N 1300E | 2 | | 17792 RT 17 | 2 | | 17792 STATE RT 17 | 2 | | 2 MILES WEST OF DUNCAN | 2 | | 200 W ELM ST | 2 | | 201 S 7TH | 2 | | |
|
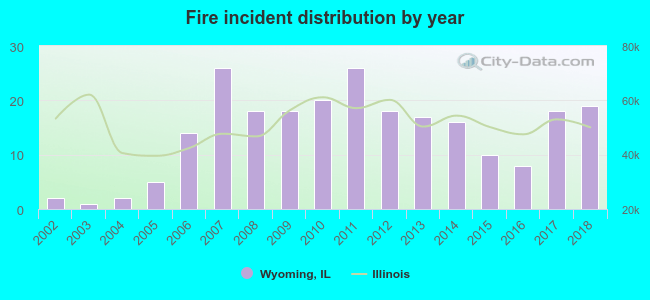 According to the data from the years 2002 - 2018 the average number of fire incidents per year is 14. The highest number of fires - 26 took place in 2007, and the least - 1 in 2003. The data has a growing trend.
 28.6% incidents where reported in the morning and 71.4% in the evening. The most fires (19.3%) took place on Sunday, and the least (8.0%) on Tuesday.
 According to the 238 incident reports from years 2002 - 2018 most fires (16.4%) took place during March, and the least (2.9%) in February.
 Out of all 1,190 cases reported during the years 2002 - 2018, the most belonged to the categories: Rescue & EMS (63.4%), Fire (20.0%), and Hazardous Condition (12.6%).
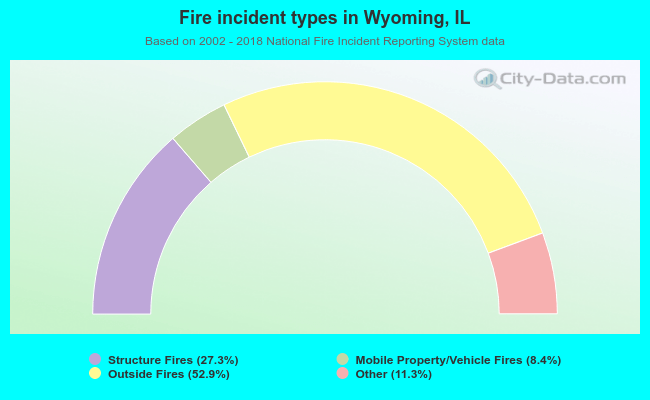 When looking into fire subcategories, the most incidents belonged to: Outside Fires (52.9%), and Structure Fires (27.3%).