Yale: Fire Incidents, Iowa (IA)
Where are fire incidents reported in Yale, IA
Something went wrong! Please refresh the page.
|
| |||||||||||||||||||||||||||||||||||||||||||||||||||||||||||||||||||||||||||||||||||||||||||||||||||||||||||||
2002 - 2018 National Fire Incident Reporting System (NFIRS) incidents
- Incident types reported to NFIRS in Yale, IA
- 14183.9%Fire
- 127.1%Hazardous Condition
- 53.0%Rescue & EMS
- 42.4%Good Intent Call
- 31.8%Service Call
- 21.2%Severe Weather
- 10.6%Special Incident
- Fire incident types reported to NFIRS in Yale, IA
- 7855.3%Outside Fires
- 3424.1%Structure Fires
- 1913.5%Mobile Property/Vehicle Fires
- 107.1%Other
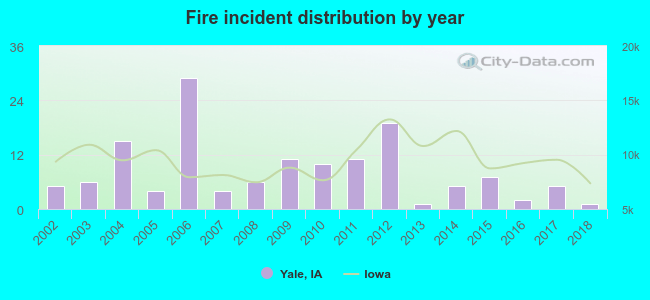 Based on the data from the years 2002 - 2018 the average number of fires per year is 8. The highest number of reported fires - 29 took place in 2006, and the least - 1 in 2013. The data has a declining trend.
 24.8% incidents where reported in the morning and 75.2% in the evening. The most fires (19.9%) took place on Tuesday, and the least (10.6%) on Saturday.
 Based on the 141 fire incident reports from years 2002 - 2018 most fires (12.8%) took place during February, and the least (5.0%) in September.
 Out of all 168 cases reported during the years 2002 - 2018, the most belonged to the categories: Fire (83.9%), Rescue & EMS (7.1%), and Overpressure Rupture (3.0%).
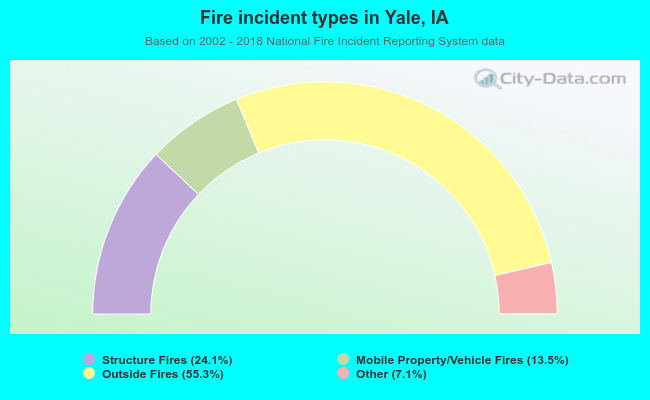 When looking into fire subcategories, the most reports belonged to: Outside Fires (55.3%), and Structure Fires (24.1%).