Yamhill: Fire Incidents, Oregon (OR)
Where are fire incidents reported in Yamhill, OR
Something went wrong! Please refresh the page.
|
| |||||||||||||||||||||||||||||||||||||||||||||||||||||||||||||||||||||||||||||||||||||||||||||||||||||||||||||
2002 - 2018 National Fire Incident Reporting System (NFIRS) incidents
- Incident types reported to NFIRS in Yamhill, OR
- 39038.2%Fire
- 33933.2%Rescue & EMS
- 10710.5%Good Intent Call
- 969.4%Service Call
- 696.8%Hazardous Condition
- 171.7%False Alarm
- 20.2%Special Incident
- Fire incident types reported to NFIRS in Yamhill, OR
- 17143.8%Outside Fires
- 15539.7%Structure Fires
- 4311.0%Mobile Property/Vehicle Fires
- 215.4%Other
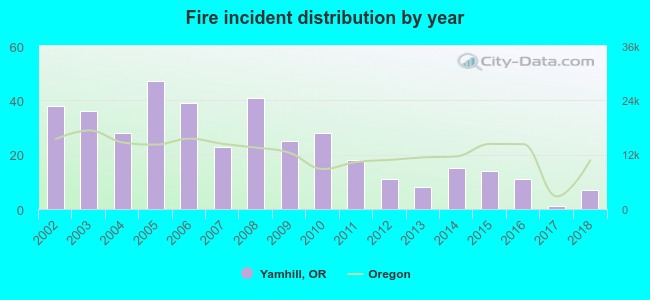 According to the data from the years 2002 - 2018 the average number of fire incidents per year is 23. The highest number of reported fire incidents - 47 took place in 2005, and the least - 1 in 2017. The data has a declining trend.
 32.6% incidents where reported in the morning and 67.4% in the evening. The most fires (16.2%) took place on Tuesday, and the least (11.3%) on Wednesday.
 Based on the 390 fire incidents from years 2002 - 2018 most fires (19.7%) took place during August, and the least (3.6%) in April.
 Out of all 1,020 cases reported during the years 2002 - 2018, the most belonged to the categories: Fire (38.2%), Overpressure Rupture (33.2%), and Service Call (10.5%).
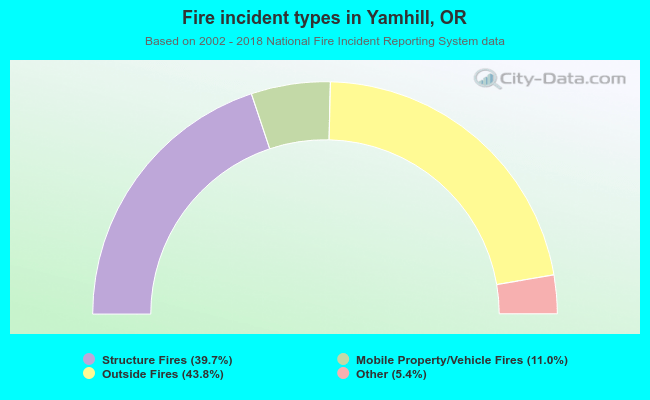 When looking into fire subcategories, the most incidents belonged to: Outside Fires (43.8%), and Structure Fires (39.7%).