Yorkville: Fire Incidents, New York (NY)
Where are fire incidents reported in Yorkville, NY
Something went wrong! Please refresh the page.
|
| |||||||||||||||||||||||||||||||||||||||||||||||||||||||||||||||||||||||||||||||||||||||||||||||||||||||||||||
2002 - 2018 National Fire Incident Reporting System (NFIRS) incidents
- Incident types reported to NFIRS in Yorkville, NY
- 1,61757.8%Rescue & EMS
- 39314.1%Hazardous Condition
- 2549.1%Fire
- 2207.9%Service Call
- 1595.7%False Alarm
- 1114.0%Good Intent Call
- 421.5%Severe Weather
- Fire incident types reported to NFIRS in Yorkville, NY
- 16263.8%Structure Fires
- 5722.4%Mobile Property/Vehicle Fires
- 3011.8%Outside Fires
- 52.0%Other
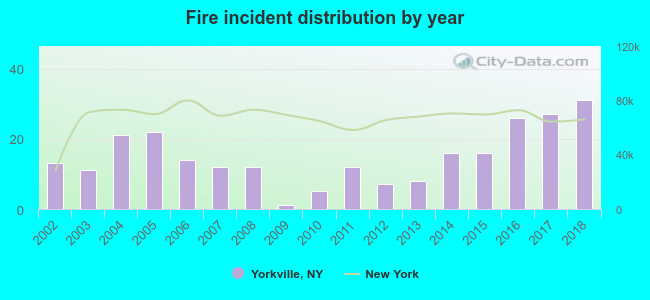 According to the data from the years 2002 - 2018 the average number of fire incidents per year is 15. The highest number of reported fires - 31 took place in 2018, and the least - 1 in 2009. The data has a growing trend.
 Based on the data from the years 2002 - 2018 the average number of fire-related yearly casualties is 0. The highest number of injuries - 3 took place in 2018, and the lowest - 0 in 2003. The data has an increasing trend.
 39.8% incidents where reported in the morning and 60.2% in the evening. The most fires (18.5%) took place on Wednesday, and the least (11.0%) on Tuesday.
 Based on the 254 incident reports from years 2002 - 2018 most fires (13.0%) took place during June, and the least (3.9%) in April.
 Out of all 2,797 cases reported during the years 2002 - 2018, the most belonged to the categories: Rescue & EMS (57.8%), Hazardous Condition (14.1%), and Fire (9.1%).
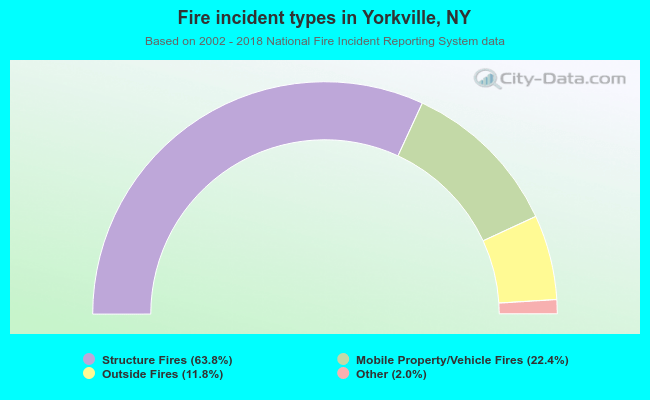 When looking into fire subcategories, the most reports belonged to: Structure Fires (63.8%), and Mobile Property/Vehicle Fires (22.4%).