Yreka: Fire Incidents, California (CA)
Where are fire incidents reported in Yreka, CA
Something went wrong! Please refresh the page.
|
| |||||||||||||||||||||||||||||||||||||||||||||||||||||||||||||||||||||||||||||||||||||||||||||||||||||||||||||
| Other | 19 | |||||||||||||||||||||||||||||||||||||||||||||||||||||||||||||||||||||||||||||||||||||||||||||||||||||||||||||
2005 - 2018 National Fire Incident Reporting System (NFIRS) incidents
- Incident types reported to NFIRS in Yreka, CA
- 41749.0%Fire
- 21525.3%Rescue & EMS
- 849.9%Service Call
- 617.2%Good Intent Call
- 485.6%False Alarm
- 161.9%Hazardous Condition
- 101.2%Special Incident
- Fire incident types reported to NFIRS in Yreka, CA
- 30773.6%Outside Fires
- 4611.0%Structure Fires
- 4210.1%Mobile Property/Vehicle Fires
- 225.3%Other
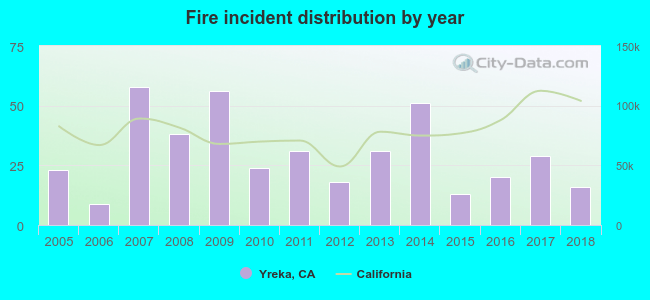 According to the data from the years 2005 - 2018 the average number of fire incidents per year is 30. The highest number of fire incidents - 58 took place in 2007, and the least - 9 in 2006. The data has a dropping trend.
The average number of yearly fire incidents per 10k residents in Yreka, CA compared to nearest cities:
(Note: Based on data for the last 3 years, including only cities with population 5,000 and above)
| Yreka: | 28.6 |

 23.0% incidents where reported in the morning and 77.0% in the evening. The most fires (17.3%) took place on Friday, and the least (11.0%) on Thursday.
 Based on the 417 fire incident reports from years 2005 - 2018 most fires (25.2%) took place during July, and the least (1.7%) in December.
 Out of all 851 cases reported during the years 2005 - 2018, the most belonged to the categories: Fire (49.0%), Overpressure Rupture (25.3%), and Hazardous Condition (9.9%).
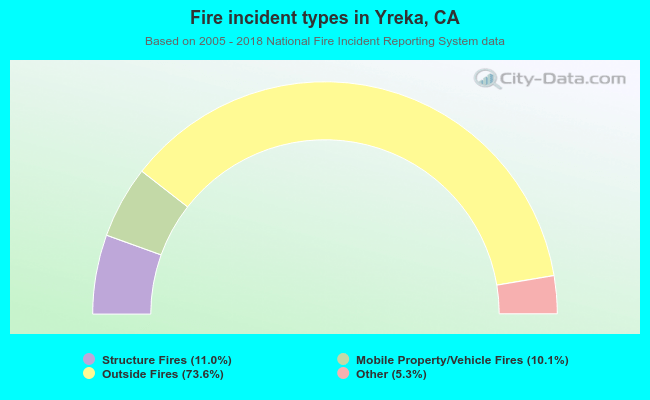 When looking into fire subcategories, the most reports belonged to: Outside Fires (73.6%), and Structure Fires (11.0%).