| Fire incidents reported |
|---|
| Sreet name | Count |
|---|
| HWY 59 | 20 | | HIGHWAY 34 | 10 | | HWY 34 | 10 | | HWY 34 AND CR L | 8 | | 1005 S BIRCH | 6 | | CR 30 | 6 | | CR 45 | 6 | | FIVE RIVERS FEEDLOT | 6 | | HIGHWAY 59 | 6 | | BUS BARN | 4 | | CO RD 36 | 4 | | CO RD 48 | 4 | | CO RD 50 | 4 | | CO RD C AND CO RD 30 | 4 | | COUNTY ROAD | 4 | | CR 21 | 4 | | CR 24 | 4 | | CR 30 AND CR C | 4 | | CR 30 AND CR H | 4 | | CR 36 | 4 | | CR 38 AND CR P | 4 | | CR 40 | 4 | | CR 46 AND CR Q | 4 | | CR 49 | 4 | | CR 52 | 4 |
| | | Fire incidents reported |
|---|
| Sreet name | Count |
|---|
| CR 52 AND CR K | 4 | | CR 53 AND CR P | 4 | | CR AA AND CR 60 | 4 | | CR C AND CR 43 | 4 | | CRD T | 4 | | HIGHWAY 34 AND CR K | 4 | | HIGHWAY 34 AND CR N | 4 | | HWY 34 AND CR P | 4 | | HWY 34 AND CR ZZ | 4 | | HWY 59 AND CR 17 | 4 | | HWY 59 AND CR 26 | 4 | | HWY 59 AND CR 53 | 4 | | MAIN | 4 | | MAIN ST | 4 | | YUMA CEMETARY | 4 | | 1.5 MILES N OF HWY 34/ CR E | 2 | | 100 BLOCK N BUFFALO | 2 | | 1000 WEST 8TH | 2 | | 1009 SOUTH BIRCH | 2 | | 1015 S ALBANY | 2 | | 103 N GUM | 2 | | 105 N. BUFALO | 2 | | 10TH STREET AND BUFFALO | 2 | | 1112 S ASH | 2 | | 113 W HOAG | 2 |
|
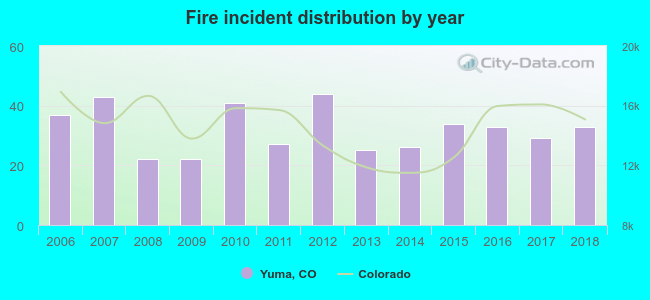 According to the data from the years 2006 - 2018 the average number of fires per year is 32. The highest number of reported fires - 44 took place in 2012, and the least - 22 in 2008. The data has a declining trend.
 22.6% incidents where reported in the morning and 77.4% in the evening. The most fires (16.3%) took place on Wednesday, and the least (11.3%) on Saturday.
 According to the 416 fires from years 2006 - 2018 most fires (18.3%) took place during July, and the least (4.1%) in February.
 Out of all 747 cases reported during the years 2006 - 2018, the most belonged to the categories: Fire (55.7%), Rescue & EMS (16.6%), and Hazardous Condition (12.9%).
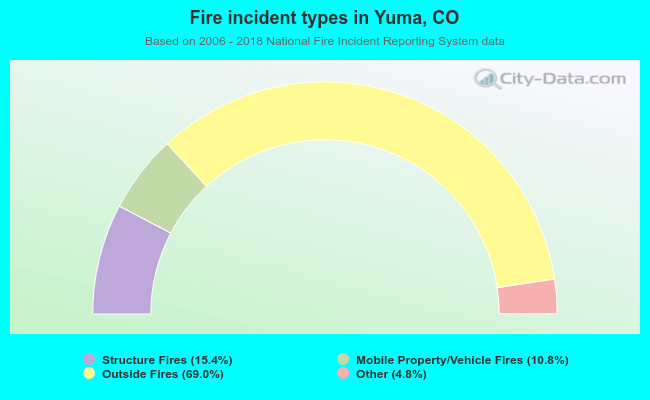 When looking into fire subcategories, the most incidents belonged to: Outside Fires (69.0%), and Structure Fires (15.4%).