| Fire incidents reported |
|---|
| Sreet name | Count |
|---|
| # 12 TWIN BUTTES DR | 4 | | OUTH SANDY SPRINGS | 2 | | # 05 A RIVERBED DRIVE | 2 | | # 05 B WEST CHAVEZ CIRCLE | 2 | | # 07 B RUINS RD. | 2 | | # 11 ST. ANTHONY DR. | 2 | | # 1202 STATE HWY 53 | 2 | | # 1287 STATE HWY 53 | 2 | | # 133 0B SOUTH SANDY SPRING RD | 2 | | # 16 ST. ANTHONY ST | 2 | | # 17 MID SCHOOL DR. | 2 | | # 17 MID SHCOOL DR. | 2 | | # 17C BOBELU DR. | 2 | | # 26 E PIA MESA RD | 2 | | # 38 RUFUS COURT | 2 | | # 43 A LAATE DR | 2 | | # 44 SILT RD | 2 | | # 58 E M. SOLOMON DR. | 2 | | #03 B ST.ANTHONY DR. | 2 | | #14 A HARKER CIRCLE | 2 | | 01 CHIMONI DR | 2 | | 02 D OJO CALIENTE RD. | 2 | | 04 CHIMONI DRIVE DR | 2 | | 05 LAWEKA RD | 2 | | 08 DISHTA DR. | 2 |
| | | Fire incidents reported |
|---|
| Sreet name | Count |
|---|
| 09 B NORTH SANDY SPRING RD. | 2 | | 1.5 MILE WEST OJO RD | 2 | | 11 ST ANTHONY DR. | 2 | | 17 C BOBELU STREET | 2 | | 17 C BOBELU STREET ST | 2 | | 18 GREASY HILL LOOP | 2 | | 2.7 SOUTH OF FIELDS RD | 2 | | 301 | 2 | | 53 HWY | 2 | | ACROOS # 10 RED CLAY RD | 2 | | APT A88 B AVE | 2 | | APT C811 ON A AVE | 2 | | B AVE & 7TH STREET | 2 | | BEAR TRAIL RD | 2 | | BEHIND # 1215 ST. HWY 53 | 2 | | BEHIND # 02 RIVERBED DR | 2 | | BEHIND 12-3 COTTON WOOD CIR. | 2 | | BEHIND ALL TRIBES JEWELRY | 2 | | BEHIND HOUSE 1169 STATE HWY | 2 | | BEHIND HSE # 13 C GUY PINTO DR | 2 | | BEHIND HSE # 15 LESARLLEY RD | 2 | | BEHIND PEACH DR | 2 | | BETWEEN HSE # 66 & 67 PINE ST | 2 | | BOBELU ST OLD PLAYGROUND | 2 | | BOBEULU DR OLD PLAYGROUND | 2 |
|
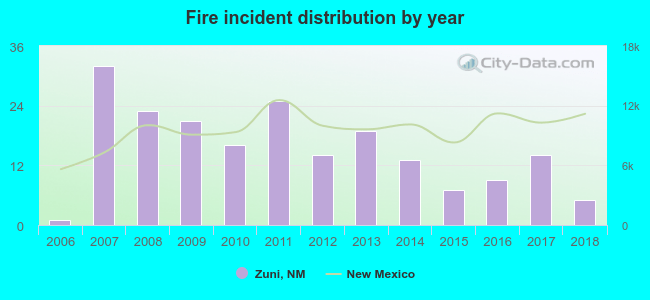 Based on the data from the years 2006 - 2018 the average number of fires per year is 15. The highest number of reported fire incidents - 32 took place in 2007, and the least - 1 in 2006. The data has a rising trend.

 29.6% incidents where reported in the morning and 70.4% in the evening. The most fires (19.1%) took place on Sunday, and the least (11.6%) on Thursday.
 According to the 199 incident reports from years 2006 - 2018 most fires (13.6%) took place during April, and the least (3.0%) in September.
 Out of all 2,489 cases reported during the years 2006 - 2018, the most belonged to the categories: Rescue & EMS (78.7%), Fire (8.0%), and Good Intent Call (6.5%).
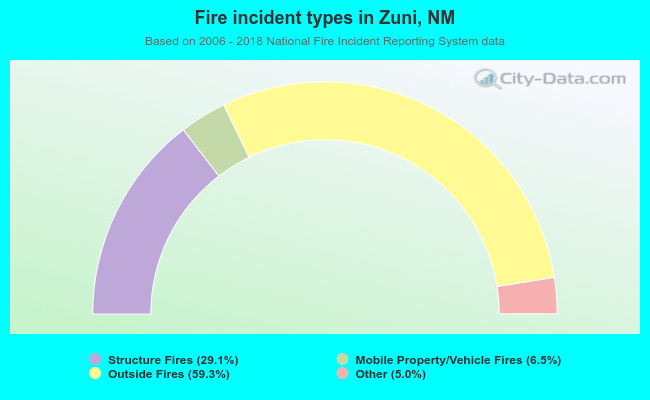 When looking into fire subcategories, the most reports belonged to: Outside Fires (59.3%), and Structure Fires (29.1%).