Please register to participate in our discussions with 2 million other members - it's free and quick! Some forums can only be seen by registered members. After you create your account, you'll be able to customize options and access all our 15,000 new posts/day with fewer ads.
Its interesting how city level median income numbers often swing wildly from year to year.
50 Largest US Cities by
Median Household Income, 2016
San Francisco, CA $103,801
San Jose, CA $101,940
Seattle, WA $83,476
Washington, DC $75,506
San Diego, CA $71,481
Virginia Beach, VA $71,117
Oakland, CA $68,060
Austin, TX $66,697
Raleigh, NC $64,456
Boston, MA $63,621
Portland, OR $62,127
Denver, CO $61,105
Charlotte, NC $61,017
Colorado Springs, CO $60,308
Long Beach, CA $60,075
New York, NY $58,856
Fort Worth, TX $56,428
Minneapolis, MN $56,255
Sacramento, CA $55,187
Los Angeles, CA $54,432
Nashville, TN $54,310
Arlington, TX $54,272
Atlanta, GA $53,843
Chicago, IL $53,006
Oklahoma City, OK $52,915
Omaha, NE $52,672
Mesa, AZ $52,393
Phoenix, AZ $52,060
Jacksonville, FL $51,298
Kansas City, MO $51,235
Las Vegas, NV $51,115
Albuquerque, NM $50,522
Columbus, OH $49,602
San Antonio, TX $49,268
Wichita, KS $49,202
Louisville, KY $48,996
Houston, TX $47,793
Baltimore, MD $47,350
Dallas, TX $47,243
Indianapolis, IN $44,615
Fresno, CA $44,095
El Paso, TX $43,200
Tulsa, OK $43,134
Philadelphia, PA $41,449
Tucson, AZ $40,021
Memphis, TN $38,826
New Orleans, LA $38,681
Milwaukee, WI $38,097
Miami, FL $34,901
Detroit, MI $28,099
MSA figures are much steadier... Selected Metro Areas by Median Household Income, 2016
San Jose-Sunnyvale-Santa Clara, CA $110,040
San Francisco-Oakland-Hayward, CA $96,677
Washington-Arlington-Alexandria, DC-VA-MD-WV $95,843
Boston-Cambridge-Newton, MA-NH $82,380
Seattle-Tacoma-Bellevue, WA $78,612
Baltimore-Columbia-Towson, MD $76,788
New York-Newark-Jersey City, NY-NJ-PA $71,897
Minneapolis-St. Paul-Bloomington, MN-WI $71,231
Denver-Aurora-Lakewood, CO $71,926
Raleigh, NC $71,685
Austin-Round Rock, TX $71,000
San Diego-Carlsbad, CA $70,824
Portland-Vancouver-Hillsboro, OR-WA$68,676
Salt Lake City, UT $68,196
Chicago-Naperville-Elgin, IL-IN-WI $66,020
Philadelphia-Camden-Wilmington, PA-NJ-DE-MD $65,996
Los Angeles-Long Beach-Anaheim, CA $65,950
Sacramento--Roseville--Arden-Arcade, CA $64,052
Dallas-Fort Worth-Arlington, TX $63,812
Atlanta-Sandy Springs-Roswell, GA$62,613
Houston-The Woodlands-Sugar Land, TX $61,708
Columbus, OH $60,294
Cincinnati, OH-KY-IN $60,260
Nashville-Davidson--Murfreesboro--Franklin, TN $60,030
Charlotte-Concord-Gastonia, NC-SC $59,979
St. Louis, MO-IL $59,780
Riverside-San Bernardino-Ontario, CA$58,236
Phoenix-Mesa-Scottsdale, AZ $58,075
Milwaukee-Waukesha-West Allis, WI $58,029
Jacksonville, FL $56,840
Indianapolis-Carmel-Anderson, IN $56,750
Detroit-Warren-Dearborn, MI $56,142
San Antonio-New Braunfels, TX $56,105
Pittsburgh, PA $56,063
Las Vegas-Henderson-Paradise, NV $54,384
Orlando-Kissimmee-Sanford, FL $52,385
Cleveland-Elyria, OH Metro Area $52,131
Miami-Fort Lauderdale-West Palm Beach, FL $51,362
Tampa-St. Petersburg-Clearwater, FL $51,115
Memphis, TN-MS-AR $49,809
New Orleans-Metairie, LA $48,804
*Census Bureau 2016 One-Year Estimates Released Sep 14, 2017
I love how Houston, Dallas, and Atlanta are always right there together. Just wait until we land HQ2 and that GMP tilts the scale in Atlanta's favor. There ain't another friendly rivalry more intense than these these emerging world class metros.
Location: Watching half my country turn into Gilead
3,530 posts, read 4,171,933 times
Reputation: 2925
Where did you find the figures for individual cities? All I could find are for metros.
Baltimore has a higher median household income than one would expect, especially at the metro level, where it's higher than metros like New York, Minneapolis, Denver, and Austin. Detroit's median household income doubles when including its surrounding metro, while there isn't much difference between Las Vegas' at the city and metro level.
This should not come as a surprise; many old rust belt cities have very low median household incomes. However, their suburban areas are very affluent, bringing their metro area average up. Examples include: Detroit, Baltimore, Chicago, St. Louis, Cleveland, Buffalo, Pittsburgh, Rochester, Syracuse, Toledo, and Cinncinnati.
Where did you find the figures for individual cities? All I could find are for metros.
Baltimore has a higher median household income than one would expect, especially at the metro level, where it's higher than metros like New York, Minneapolis, Denver, and Austin. Detroit's median household income doubles when including its surrounding metro, while there isn't much difference between Las Vegas' at the city and metro level.
In the drop down box where you select the geography, choose 'place' and then you can pick cities by state or all US cities with 65,000+ population.
Location: Watching half my country turn into Gilead
3,530 posts, read 4,171,933 times
Reputation: 2925
Quote:
Originally Posted by cjoseph
This should not come as a surprise; many old rust belt cities have very low median household incomes. However, their suburban areas are very affluent, bringing their metro area average up. Examples include: Detroit, Baltimore, Chicago, St. Louis, Cleveland, Buffalo, Pittsburgh, Rochester, Syracuse, Toledo, and Cinncinnati.
No, it is a surprise. I understand what you're saying, and I agree with you, but every city in this country, save for San Francisco, is less wealthy than their metro area by median household income--and most considerably. So it is surprising to see how stark the discrepancy is for a place like Baltimore, which is Top 5 by metro area if you consider the Bay as one, but in the lower third tier as a city. Based on the list OP provided, that's the largest discrepancy by dollar amount in the country (though Detroit's metro/city drop is far bigger as a percentage).
Ah, I see, you added each city to the table. Impressive!
It was nothing. Lol just data retrieval.
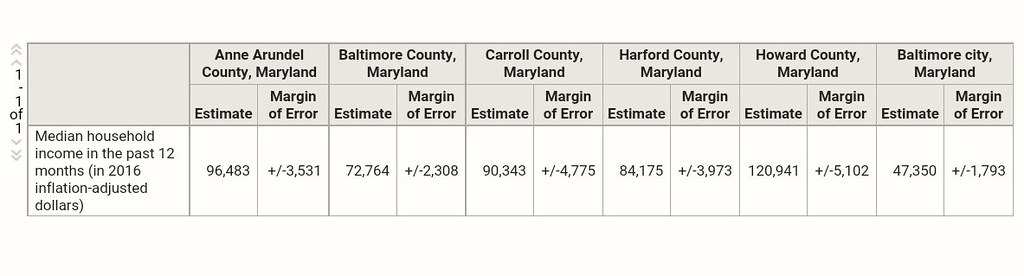
As far as Baltimore, here is a screen shot of every county in the MSA except Queen Anne's, which Im guessing is too small to be included in the 1-yr estimate.
Its interesting how city level median income numbers often swing wildly from year to year.
50 Largest US Cities by
Median Household Income, 2016
San Francisco, CA $103,801
SF jumped from $92K in 2015 to $103K in 2016??? I guess a lot of lower income people must have left.
Please register to post and access all features of our very popular forum. It is free and quick. Over $68,000 in prizes has already been given out to active posters on our forum. Additional giveaways are planned.
Detailed information about all U.S. cities, counties, and zip codes on our site: City-data.com.

 Please register to participate in our discussions with 2 million other members - it's free and quick! Some forums can only be seen by registered members. After you create your account, you'll be able to customize options and access all our 15,000 new posts/day with fewer ads.