Losing Earth: The Decade We Almost Stopped Climate Change (Indiana, panel, river)
Please register to participate in our discussions with 2 million other members - it's free and quick! Some forums can only be seen by registered members. After you create your account, you'll be able to customize options and access all our 15,000 new posts/day with fewer ads.
You've put in the increased co2 & coincidental rise in temps-- but that's just it-- the earlier part of the graph suggests it's just a coincidence. (but correlation doesn't prove anything either way)
I just thought of another point to be considered: half the fossil fuel EVER burned has been burned in the last 40 yrs-- but co2 levels have been rising in an almost linear fashion since 1840. If fossil fuels are the problem, shouldn't we bee seeing a sharper increase in co2?
Or is it explained like this: natural warming has been occurring over the last 200 yrs and that leads to outgassing of co2 from the oceans at an even, consistent rate? This explanation seems to fit the observations more snuggly. (Now how do we explain the other 7000 yrs of data then?
This is a valid point and one that I cant answer..
I would expect the CO2 levels to not be "as" linear but instead increase at a sharper rate in later years when we clearly are burning more fossil fuel simply because there are more people..
This is just a guess.. dont have any significant backup on this.
But.. the temperature rise we see in the last 100 plus years actually looks like it "sort of" has a linear trend.
If CO2 were responsible, the CO2 concentration would require an exponential increase over time in order to produce a linear change in temperature.
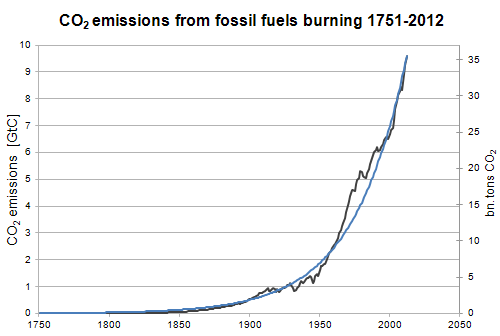
From figure 4 here https://skepticalscience.com/C02-emi...re-growth.html there is an exponential growth in emissions that would only result in a linear rise in temp. So there is somewhat of a consistent match in correlating the amount of emissions to the temperature rise.
Rising CO2 concentrations push the outgoing radiation further out into to space where it is colder and drier (why CO2 is the dominant greenhouse gas and not water - this I do have a reference for http://clivebest.com/blog/?p=1169 ).
I could imagine an increase in emissions also causing a larger volume because of occupying higher altidude. And if you measured at a fixed height, you would not account for that higher volume.
Pure speculation on my part about the height.. could be wrong. But the amount of CO2 emission does somewhat correlate with the temperature rise we see.
Measurements of co2 a Mauna Loa are considered to represent accurate descriptions of world wide levels-- but why? can co2 instantaneously disperse itself evenly over the planet? They seem to be ignoring the Hadley Cell circulation that allows very little mixing of N Hemispheric air with S. They also seem to forget that the more dramatic rise in co2 levels in co2 since ~ 1980 are coincidental with the dramatic rise in automobile use in HI, not to mention the fact that the observation site is on a n active volcano periodically spewing out co2. (co2 is higher on weekdays and lower on weekends in HI due to traffic differences.)
The graph you posted sites co2 levels in 5 significant figures. Did you ever take analytic chemistry? Four figures is tough. I don' know the specifics of co2 measurement, but my intuition says that stating results in 5 figures is a stretch-- and that brings up the point about stating temps in 3 significant figures-- visually read thermometers are only accurate to =/+ 0.5 degrees. ( 1/3 = 0.3; 33/100 = 0.33; 333/1000 = 0.333)
Your posted co2 graph: a straight edge placed on top & bottom readings shows a slight belly under it-- not an exact line, but the non-linearity is not very impressive. A best fit straight line is awfully accurate.
Re: linearity of temp charts -- if you find the charts with a little longer ordinate and for the period since 1880 or so, a 60 yr cycle-30 of warming and 30 of cooling- is obvious. The over all trend is up from 1880 to present. A problem is the outlier yrs--sudden extreme hot or extreme cold, not necessarily in sync with the general trend. If those are ignored, the cyclic nature of temps is more obvious and the trend less obvious. ( cf- note above about starting with '96 vs '98 vs '00).
Don't be led astray into superstitious belief: just because co2 levels have been rising for 200 yrs and we're warmer now than 200 yrs ago doesn't mean it's all or even mostly co2: co2 has risen steadily over that period while temps have had long stretches of both warming and cooling along the way.
At this point in studying all the info I can find, I would have to assume that all the scientists doing research on this intentionally misled and falsely altered the data for reasons such as they thought they would keep their jobs and funding longer. If the scientist have done what they were supposed to do - as accurate as possible research, I think it is very clear that human are influencing the temperature upwards. As I mentioned before (since I have been asking others what their qualifications are if they are making conclusions), I am a retired analog MSEE so spent a fair amount of time in academia and as an engineer scientist and I believe mostly what the scientists are telling us..
In the last 120 years, we have seen both a large increase in CO2 emission and an increase in global temperatures at the same time. We have been talking linear Vs exponential. Linear means change of temperature per time is constant - ie, constant slope and no percent increase over time. You get an exponential increase when for example there is a constant percent increase with time. For example, a growth of 3% per year produces an exponental increase over time.
So the science says that in order for CO2 to influece temperature, the CO2 must increase at an exponential rate in order to see a linear change in temperature. Here is a better description of what I was referring to earlier.
The first graph is the actual temperature rise we have been seeing from 1880 to present. I added the light blue line to show what a constant linear increase (slope stays the same) would look like and it matches the actual data fairly well after 1970. Before that, the line doesn't match but its not hard to imagine that natural variations were masking changes due to CO2.
Figure 4. Growth of carbon dioxide emissions from burning fossil fuels during the period 1751-2012 (black line); source: CDIAC. Blue line represents exponential function growing at a rate of 2.8% per year (i.e. doubling every 25 years).
And I will just copy what I speculated (note that this is my speculation)
Rising CO2 concentrations push the outgoing radiation further out into to space where it is colder and drier (why CO2 is the dominant greenhouse gas and not water - this I do have a reference for http://clivebest.com/blog/?p=1169 ).
I could imagine an increase in emissions also causing a larger volume because of occupying higher altitude. And if you measured at a fixed height, you would not account for that higher volume.
FYI, the chart on CO2 emissions is a little scary because it also represents the rate that we are burning up fossil fuel. Right now its exponentially increasing with a finite amount available. Not to mention that burning the fossil fuel is causing the planet to warm up. Fast exponential rise on something not sustainable.. does that smell like a bubble to anyone else or am I just being paranoid..
Last edited by waltcolorado; 08-14-2018 at 09:59 AM..
On the co2 graph-- from 1950 to present one could easily make the mistake of calling it linear on eye-balling it. Zoom out to include 1750-present and it's a classic exponential curve. I suspect it's really the first half of a logistic function- the classic equation for a growth phenomenon- y = nk (1-n). We'll hit an inflection point at peak usage and the growth will slow down to eventually approach an asymptote. (Hubert's "peak oil" graph is actually just a graph of the derivative of the logistic equation graph.)
I still stand by my position that fossil fuels/co2 are an insignificant part of global warming. One can trace the history of the GW movement back to politics- started ironically by the conservative Margaret Thatcher. Rahm Emmanuel said it best: "Exploit every crisis." Right out of the Rules for Radicals by the communist Sol Alinsky.
I still stand by my position that fossil fuels/co2 are an insignificant part of global warming. One can trace the history of the GW movement back to politics- started ironically by the conservative Margaret Thatcher. Rahm Emmanuel said it best: "Exploit every crisis." Right out of the Rules for Radicals by the communist Sol Alinsky.
And at this point arguments like this seem to be the only basis for dismissing C02 emissions from burning fossil fuel as a main or at least very significant contributor for the 1C change we actually have experienced.
FYI, while we completely disagreed about results, I have appreciated your input here bringing up a lot of good points and respect your opinion.
I still stand by my position that fossil fuels/co2 are an insignificant part of global warming. One can trace the history of the GW movement back to politics- started ironically by the conservative Margaret Thatcher. Rahm Emmanuel said it best: "Exploit every crisis." Right out of the Rules for Radicals by the communist Sol Alinsky.
Of course natural causes of warming are greater than anthropomorphic ones. Without our atmosphere Earth average temperature would be about 0º F. Damn, you really don't understand this stuff at all.
And at this point arguments like this seem to be the only basis for dismissing C02 emissions from burning fossil fuel as a main or at least very significant contributor for the 1C change we actually have experienced.
FYI, while we completely disagreed about results, I have appreciated your input here bringing up a lot of good points and respect your opinion.
I thank you for the intelligent, respectful discussion. Too often the sides on this subject are drawn on ideological grounds without an honest evaluation of the facts.
I find it important to avoid taking active measures in trying to change our habits or worse, to actively try to prevent further warming by hair-brained plans like injecting the atm with aerosols to block sunlight. I'm reminded of the Medieval Al Gore who noticed the villages with the most Plague were the ones with the most dogs & cats, so he talked his town elders into killing off dogs & cats. The Plague then got worse, of course, because it was the dogs & cats who were checking the rat population, the rats being the carriers of the Plague vectors. We have a long history of doing the wrong thing when it comes to influencing MotherNature.
The 'mini-ice age' that lasted from the 1500s until the mid 1800s that followed the medieval warming period goes to show you that people can and will adapt to whatever comes along.
Um, they did not adapt.
The deaths of Millions of people in Scandinavian States and Central Europe due to starvation caused by famine as the result of the mini-Ice Age is not an "adaptation."
That is a disaster.
In Colonial America, everything north of what is now Interstate 80 had a growing season of just 6 weeks.
The ground was frozen and couldn't be tilled until the last week of June or first week of July, and the first frost came and killed everything around the 2nd week of August.
That negatively impacted the more than one hundred colonies in the New England region.
Everything between what is now I-70 and I-80 had a growing season of just 10 weeks.
Fortunately, the Virginia and Carolina colonies (North and South Carolina did not exist yet, and neither did Georgia) were able to produce enough food to avoid famine, but food prices came with "sticker shock."
While the colonists managed to survive, apologists ignore the fact that tens of thousands of Native Americans who lived in western Pennsylvania, Ohio, Indiana, Michigan, Illinois, Wisconsin, Minnesota and the Dakotas who engaged in agriculture rather than a semi-nomadic or nomadic life-style died of famine, because they couldn't produce enough food to feed themselves.
We have no way of knowing about the interior of North America, but it's quite likely snowfall was more intense, stayed on the ground longer, and blizzards may have been more frequent, and that would have seriously impeded the semi-nomadic and nomadic tribes in their quest for food on hunts.
Even now, with modern mechanical agriculture, you cannot plow frozen soil. Nearly all farmers use what is called a rip plow, and it won't work if the soil is frozen. There's an actual test farmers use. You take a piece of re-bar and hit it with a standard 5 pound sledgehammer. If the rod goes into the soil, you can plow, but if it doesn't, you can't.
Even if the first 1" to 2" of soil isn't frozen, you may have to plow a 2nd or 3rd time, which will delay planting by one to two weeks, and planting before the last frost is risky.
Another mini-Ice Age would wreck havoc with the global food supply, resulting in nearly all States resorting to food rationing, and probably implementing price controls as well, because food prices will sky-rocket.
Because of modern storage facilities and transportation, I doubt that Millions would die, and probably no one would actually die of famine, but it would be devastating economically and socially, and maybe even politically for a few States.
The economic issues would arise from decreased productivity and income, due to weather related power outages and the closures of schools and businesses due to impassable roads and other conditions.
Of course natural causes of warming are greater than anthropomorphic ones. Without our atmosphere Earth average temperature would be about 0º F. Damn, you really don't understand this stuff at all.
It's a little more complicated than you think, Einstein.
co2 only directly adds 0.9 -3.3 degK to Earth's 288degK atm temp.
However, it has an indirect effect on water vapor levels-- without any co2, the level of atm h2o, the most important ghg, would fall (due to cooling) and the net result would be a temp of ~ 273degK (the freezing point of water).
OTOH-- rising co2 would lead to higher h20 (ie-more warming) BUT- also more clouds & rain (ie- even more cooling) Negative Feedback. That's why the planet manages to stay in the Goldilocks Zone.
We've been over this before here. Please try to pay attention.
Please register to post and access all features of our very popular forum. It is free and quick. Over $68,000 in prizes has already been given out to active posters on our forum. Additional giveaways are planned.
Detailed information about all U.S. cities, counties, and zip codes on our site: City-data.com.

 Please register to participate in our discussions with 2 million other members - it's free and quick! Some forums can only be seen by registered members. After you create your account, you'll be able to customize options and access all our 15,000 new posts/day with fewer ads.