Please register to participate in our discussions with 2 million other members - it's free and quick! Some forums can only be seen by registered members. After you create your account, you'll be able to customize options and access all our 15,000 new posts/day with fewer ads.
Using Walmart as an example, given that Walmart's Net Income (Profit) was $16,389,000 in 2011, that amount could be reduced and still leave more than enough profit.
You did not say you wanted to increase the wealth of the wealthiest, but if productivity increases, and wages are stagnant, where do you think much of the money goes? It's going to the owners of production, and CEOs and top executives of corporations, as well as Wall St. swine.
Actually the stagnant wage is just a myth as it does not take into account compensation. And even this chart does not take into account the increasing taxes on business and regulatory costs.
Of course I am not saying the top 1% are taking a lot of the gain. But the stagnant wage myth is still just a myth. Also, if they did not get the gain it would not have been distributed to the rest of the population. The money would be likely to go abroad.
Also, I would recommend you to not use terms like Wall Street swine. It makes you look stupid.
Quote:
The money is not all put back in. Most companies are sitting on record amounts of cash at this time.
They could even burn the money. It still does not vanish. Lets make an example of this
Carl owns a farm, he produces 10 chickens a year. That is the total economy and is shared between Lisa and Tom. Lisa buys chickens from the farm which she sells to Tom for profit. Tom loses money, Lisa and Carl earn money.
So how many chickens is produced if
1. He burns the money
2. He put his money into a safe vault and do not spend it.
3. He donates the money to Tom and Lisa
4. He loans the money to Lisa who acts as a bank who loans money to Tom
5. He invests the money into hiring Tom to work on the farm
6. Lisa buys up all the chicken
With the exception of 5, the economy stay at the same size. Saving has no influence on the size of the economy. For 1 and 2 if he burns the money or put it in a safe vault, then Tom will start to run out of money. To be able to keep selling his chicken, he have to reduce his price of the chicken. Hence, doing nothing with the money is deflationary which is good for the economy as the inflation is too high.
For 3, and 4 the extra money will let Tom be able to keep buying Chicken as he gets extra money. Hence everything will stay as normal till maybe Carl stops giving/borrowing money.
5. Is the best one. Carl realizes Tom is without employment and uses his money to hire Tom. Hence the production of chicken increases and the price per chicken drops. That is what we call growth.
6 is the problematic one as when Lisa buys up all the chicken, drives up prices so Tom will be unable to buy chicken and will starve. Hence the worse case scenario is if rich people start spending their money. That will drive up inflation and force the government to cut.
Many people seem to get lost in economics and do not understand it on a fundamental level. Its all about supply, not demand. If you can not understand the economy on a fundamental level, then there is no way you will understand it on a big level.
Hence you ended up writing the contradictory mess below where you think savings get lost and do not contribute to aggregate demand. In reality it does.
Quote:
Ultimately better performance results in higher stock prices and maybe some dividends. Since wealthy people own most of the stocks in this country, they benefit, their wealth grows which benefits the economy and the rest of the country hardly at all. It does not lead to an increase in aggregate demand. (Wealthy people do not spend more when their wealth increases by a percentage, they save more, poor and middle-class people do spend more.)
The world of absolutes.
To some it is the either you are for us or you are against us mentality.
Worse still if you don't want to join us then you obviously hate us.
Why can't it be a matter of I don't want to join because I don't believe your interests are the same as mine?
Political discussions on this forum are the same.
I have been called a liberal and I have been called a RWNJ. Why because I don't believe in either party. In fact I know that both major parties are very bad for this nation.
Unions. Unions have paved the way for many of todays benefits and labor laws. Unions have also been involved with organized crime and corruption.
I choose not to join a Union because where I work they treat their employees very well. They always have.
The Union even admits that they wouldn't be able to get us any more than we already have. Why would I vote to go Union if they at best can't deliver more than what have and worse will negotiate us right out of our jobs as we have seen so many times.
It isn't about hate. It's about maybe just maybe not everyone needs a Union to represent them.
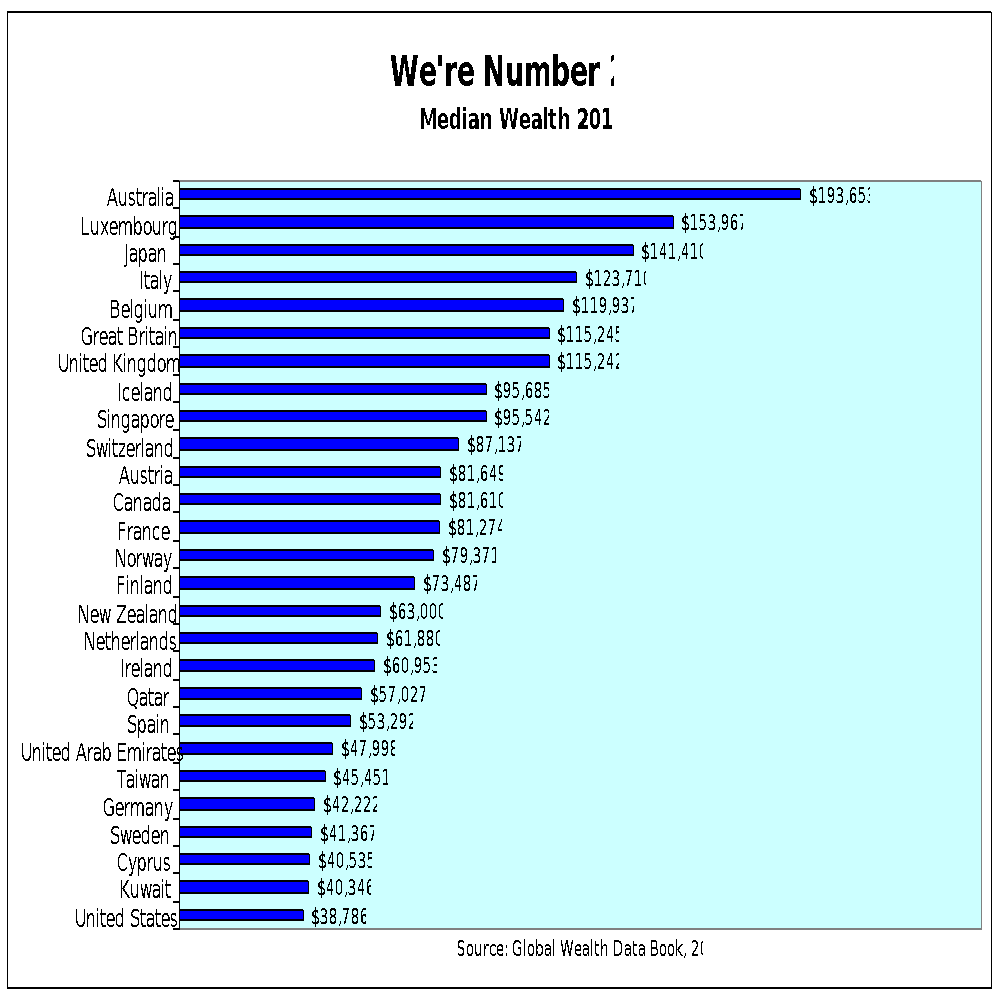
One measure of how well the middle class is doing is a country's median wealth. Wealth is measured by the total sum of all our assets (homes, bank accounts, stocks, bonds etc.) minus our liabilities (outstanding loans and other debts). It the best indicator we have for individual and family prosperity.
Median wealth describes the amount of wealth accumulated by the population in the middle of the wealth distribution—50 percent of the adult population has more wealth, while 50 percent has less. It takes away the outsize effects of some people having an incredibly high level of wealth, which skews a numeric average higher.
The chart below shows where the U.S. ranks on median wealth. We're #......27..
And one factor contributing to this sorry state is that American "weak labor laws undermine unions and give large corporations more power to keep wages and benefits down. Unions now represent less than 7 percent of all private sector workers, the lowest ever recorded."
Based on your chart I kick the hell out of Australia and so does just about every single person who works in the mill that I do. Why do we need a Union?
Using Walmart as an example, given that Walmart's Net Income (Profit) was $16,389,000 in 2011, that amount could be reduced and still leave more than enough profit.
You did not say you wanted to increase the wealth of the wealthiest, but if productivity increases, and wages are stagnant, where do you think much of the money goes? It's going to the owners of production, and CEOs and top executives of corporations, as well as Wall St. swine.
The money is not all put back in. Most companies are sitting on record amounts of cash at this time. Ultimately better performance results in higher stock prices and maybe some dividends. Since wealthy people own most of the stocks in this country, they benefit, their wealth grows which benefits the economy and the rest of the country hardly at all. It does not lead to an increase in aggregate demand. (Wealthy people do not spend more when their wealth increases by a percentage, they save more, poor and middle-class people do spend more.)
It is a myth that there are stagnant wages. Read this article and I will highlight the main ideas why wages have not been stagnant below:
1) Those who say that wages are stagnant since 1960 make a huge error. They ignore that women and immigrants have entered the work force in massive numbers over the time period and often at the lower end of the pay scale - the fact that our economy has absorbed these new workers is a sign of strength. The addition of low pay workers by the millions forces the "average" wage down.
2) Studies that show real life individuals, which corrects for the overlooked error in #1 above, over time consistently show that most people do not have stagnant wages, in fact most people have wages that grow faster than CPI inflation.
3) Total compensation is up. 31% of total compensation is now benefits and only 69% is wages - health insurance, Flex, Dental insurance, Eye insurance, paid time off, retirement etc add up and is a real form of compensation...
4) Household spending on food, housing, utilities, etc. has fallen from 53% of disposable income in 1950 to 32% today.
5) Products and services have improved. If you were severely ill, would you rather have 1980s healthcare with its prices or 2013 healthcare with its prices. As Warren Buffett said, the typical American has it better than Rockefeller - better doctors, better technology (internet), better travel, etc...
Last edited by michiganmoon; 06-19-2013 at 08:53 PM..
One measure of how well the middle class is doing is a country's median wealth. Wealth is measured by the total sum of all our assets (homes, bank accounts, stocks, bonds etc.) minus our liabilities (outstanding loans and other debts). It the best indicator we have for individual and family prosperity.
Median wealth describes the amount of wealth accumulated by the population in the middle of the wealth distribution—50 percent of the adult population has more wealth, while 50 percent has less. It takes away the outsize effects of some people having an incredibly high level of wealth, which skews a numeric average higher.
The chart below shows where the U.S. ranks on median wealth. We're #......27..
And one factor contributing to this sorry state is that American "weak labor laws undermine unions and give large corporations more power to keep wages and benefits down. Unions now represent less than 7 percent of all private sector workers, the lowest ever recorded."
We have the highest rate on the list of dirt poor immigrants coming into the country that forces these #s down. Should we ban poor immigrants from coming into the country so you can feel good about these bogus comparisons? We also have the highest rate of single parents on the list that also forces these #s down.
Additionally, tiny oil countries might not be a fair comparison to a vast country of ~320 million.
Your stats are not comparing apples to apples.
Show at least 3rd generation within a country and we will fare much better, but that isn't the point is it?
One measure of how well the middle class is doing is a country's median wealth. Wealth is measured by the total sum of all our assets (homes, bank accounts, stocks, bonds etc.) minus our liabilities (outstanding loans and other debts). It the best indicator we have for individual and family prosperity.
Median wealth describes the amount of wealth accumulated by the population in the middle of the wealth distribution—50 percent of the adult population has more wealth, while 50 percent has less. It takes away the outsize effects of some people having an incredibly high level of wealth, which skews a numeric average higher.
The chart below shows where the U.S. ranks on median wealth. We're #......27..
And one factor contributing to this sorry state is that American "weak labor laws undermine unions and give large corporations more power to keep wages and benefits down. Unions now represent less than 7 percent of all private sector workers, the lowest ever recorded."
I must say this is one of the dumbest posts I have read in a very long time.
No, wealth is not the best indicator for living standards. Supposedly according to your index you are three times better off in Italy than in Germany. Also I find it interesting how some countries vanished from the list. Qatar, Kuwait, UAE, Cyprus is included, but Portugal, Poland, and Greece isn't. In fact I can't even find Denmark. Still you ate this "study" raw.
Now let's be honest. You were actually looking for something better, such as incomes. But since incomes all show US to be in the top, then you couldn't use that. Hence, you noticed wealth. As it fitted your interest, it became the factor for living standards.
I think we rather should look at income.
This is average disposable income adjusted for costs
1 United States 42,050
2 Ireland 41,170
3 Luxembourg 37,997
4 Switzerland 35,471
5 Australia 34,952
6 United Kingdom 33,513
7 Canada 32,662
8 Norway 32,620
9 South Korea 31,051
10 Netherlands 29,269
11 Austria 29,008
12 Sweden 28,301
13 Denmark 27,974
14 Japan 27,763
15 France 27,452
16 Spain 26,856
17 Finland 25,747
18 Belgium 25,642
19 Israel 24,225
20 Germany 24,174
21 Italy 23,194
22 Greece 21,352
23 Portugal 17,170
24 Czech Republic 15,115
25 Slovakia 14,701
26 Poland 14,390
27 Estonia 13,737
28 Hungary 12,843
They're bullies. They're like gangs really, though slightly more civilized. They once served a purpose and now do more harm than good. And really, they do more harm to the entire country economically.
Please register to post and access all features of our very popular forum. It is free and quick. Over $68,000 in prizes has already been given out to active posters on our forum. Additional giveaways are planned.
Detailed information about all U.S. cities, counties, and zip codes on our site: City-data.com.

 Please register to participate in our discussions with 2 million other members - it's free and quick! Some forums can only be seen by registered members. After you create your account, you'll be able to customize options and access all our 15,000 new posts/day with fewer ads.