Please register to participate in our discussions with 2 million other members - it's free and quick! Some forums can only be seen by registered members. After you create your account, you'll be able to customize options and access all our 15,000 new posts/day with fewer ads.
The following calculations use the numbers from the ALG study, that the author references, to deteremine the largest contributors to the growth in that proportion of the population that is not in the labor force (NILF) or non participants.
From 2003 to 2013 (range in ALG study) 15.6 million people were added to the NILF category. The group with the largest addition was for those over 65.
65+ 5.8 million
55-64 3.5 million
25-54 2.6 million
-24 3.6 million.
Clearly the 65+ where the largest contributors to the decline. The 24 and under number is barely above the 55-64 number.
How do you not understand that those NILF (NOT In the Labor Force) are NOT counted in the LFPR (Labor Force Participation Rate)?
Quote:
"According to the BLS, "the participation rate is the share of the population 16 years and older working or seeking work."
Again... those not even counted in the LFPR statistics are not the cause of the overall LFPR decline. The problem is the declining LFPR of the largest generation, the Millennials.
It is EXTREMELY frustrating to deal with such ignorance.
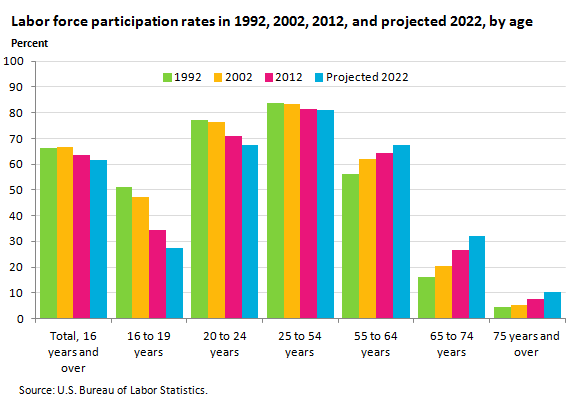
Indeed, I do. I very clearly stated that the Millennials (currently age 18 to 34) are the most populous generation. Their LFPR has been declining, while the LFPR of those age 55 to 64 has been increasing. The overall LFPR is declining because of the impact of Millenials' declining LFPR, not because the LFPR of those age 55 to 64 is increasing.
Job prospects have been better for Millenials of late but not so much for boomers. Millenials are still enduring the labor force so of course those in college whether it is an associate, bachelor's or masters program (without jobs) or even still in.high school, they aren't going to be counted in the LFPR but they will soon. Those boomers, they may leave at the same time making a net 0 effect because those cohorts see fairly the same size or make it higher. It's not like Millenials are Gen X sized. So you are kinda right but for the wrong reason but the boomers still are a population to watch with how they retire out.
Job prospects have been better for Millenials of late but not so much for boomers. Millenials are still enduring the labor force so of course those in college whether it is an associate, bachelor's or masters program (without jobs) or even still in.high school, they aren't going to be counted in the LFPR but they will soon. Those boomers, they may leave at the same time making a net 0 effect because those cohorts see fairly the same size or make it higher. It's not like Millenials are Gen X sized. So you are kinda right but for the wrong reason but the boomers still are a population to watch with how they retire out.
But they are not. The numbers of 55+ working is going up as they delay retirement.
And, yet... those age 55 to 64 have an increasing LFPR while Millennials' LFPR is consistently declining.
I ask of you to please show your work on the millennials. I'm also willing to bet that most of the millennials not in the LFPR fall into two categories: In school (as I mentioned in my previous post) graduated during the recession and "early recovery" and still "waiting for the economy to 'pick up.'" As I told my father last night when talking to him, should Obama had the job numbers he did in 2014 back in 2012, he would have had at least 2008 numbers if not higher and not just from millennials.
Quote:
Originally Posted by HappyTexan
But they are not. The numbers of 55+ working is going up as they delay retirement.
It is but will it continue or will it drop off. THAT'S why we need to look at them. No doubt, many returned due to 401Ks drying up or being tapped into but they wont work forever.
I'm also willing to bet that most of the millennials not in the LFPR fall into two categories: In school (as I mentioned in my previous post) graduated during the recession and "early recovery" and still "waiting for the economy to 'pick up.'"
Exactly, and as such they are categorized by the BLS as NILF: NOT In the Labor Force, which means they are NOT factored into the Millennial's DECLINING LFPR.
Again... those not even counted in the LFPR statistics are not the cause of the overall LFPR decline. The problem is the declining LFPR of the largest generation, the Millennials.
It is EXTREMELY frustrating to deal with such ignorance.
How do you not understand that it is the size of the NILF that makes up the 37.1% that are not participating. As the percentage of population in the NILF category increases the percentage of population in LFPR category goes down ie NILF%+LFPR% = 100%.
So which sector of the population has added the most to the NILF% over the last decade? Those over 55.
How do you not understand that it is the size of the NILF that makes up the 37.1% that are not participating. As the percentage of population in the NILF category increases the percentage of population in LFPR category goes down ie NILF%+LFPR% = 100%.
The NILF population is NOT included in the LFPR statistics. It doesn't get any simpler than that. How can you and other liberals be so frustratingly obtuse?
Fair stats but as I said explainable but maybe not a long term trend. That is why the college aged and 55+ need to be looked at.
Please register to post and access all features of our very popular forum. It is free and quick. Over $68,000 in prizes has already been given out to active posters on our forum. Additional giveaways are planned.
Detailed information about all U.S. cities, counties, and zip codes on our site: City-data.com.

 Please register to participate in our discussions with 2 million other members - it's free and quick! Some forums can only be seen by registered members. After you create your account, you'll be able to customize options and access all our 15,000 new posts/day with fewer ads.