Albany, CA (California) Houses and Residents
| Albany: | $1,234,420 |
| California: | $715,900 |
Mean price in 2022:
Detached houses: $1,457,507
Here: $1,457,507 State: $988,808 Townhouses or other attached units: $1,029,205
Here: $1,029,205 State: $838,546 In 2-unit structures: $1,037,644
Here: $1,037,644 State: $1,138,100 In 3-to-4-unit structures: $612,002
Here: $612,002 State: $824,253 In 5-or-more-unit structures: $551,645
Here: $551,645 State: $730,996
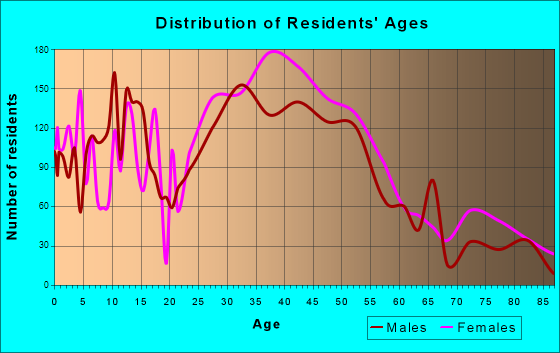
Total population: 19,488 (Urban population: 16,444, Rural population: 0)
Houses: 8,301 (7,882 occupied: 3,987 owner occupied, 3,901 renter occupied)
| % of renters here: | 49% |
| State: | 44% |
Housing density: 4,879 houses/condos per square mile
Median price asked for vacant for-sale houses and condos in 2022 in this county: $1,043,180.
Median contract rent in 2022: over $2,000 (lower quartile is $1,857, upper quartile is over $2,000)
Median rent asked for vacant for-rent units in 2022: $2,312
Median gross rent in Albany, CA in 2022: over $2,000
Housing units in Albany with a mortgage: 2,530 (376 second mortgage, 0 home equity loan, 346 both second mortgage and home equity loan)
Houses without a mortgage: 76
Median household income for houses/condos with a mortgage: $231,185
Median household income for apartments without a mortgage: $113,155
Median monthly housing costs: $2,301
Compare current foreclosures near Albany, CA:
| Photo | Address | Area | Beds / Baths | Price | Details |
|---|---|---|---|---|---|

|
#1
Ramona Ave
Albany, CA 94706
|
1,509 sq. feet
|
2 baths 2 beds |
show details | |

|
#2
Pierce St Apt 1203
Albany, CA 94706
|
1,170 sq. feet
|
2 baths 2 beds |
show details | |

|
#3
Adams St
Albany, CA 94706
|
1,658 sq. feet
|
2 baths 3 beds |
show details | |

|
#4
Key Route Blvd
Albany, CA 94706
|
763 sq. feet
|
1 baths 2 beds |
show details | |

|
#5
Marin Ave
Albany, CA 94706
|
1,154 sq. feet
|
1 baths 2 beds |
show details | |

|
#6
Stannage Ave
Albany, CA 94706
|
1,100 sq. feet
|
1 baths 3 beds |
show details | |

|
#7
San Pablo Ave
Albany, CA 94706
|
- sq. feet
|
- baths - beds |
show details | |

|
#8
Solano Ave # 211
Albany, CA 94706
|
- sq. feet
|
- baths - beds |
show details | |

|
#9
Macarthur Blvd
Oakland, CA 94605
|
1,313 sq. feet
|
3 baths 3 beds |
$599,000
|
show details |

|
#10
Thorndale Dr Apt 435
San Rafael, CA 94903
|
1,096 sq. feet
|
2 baths 2 beds |
$149,900
|
show details |
| Photo | Address | Area | Beds / Baths | Price | Details |
|---|---|---|---|---|---|

|
#11
2nd St
Richmond, CA 94801
|
887 sq. feet
|
1 baths 3 beds |
$364,000
|
show details |

|
#12
Thorndale Dr Apt 206
San Rafael, CA 94903
|
660 sq. feet
|
1 baths 1 beds |
$59,900
|
show details |

|
#13
El Portal Dr Apt D
San Pablo, CA 94806
|
1,058 sq. feet
|
2 baths 2 beds |
show details | |

|
#14
Mohr Ln Apt C
Concord, CA 94518
|
870 sq. feet
|
1 baths 2 beds |
show details | |

|
#15
Kelsey St
Richmond, CA 94801
|
1,080 sq. feet
|
3 baths 4 beds |
show details | |

|
#16
Ritchie St
Oakland, CA 94605
|
2,208 sq. feet
|
2 baths 3 beds |
show details | |

|
#17
Sequoia Valley Rd
Mill Valley, CA 94941
|
2,177 sq. feet
|
2 baths 3 beds |
show details | |

|
#18
Jane Ct
Martinez, CA 94553
|
1,121 sq. feet
|
2 baths 3 beds |
show details | |

|
#19
Cayuga Ave
San Francisco, CA 94112
|
1,340 sq. feet
|
1 baths 3 beds |
show details | |

|
#20
Harmon Rd
El Sobrante, CA 94803
|
1,031 sq. feet
|
1 baths 3 beds |
show details |
| Photo | Address | Area | Beds / Baths | Price | Details |
|---|---|---|---|---|---|

|
#21
Grant St
Vallejo, CA 94590
|
929 sq. feet
|
2 baths 3 beds |
show details | |

|
#22
Madrid St
San Francisco, CA 94112
|
1,018 sq. feet
|
1 baths 4 beds |
show details | |

|
#23
1/2 Warren Ave
Vallejo, CA 94591
|
972 sq. feet
|
2 baths 2 beds |
show details | |

|
#24
Vienna St
San Francisco, CA 94112
|
760 sq. feet
|
1 baths 3 beds |
show details | |

|
#25
31st Ave
San Francisco, CA 94116
|
1,115 sq. feet
|
1 baths 2 beds |
show details | |

|
#26
Warner Ct
San Rafael, CA 94901
|
1,664 sq. feet
|
2 baths 4 beds |
show details | |

|
#27
9th Ave
San Francisco, CA 94116
|
4,816 sq. feet
|
4 baths 6 beds |
show details | |

|
#28
Madrid St
San Francisco, CA 94112
|
1,745 sq. feet
|
2 baths 3 beds |
show details | |

|
#29
Harkness Ave
San Francisco, CA 94134
|
1,412 sq. feet
|
2 baths 3 beds |
show details | |

|
#30
Cedar Ct
Daly City, CA 94014
|
1,200 sq. feet
|
2 baths 3 beds |
show details |
| Photo | Address | Area | Beds / Baths | Price | Details |
|---|---|---|---|---|---|

|
#31
Paul Ct
Benicia, CA 94510
|
2,099 sq. feet
|
3 baths 4 beds |
show details | |

|
#32
Vale Rd Apt 35
San Pablo, CA 94806
|
1,858 sq. feet
|
3 baths 3 beds |
show details | |

|
#33
Lobos St
San Francisco, CA 94112
|
750 sq. feet
|
1 baths 2 beds |
show details | |

|
#34
Patrick Ct
Vallejo, CA 94591
|
1,056 sq. feet
|
1 baths 3 beds |
show details | |

|
#35
Los Angeles St
Emeryville, CA 94608
|
803 sq. feet
|
1 baths 2 beds |
show details | |

|
#36
Snyder Ln
Walnut Creek, CA 94598
|
4,709 sq. feet
|
3 baths 5 beds |
show details | |

|
#37
Highland Dr
Concord, CA 94520
|
1,188 sq. feet
|
2 baths 3 beds |
show details | |

|
#38
Byxbee St
San Francisco, CA 94132
|
800 sq. feet
|
1 baths 1 beds |
show details | |

|
#39
Garfield St
San Francisco, CA 94132
|
1,355 sq. feet
|
1 baths 3 beds |
show details | |

|
#40
Acapulco Rd
San Leandro, CA 94577
|
1,196 sq. feet
|
2 baths 3 beds |
show details |
| Photo | Address | Area | Beds / Baths | Price | Details |
|---|---|---|---|---|---|

|
#41
Bolla Ave
Alamo, CA 94507
|
4,658 sq. feet
|
4 baths 4 beds |
show details | |

|
#42
Bernhard Ave
Richmond, CA 94805
|
4,315 sq. feet
|
3 baths 4 beds |
show details | |

|
#43
Steffan St
Vallejo, CA 94591
|
1,965 sq. feet
|
2 baths 3 beds |
show details | |

|
#44
36th St
Richmond, CA 94805
|
1,116 sq. feet
|
1 baths 2 beds |
show details | |

|
#45
Minerva St
San Francisco, CA 94112
|
878 sq. feet
|
1 baths 2 beds |
show details | |

|
#46
Holloway Ave
San Francisco, CA 94132
|
1,110 sq. feet
|
5 baths 1 beds |
show details | |

|
#47
Lincoln Ave
Richmond, CA 94804
|
795 sq. feet
|
1 baths 2 beds |
show details | |

|
#48
Heide Ct
El Sobrante, CA 94803
|
4,151 sq. feet
|
3 baths 5 beds |
show details | |

|
#49
-1725 7th Ave
San Francisco, CA 94122
|
2,376 sq. feet
|
2 baths 4 beds |
show details | |

|
Check over 1 million property listings on Foreclosure.com!
|
browse all offers | |||

Latest news about housing in Albany, CA collected exclusively by city-data.com from local newspapers, TV, and radio stations

 | Report: Only 1 CA Metro Area Among 10 Most Overpriced Housing Markets (4 replies) |
| Buying a house in East Oakland (99 replies) |
| Buy in Richmond vs. Rent in Berkeley (51 replies) |
| Rent or Buy in Bay Area? (11 replies) |
| Struggling with Finding Retirement City (31 replies) |
| Marin columnist slams SF's hypocrisy in housing (70 replies) |
Median year apartment built: 1970
Household type by relationship:
Households: 19,607- Male householders: 3,835 (713 living alone), Female householders: 3,748 (1,038 living alone)
4,006 spouses (3,951 opposite-sex spouses), 802 unmarried partners, (748 opposite-sex unmarried partners), 5,893 children (5,405 natural, 194 adopted, 293 stepchildren), 127 grandchildren, 125 brothers or sisters, 169 parents, 0 foster children, 39 other relatives, 543 non-relatives
- In group quarters: 316
Size of family households: 2,158 2-persons, 1,550 3-persons, 1,126 4-persons, 302 5-persons, 62 6-persons, 8 7-or-more-persons.
Size of nonfamily households: 1,852 1-person, 826 2-persons, 64 3-persons, 3 4-persons.
3,572 married couples with children.
926 single-parent households (205 men, 721 women).
64.4% of residents of Albany speak English at home.
5.9% of residents speak Spanish at home (86% speak English very well, 10% speak English well, 2% speak English not well, 2% don't speak English at all).
8.6% of residents speak other Indo-European language at home (90% speak English very well, 8% speak English well, 1% speak English not well, 1% don't speak English at all).
20.6% of residents speak Asian or Pacific Island language at home (55% speak English very well, 30% speak English well, 13% speak English not well, 2% don't speak English at all).
0.2% of residents speak other language at home (100% speak English very well).
Foreign born population: 5,476 (27.9%)
(53.4% of them are naturalized citizens)
| Here: | 5.7 |
| State: | 6.0 |
| Here: | 3.9 |
| State: | 3.9 |

- Bedrooms in owner-occupied houses and condos in Albany, California
- 14no bedroom
- 1301 bedroom
- 1,7152 bedrooms
- 1,3703 bedrooms
- 6404 bedrooms
- 1185+ bedrooms

- Bedrooms in renter-occupied apartments in Albany, California
- 162no bedroom
- 1,0171 bedroom
- 2,2232 bedrooms
- 4393 bedrooms
- 554 bedrooms
- 55+ bedrooms

- Cars and other vehicles available in Albany in owner-occupied houses/condos
- 93no vehicle
- 1,7301 vehicle
- 1,6322 vehicles
- 4203 vehicles
- 1044 vehicles
- 95+ vehicles

- Cars and other vehicles available in Albany in renter-occupied apartments
- 595no vehicle
- 2,1161 vehicle
- 1,0682 vehicles
- 1083 vehicles
- 144 vehicles
- 05+ vehicles

- Rooms in owner-occupied houses in Albany, California
- 71 room
- 212 rooms
- 2403 rooms
- 6484 rooms
- 8755 rooms
- 8886 rooms
- 5697 rooms
- 4748 rooms
- 2659+ rooms

- Rooms in renter-occupied apartments in Albany, California
- 1491 room
- 4002 rooms
- 8673 rooms
- 1,5264 rooms
- 6745 rooms
- 1436 rooms
- 717 rooms
- 468 rooms
- 269+ rooms


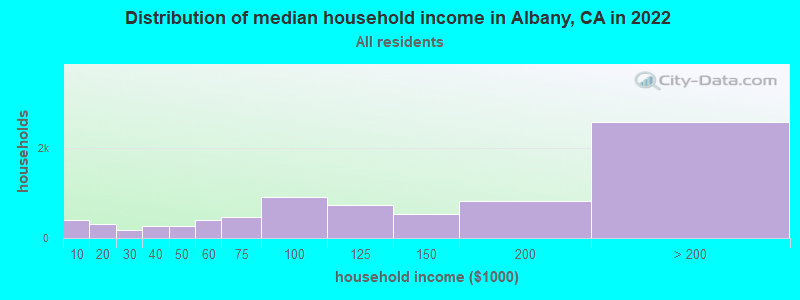
Albany, CA household income distribution

- 394Less than $10,000
- 320$10,000 to $19,999
- 188$20,000 to $29,999
- 277$30,000 to $39,999
- 277$40,000 to $49,999
- 394$50,000 to $59,999
- 470$60,000 to $74,999
- 908$75,000 to $99,999
- 736$100,000 to $124,999
- 541$125,000 to $149,999
- 822$150,000 to $199,999
- 2,572$200,000 or more
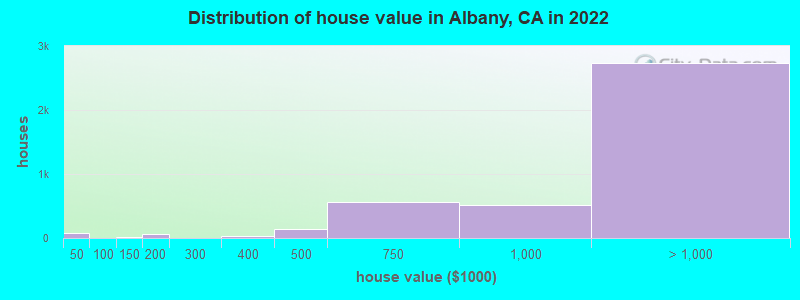
Home value of owner - occupied houses in 2022 in Albany, CA
-
- 60Less than $10,000
- 12$10,000 to $14,999
- 3$30,000 to $34,999
- 10$100,000 to $124,999
- 9$125,000 to $149,999
- 56$150,000 to $174,999
- 25$300,000 to $399,999
- 136$400,000 to $499,999
- 555$500,000 to $749,999
- 511$750,000 to $999,999
- 1,445$1,000,000 to $1,499,999
- 798$1,500,000 to $1,999,999
- 486$2,000,000 or more
Rent paid by renters in 2022 in Albany, CA
-
- 13$200 to $249
- 2$300 to $349
- 35$400 to $449
- 12$800 to $899
- 144$1,000 to $1,249
- 108$1,250 to $1,499
- 1,001$1,500 to $1,999
- 1,537$2,000 to $2,499
- 481$2,500 to $2,999
- 233$3,000 to $3,499
- 186$3,500 or more
- 72No cash rent


Percentage of workers working in this county: 74.4%
Number of people working at home: 4,351 (42.7% of all workers)
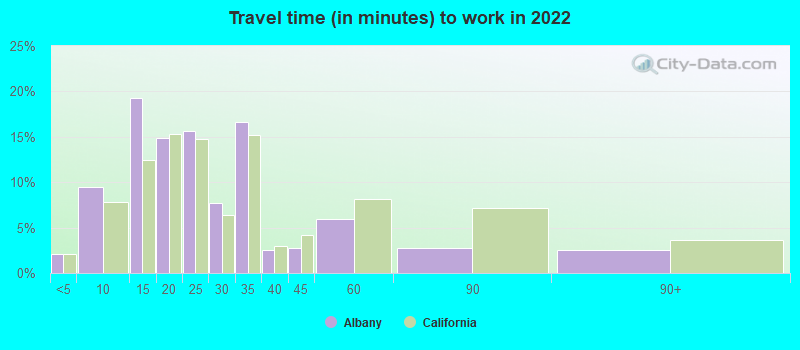
Travel time to work (commute)
- Less than 5 minutes: 174
- 5 to 9 minutes: 351
- 10 to 14 minutes: 640
- 15 to 19 minutes: 825
- 20 to 24 minutes: 991
- 25 to 29 minutes: 422
- 30 to 34 minutes: 1,037
- 35 to 39 minutes: 172
- 40 to 44 minutes: 293
- 45 to 59 minutes: 718
- 60 to 89 minutes: 596
- 90 or more minutes: 132
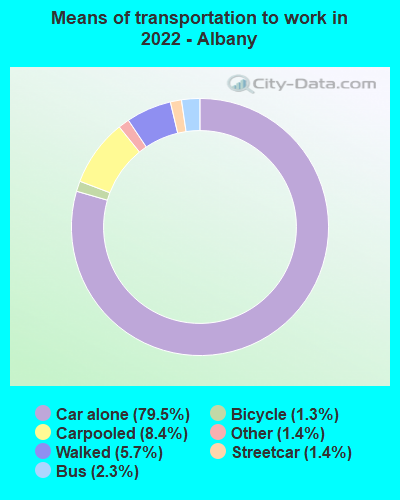
Means of transportation to work:
- Drove a car alone: 3,536 (43.5%)
- Carpooled: 389 (4.8%)
- Bus: 87 (1.1%)
- Subway or elevated rail: 49 (0.6%)
- Taxi: 66 (0.8%)
- Bicycle: 63 (0.8%)
- Walked: 254 (3.1%)
- Worked at home: 4,351 (53.5%)

- Unemployment by race in 2022
- Unemployment rate for White non-Hispanic residents
- 2.9%Males
- 2.3%Females
- Unemployment rate for Black residents
- 5.9%Males
- Unemployment rate for Asian residents
- 1.1%Males
- 3.6%Females
- Unemployment rate for other race residents
- 2.6%Males
- Unemployment rate for two or more race residents
- 1.1%Males
- 4.1%Females
- Unemployment rate for Hispanic or Latino residents
- 2.5%Males
- 3.8%Females

- Year of entry for the foreign-born population in Albany, California
- 2,1962010 or later
- 1,5382000 to 2009
- 8881990 to 1999
- 1,0771980 to 1989
- 5711970 to 1979
- 648Before 1970

First ancestries reported:
- European: 384 (3.8%)
- English: 356 (3.6%)
- American: 281 (2.8%)
- Iranian: 240 (2.4%)
- German: 218 (2.2%)
- Albanian: 202 (2.0%)
- Italian: 176 (1.8%)
- Irish: 164 (1.6%)
- Eastern European: 129 (1.3%)
- French: 113 (1.1%)
- Northern European: 101 (1.0%)
- Jamaican: 94 (0.9%)
- Polish: 79 (0.8%)
- Norwegian: 73 (0.7%)
- French Canadian: 64 (0.6%)
- Russian: 61 (0.6%)
- British: 37 (0.4%)
- African: 37 (0.4%)
- Swedish: 37 (0.4%)
- Scottish: 32 (0.3%)
- Turkish: 31 (0.3%)
- Danish: 28 (0.3%)
- Dutch: 27 (0.3%)
- Romanian: 26 (0.3%)
- Hungarian: 24 (0.2%)
- Brazilian: 22 (0.2%)
- Scotch-Irish: 21 (0.2%)
- Nigerian: 20 (0.2%)
- Greek: 18 (0.2%)
- Scandinavian: 12 (0.1%)
- Afghan: 11 (0.1%)
- Finnish: 10 (0.1%)
- Belgian: 9 (0.09%)
- Slovak: 9 (0.09%)
- Basque: 8 (0.08%)
- Lithuanian: 7 (0.07%)
- Cypriot: 6 (0.06%)
- Portuguese: 4 (0.04%)
- Iraqi: 4 (0.04%)
- Bulgarian: 3 (0.03%)
- Arab: 3 (0.03%)
- Kenyan: 3 (0.03%)
- Croatian: 3 (0.03%)
- Swiss: 3 (0.03%)
Most common places of birth for foreign-born residents (%):
| Albany: | 23.4% (1,281) |
| California: | 6.6% (684,672) |
| Albany: | 9.4% (514) |
| California: | 1.0% (103,575) |
| Albany: | 8.5% (463) |
| California: | 3.0% (315,248) |
| Albany: | 7.4% (407) |
| California: | 5.2% (539,184) |
| Albany: | 4.4% (239) |
| California: | 1.7% (176,274) |
| Albany: | 4.1% (226) |
| California: | 2.0% (206,004) |
| Albany: | 3.6% (196) |
| California: | 37.2% (3,881,193) |
| Albany: | 3.0% (167) |
| California: | 0.2% (16,541) |
| Albany: | 2.7% (147) |
| California: | 0.1% (6,648) |
| Albany: | 2.5% (137) |
| California: | 1.0% (105,215) |
| Albany: | 2.2% (123) |
| California: | 7.8% (818,297) |
| Albany: | 2.0% (107) |
| California: | 0.0% (1,713) |
| Albany: | 1.8% (101) |
| California: | 0.0% (5,043) |
| Albany: | 1.7% (93) |
| California: | 0.4% (40,224) |
| Albany: | 1.5% (83) |
| California: | 1.2% (127,477) |
Place of birth for U.S.-born residents:
- This state: 8,788
- Other state: 4,933
- Northeast: 1,591
- Midwest: 1,418
- South: 999
- West: 941
83.3% of Albany residents lived in the same house 1 years ago.
Out of people who lived in different houses, 31.5% lived in this county.
Out of people who lived in different counties, 77.0% lived in California.
| Albany: | 83.3% |
| State average: | 88.9% |
Education attainment for males 25 years and older:
- No schooling: 87
- Nursery to 4th grade: 8
- 5th and 6th grade: 25
- 7th and 8th grade: 6
- 9th grade: 6
- 10th grade: 15
- 11th grade: 7
- 12th grade, no diploma: 60
- High school graduate (or equivalency): 759
- Less than 1 year of college: 74
- Some college more than 1 year, no degree: 409
- Associate degree: 186
- Bachelor's degree: 1,980
- Master's degree: 1,748
- Professional school degree: 285
- Doctorate degree: 980

Education attainment for females 25 years and older:
- No schooling: 103
- Nursery to 4th grade: 5
- 5th and 6th grade: 15
- 7th and 8th grade: 3
- 9th grade: 7
- 10th grade: 5
- 11th grade: 10
- 12th grade, no diploma: 32
- High school graduate (or equivalency): 420
- Less than 1 year of college: 160
- Some college more than 1 year, no degree: 449
- Associate degree: 321
- Bachelor's degree: 2,704
- Master's degree: 2,220
- Professional school degree: 418
- Doctorate degree: 585

Housing units in structures:
- One, detached: 3,926
- One, attached: 447
- Two: 300
- 3 or 4: 583
- 5 to 9: 635
- 10 to 19: 813
- 20 to 49: 654
- 50 or more: 935
- Mobile homes: 6
Housing units lacking complete kitchen facilities in 2022: 2.0%
House/condo owner moved in on average 18 years ago
Renter moved in on average 1 years ago

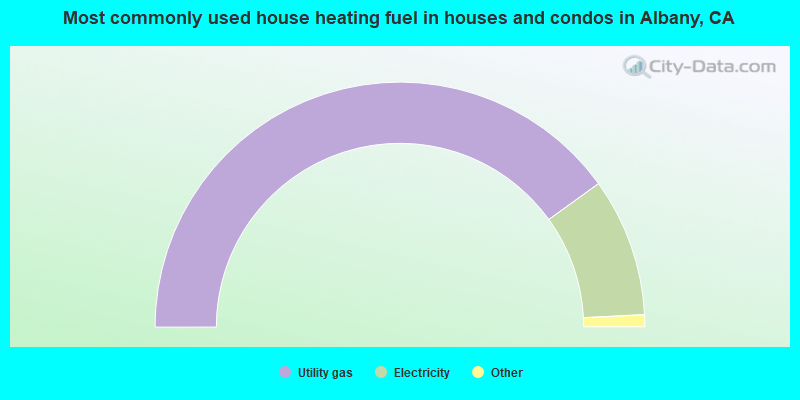
- 80.2%Utility gas
- 18.3%Electricity
- 0.9%Bottled, tank, or LP gas
- 0.6%Solar energy
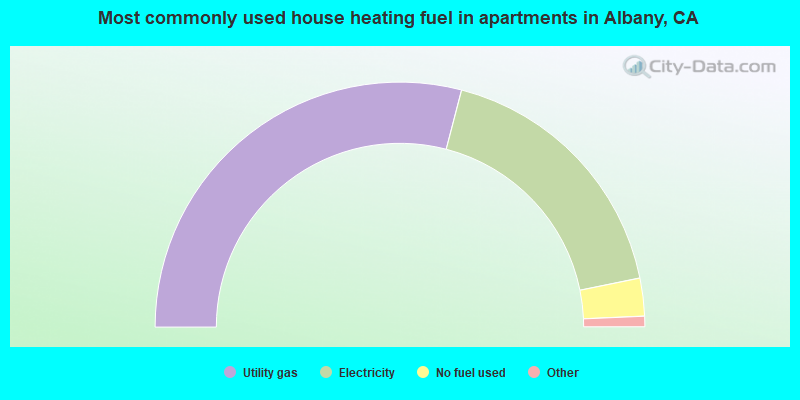
- 58.1%Utility gas
- 35.5%Electricity
- 5.0%No fuel used
- 1.2%Bottled, tank, or LP gas
- 0.1%Other fuel
Private vs. public school enrollment:
| Here: | 8.9% |
| California: | 10.5% |
| Here: | 4.8% |
| California: | 8.5% |
| Here: | 10.0% |
| California: | 15.9% |


