Housing density: 2,569 houses/condos per square mile
Median price asked for vacant for-sale houses and condos in 2022 in this county: $1,291,802.
Median contract rent in 2022: $1,549 (lower quartile is $1,254, upper quartile is $1,866)
Median rent asked for vacant for-rent units in 2022: $1,646
Median gross rent in Alondra Park, CA in 2022: $1,598
Housing units in Alondra Park with a mortgage: 1,071 (69 second mortgage, 0 home equity loan, 46 both second mortgage and home equity loan) Houses without a mortgage: 26
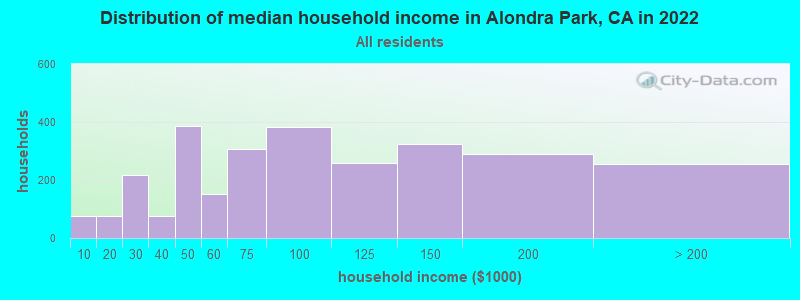
Median household income for houses/condos with a mortgage: $116,392
Median household income for apartments without a mortgage: $115,524
Median monthly housing costs: $1,612
Compare current foreclosures near Alondra Park, CA:
Size of family households: 742 2-persons, 449 3-persons, 335 4-persons, 287 5-persons, 121 6-persons, 76 7-or-more-persons.
Size of nonfamily households: 622 1-person, 165 2-persons.
1,033 married couples with children.
148 single-parent households (19 men, 129 women).
37.7% of residents of Alondra Park speak English at home.
45.6% of residents speak Spanish at home (51% speak English very well, 15% speak English well, 16% speak English not well, 19% don't speak English at all).
0.6% of residents speak other Indo-European language at home (82% speak English very well, 18% speak English well).
10.7% of residents speak Asian or Pacific Island language at home (59% speak English very well, 16% speak English well, 24% speak English not well, 1% don't speak English at all).
5.4% of residents speak other language at home (92% speak English very well, 5% speak English not well, 3% don't speak English at all).
Foreign born population: 3,220 (39.6%)
(51.8% of them are naturalized citizens)
Percentage of workers working in this county: 96.1% Number of people working at home: 260 (6.3% of all workers)
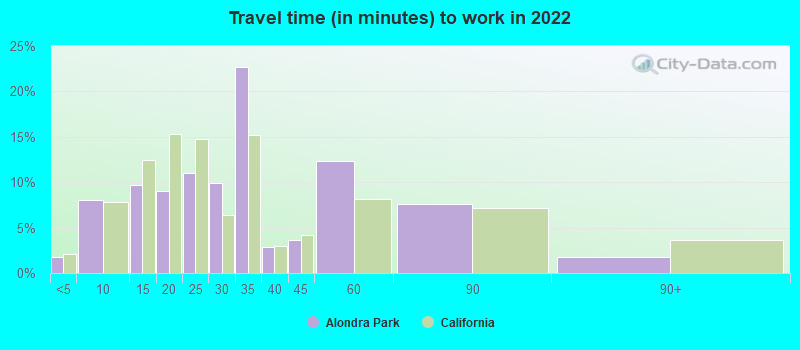
Travel time to work (commute)
Less than 5 minutes: 10
5 to 9 minutes: 268
10 to 14 minutes: 622
15 to 19 minutes: 854
20 to 24 minutes: 530
25 to 29 minutes: 192
30 to 34 minutes: 301
35 to 39 minutes: 104
40 to 44 minutes: 87
45 to 59 minutes: 380
60 to 89 minutes: 291
90 or more minutes: 97
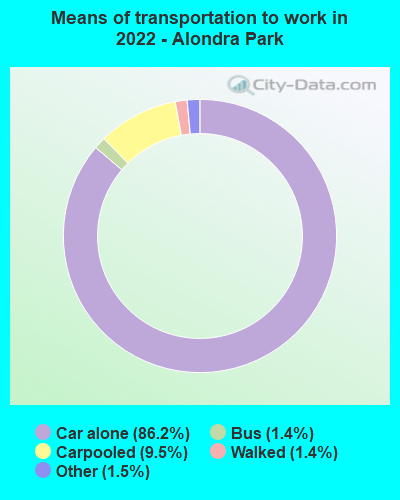
Means of transportation to work:
Drove a car alone: 1,449 (73.4%)
Carpooled: 176 (8.9%)
Bus: 21 (1.1%)
Taxi: 28 (1.4%)
Walked: 25 (1.3%)
Worked at home: 260 (13.2%)
Unemployment by race in 2022
Unemployment rate for White non-Hispanic residents
5.9%Males
Unemployment rate for Black residents
6.2%Females
Unemployment rate for Asian residents
4.7%Males
4.8%Females
Unemployment rate for other race residents
2.5%Males
11.3%Females
Unemployment rate for Hispanic or Latino residents
0.9%Males
6.3%Females
Year of entry for the foreign-born population in Alondra Park, California
9312010 or later
4902000 to 2009
8991990 to 1999
9731980 to 1989
6211970 to 1979
305Before 1970
First ancestries reported:
American: 635 (11.0%)
German: 168 (2.9%)
African: 59 (1.0%)
European: 53 (0.9%)
Norwegian: 46 (0.8%)
Irish: 43 (0.7%)
English: 34 (0.6%)
Nigerian: 32 (0.6%)
Arab: 29 (0.5%)
Italian: 29 (0.5%)
Portuguese: 24 (0.4%)
Scottish: 23 (0.4%)
Dutch: 20 (0.3%)
Eastern European: 20 (0.3%)
Egyptian: 17 (0.3%)
Ukrainian: 7 (0.1%)
Armenian: 5 (0.09%)
Polish: 5 (0.09%)
Yugoslavian: 5 (0.09%)
Most common places of birth for foreign-born residents (%):
Mexico
Alondra Park:
42.7% (1,373)
California:
37.2% (3,881,193)
Vietnam
Alondra Park:
12.3% (396)
California:
4.9% (512,335)
Guatemala
Alondra Park:
9.6% (308)
California:
2.8% (290,436)
Philippines
Alondra Park:
9.0% (289)
California:
7.8% (818,297)
El Salvador
Alondra Park:
5.0% (162)
California:
4.2% (440,287)
Jordan
Alondra Park:
4.3% (140)
California:
0.2% (16,384)
Sierra Leone
Alondra Park:
4.2% (134)
California:
0.0% (2,618)
Peru
Alondra Park:
3.0% (98)
California:
0.7% (74,025)
Egypt
Alondra Park:
2.1% (69)
California:
0.4% (42,718)
Nicaragua
Alondra Park:
1.9% (60)
California:
0.6% (58,161)
Europe, n.e.c.
Alondra Park:
1.7% (55)
California:
0.0% (1,713)
Place of birth for U.S.-born residents:
This state: 4,002
Other state: 844
Northeast: 208
Midwest: 344
South: 206
West: 82
92.3% of Alondra Park residents lived in the same house 1 years ago. Out of people who lived in different houses, 44.4% lived in this county. Out of people who lived in different counties, 100.0% lived in California.
Alondra Park:
92.3%
State average:
88.9%
Education attainment for males 25 years and older:
No schooling: 351
Nursery to 4th grade: 84
5th and 6th grade: 173
7th and 8th grade: 12
9th grade: 155
10th grade: 0
11th grade: 61
12th grade, no diploma: 106
High school graduate (or equivalency): 474
Less than 1 year of college: 178
Some college more than 1 year, no degree: 451
Associate degree: 202
Bachelor's degree: 505
Master's degree: 106
Professional school degree: 17
Doctorate degree: 0
Education attainment for females 25 years and older:
No schooling: 165
Nursery to 4th grade: 50
5th and 6th grade: 118
7th and 8th grade: 54
9th grade: 55
10th grade: 8
11th grade: 97
12th grade, no diploma: 97
High school graduate (or equivalency): 504
Less than 1 year of college: 238
Some college more than 1 year, no degree: 390
Associate degree: 161
Bachelor's degree: 646
Master's degree: 214
Professional school degree: 89
Doctorate degree: 13
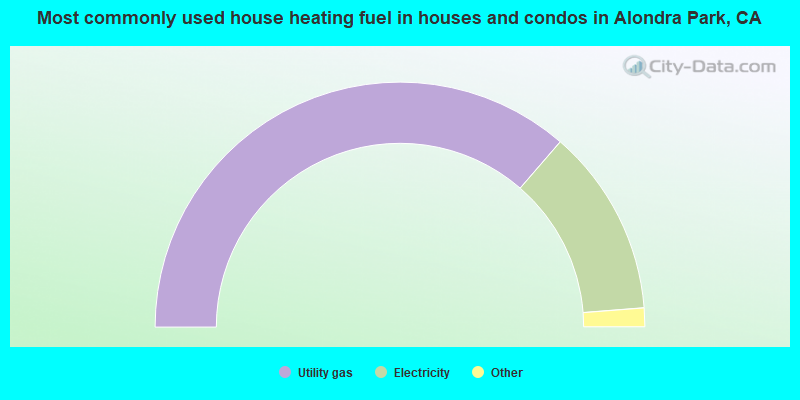
Housing units in structures:
One, detached: 1,813
One, attached: 48
Two: 20
3 or 4: 107
5 to 9: 152
10 to 19: 211
20 to 49: 274
50 or more: 255
Mobile homes: 45
Housing units lacking complete plumbing facilities in 2022: 2.2%
Housing units lacking complete kitchen facilities in 2022: 3.2%
House/condo owner moved in on average 21 years ago