Ambridge, PA (Pennsylvania) Houses and Residents
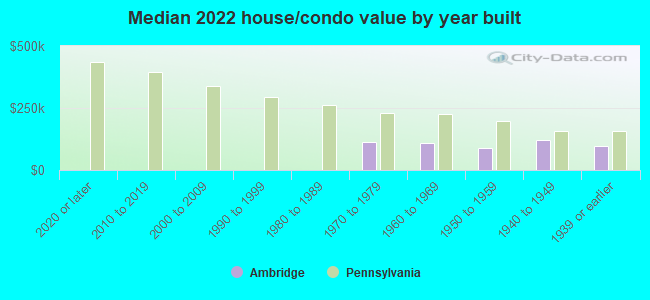
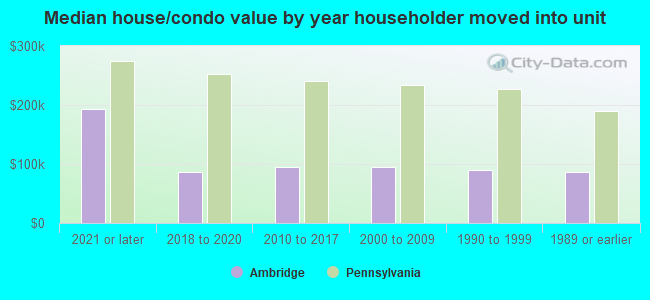
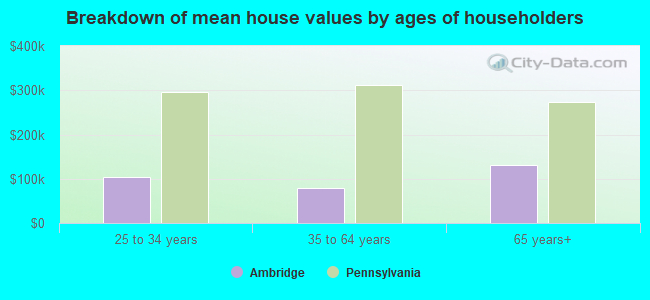
| Ambridge: | $92,696 |
| Pennsylvania: | $245,500 |
Total population: 6,895 (All urban)
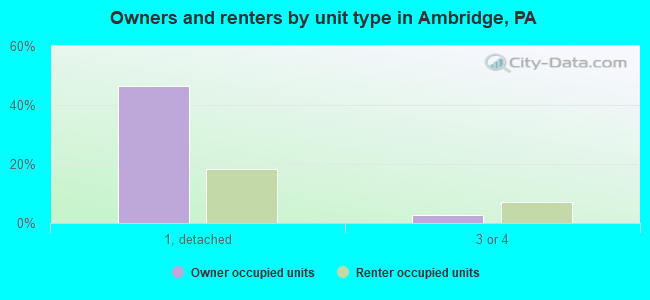
Houses: 3,868 (3,135 occupied: 1,527 owner occupied, 1,607 renter occupied)
| % of renters here: | 51% |
| State: | 31% |
Housing density: 2,605 houses/condos per square mile
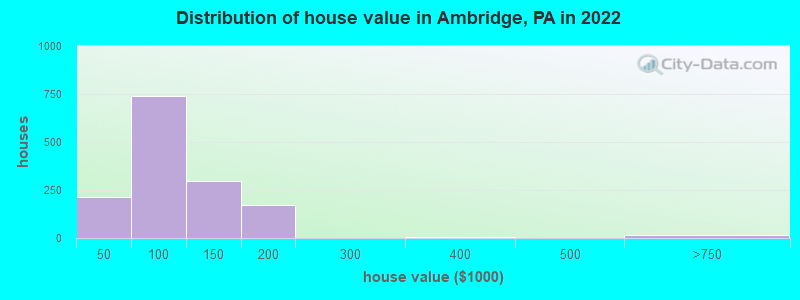
Median price asked for vacant for-sale houses and condos in 2022: $82,579.
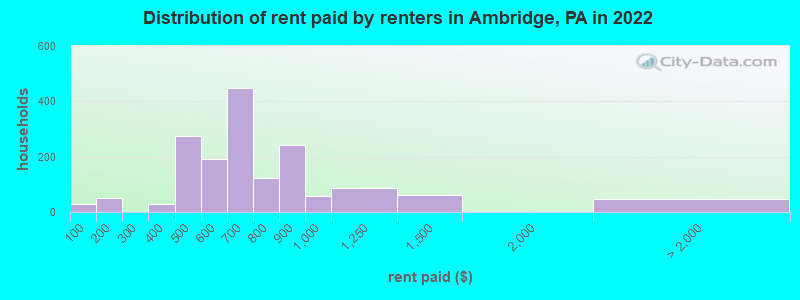
Median contract rent in 2022: $671 (lower quartile is $529, upper quartile is $870)
Median rent asked for vacant for-rent units in 2022: $713
Median gross rent in Ambridge, PA in 2022: $932
Housing units in Ambridge with a mortgage: 678 (98 second mortgage, 0 home equity loan, 99 both second mortgage and home equity loan)
Houses without a mortgage: 45
Median household income for houses/condos with a mortgage: $72,306
Median household income for apartments without a mortgage: $61,392
Median monthly housing costs: $818
Compare current foreclosures near Ambridge, PA:
| Photo | Address | Area | Beds / Baths | Price | Details |
|---|---|---|---|---|---|

|
#1
Locust St
Ambridge, PA 15003
|
1,738 sq. feet
|
1 baths 5 beds |
show details | |

|
#2
Locust St
Ambridge, PA 15003
|
- sq. feet
|
1 baths 2 beds |
show details | |

|
#3
Melrose Ave
Ambridge, PA 15003
|
1,408 sq. feet
|
1 baths 3 beds |
show details | |

|
#4
18th St
Ambridge, PA 15003
|
1,356 sq. feet
|
1 baths 3 beds |
show details | |

|
#5
Beaver Rd
Ambridge, PA 15003
|
1,394 sq. feet
|
1 baths 3 beds |
show details | |

|
#6
Wilson Ave
Ambridge, PA 15003
|
1,836 sq. feet
|
1 baths 3 beds |
show details | |

|
#7
Maplewood Ave
Ambridge, PA 15003
|
2,236 sq. feet
|
2 baths 4 beds |
show details | |

|
#8
Ambridge Ave
Ambridge, PA 15003
|
1,278 sq. feet
|
1 baths 2 beds |
show details | |

|
#9
Willow St
Ambridge, PA 15003
|
1,548 sq. feet
|
1 baths 3 beds |
show details | |

|
#10
3rd St
Ambridge, PA 15003
|
1,440 sq. feet
|
1 baths 3 beds |
show details |
| Photo | Address | Area | Beds / Baths | Price | Details |
|---|---|---|---|---|---|

|
#11
Lenz Ave
Ambridge, PA 15003
|
936 sq. feet
|
1 baths 2 beds |
show details | |

|
#12
Ambridge Ave
Ambridge, PA 15003
|
1,291 sq. feet
|
1 baths 3 beds |
show details | |

|
#13
Main St
Ambridge, PA 15003
|
1,404 sq. feet
|
1 baths 3 beds |
show details | |

|
#14
Spruce St
Ambridge, PA 15003
|
873 sq. feet
|
1 baths 3 beds |
show details | |

|
#15
1/2 8th St
Ambridge, PA 15003
|
1,267 sq. feet
|
1 baths 2 beds |
show details | |

|
#16
Ridge Road Ext
Ambridge, PA 15003
|
1,326 sq. feet
|
1 baths 3 beds |
show details | |

|
#17
Park Rd
Ambridge, PA 15003
|
1,196 sq. feet
|
2 baths 4 beds |
show details | |

|
#18
Wagner Ave
Ambridge, PA 15003
|
1,424 sq. feet
|
1 baths 3 beds |
show details | |

|
#19
14th St # 1
Ambridge, PA 15003
|
3,328 sq. feet
|
4 baths - beds |
show details | |

|
#20
Beaver Rd
Ambridge, PA 15003
|
1,060 sq. feet
|
- baths 2 beds |
show details |
| Photo | Address | Area | Beds / Baths | Price | Details |
|---|---|---|---|---|---|

|
#21
Merchant St
Ambridge, PA 15003
|
2,150 sq. feet
|
1 baths - beds |
show details | |

|
#22
Eidge Road Ext
Ambridge, PA 15003
|
- sq. feet
|
- baths - beds |
show details | |

|
#23
Duss Ave
Ambridge, PA 15003
|
- sq. feet
|
- baths - beds |
show details | |

|
#24
Beaver Rd Apt 811
Ambridge, PA 15003
|
- sq. feet
|
- baths - beds |
show details | |

|
#25
Shady Ln
Aliquippa, PA 15001
|
1,440 sq. feet
|
2 baths 3 beds |
$169,900
|
show details |

|
#26
Wedgewood Dr
Pittsburgh, PA 15229
|
835 sq. feet
|
1 baths 2 beds |
$138,500
|
show details |

|
#27
Muirfield Dr
Presto, PA 15142
|
4,801 sq. feet
|
4 baths 5 beds |
$749,500
|
show details |

|
#28
Semicir St
Pittsburgh, PA 15214
|
537 sq. feet
|
1 baths 1 beds |
$21,000
|
show details |

|
#29
Cedar Ave
Ambridge, PA 15003
|
- sq. feet
|
- baths - beds |
show details | |

|
#30
Fairmont Drive
Wexford, PA 15090
|
3,076 sq. feet
|
4 baths 3 beds |
show details |
| Photo | Address | Area | Beds / Baths | Price | Details |
|---|---|---|---|---|---|

|
#31
Crucible St
Pittsburgh, PA 15220
|
1,980 sq. feet
|
2 baths 4 beds |
show details | |

|
#32
Colony Ct
Gibsonia, PA 15044
|
2,574 sq. feet
|
2 baths 4 beds |
show details | |

|
#33
Marion St
Mc Kees Rocks, PA 15136
|
1,544 sq. feet
|
1 baths 4 beds |
show details | |

|
#34
Wayne Ave
Mc Kees Rocks, PA 15136
|
1,440 sq. feet
|
1 baths 3 beds |
show details | |

|
#35
Lucerne Ave
Pittsburgh, PA 15214
|
1,937 sq. feet
|
1 baths 3 beds |
show details | |

|
#36
Woodward Ave
Mc Kees Rocks, PA 15136
|
1,266 sq. feet
|
1 baths 2 beds |
show details | |

|
#37
Mccoy Rd
Mc Kees Rocks, PA 15136
|
1,040 sq. feet
|
1 baths 3 beds |
show details | |

|
#38
Woodward Ave
Mc Kees Rocks, PA 15136
|
1,958 sq. feet
|
2 baths 6 beds |
show details | |

|
#39
Wimer Dr
Pittsburgh, PA 15237
|
1,200 sq. feet
|
1 baths 3 beds |
show details | |

|
#40
13th St
Mc Kees Rocks, PA 15136
|
1,404 sq. feet
|
1 baths 3 beds |
show details |
| Photo | Address | Area | Beds / Baths | Price | Details |
|---|---|---|---|---|---|

|
#41
Woodward Ave
Mc Kees Rocks, PA 15136
|
1,958 sq. feet
|
2 baths 4 beds |
show details | |

|
#42
Orchard Ave
Pittsburgh, PA 15202
|
1,180 sq. feet
|
1 baths 3 beds |
show details | |

|
#43
Dawson Ave
Pittsburgh, PA 15202
|
2,186 sq. feet
|
1 baths 4 beds |
show details | |

|
#44
32nd Ave
New Brighton, PA 15066
|
1,608 sq. feet
|
1 baths 3 beds |
show details | |

|
#45
Good Ln
Pittsburgh, PA 15237
|
988 sq. feet
|
1 baths 3 beds |
show details | |

|
#46
Union Ave
Pittsburgh, PA 15202
|
1,948 sq. feet
|
2 baths 5 beds |
show details | |

|
#47
Midland Beaver Rd
Industry, PA 15052
|
- sq. feet
|
1 baths 2 beds |
show details | |

|
#48
Kenwood Dr
Coraopolis, PA 15108
|
900 sq. feet
|
1 baths 2 beds |
show details | |

|
#49
Williams Ave
Rochester, PA 15074
|
- sq. feet
|
2 baths 3 beds |
show details | |

|
Check over 1 million property listings on Foreclosure.com!
|
browse all offers | |||

Latest news about housing in Ambridge, PA collected exclusively by city-data.com from local newspapers, TV, and radio stations

 | hard to find apartments/houses for rent around Sewickley area (6 replies) |
| A rental house in Mars (73 replies) |
| Is Sewickley the most walkable small town near Pittsburgh? (68 replies) |
| Exurb of the Week: Ambridge (6 replies) |
| Prediction: City of Pittsburgh to lose much more population in the next 5 years. (363 replies) |
| LESS than anemic job growth for region, #84/90 (290 replies) |

Median year apartment built: 1940
Household type by relationship:
Households: 6,856- Male householders: 1,385 (645 living alone), Female householders: 1,707 (658 living alone)
962 spouses (962 opposite-sex spouses), 433 unmarried partners, (382 opposite-sex unmarried partners), 1,938 children (1,741 natural, 0 adopted, 196 stepchildren), 60 grandchildren, 55 brothers or sisters, 48 parents, 6 foster children, 85 other relatives, 148 non-relatives
- In group quarters: 22
Size of family households: 550 2-persons, 444 3-persons, 255 4-persons, 99 5-persons, 19 6-persons, 50 7-or-more-persons.
Size of nonfamily households: 1,291 1-person, 342 2-persons, 63 3-persons.
588 married couples with children.
762 single-parent households (116 men, 646 women).
94.3% of residents of Ambridge speak English at home.
1.7% of residents speak Spanish at home (52% speak English very well, 21% speak English well, 27% speak English not well).
2.3% of residents speak other Indo-European language at home (79% speak English very well, 21% speak English well).
0.2% of residents speak Asian or Pacific Island language at home (43% speak English very well, 57% speak English not well).
0.8% of residents speak other language at home (4% speak English very well, 96% speak English well).
Foreign born population: 126 (1.8%)
(32.5% of them are naturalized citizens)
| Here: | 6.1 |
| State: | 6.8 |
| Here: | 4.6 |
| State: | 4.3 |
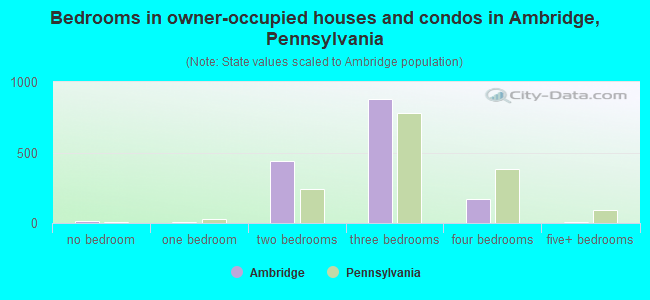
- Bedrooms in owner-occupied houses and condos in Ambridge, Pennsylvania
- 13no bedroom
- 101 bedroom
- 4412 bedrooms
- 8813 bedrooms
- 1734 bedrooms
- 105+ bedrooms
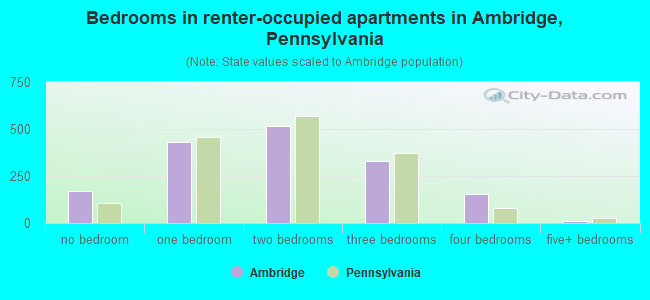
- Bedrooms in renter-occupied apartments in Ambridge, Pennsylvania
- 168no bedroom
- 4291 bedroom
- 5172 bedrooms
- 3313 bedrooms
- 1534 bedrooms
- 105+ bedrooms
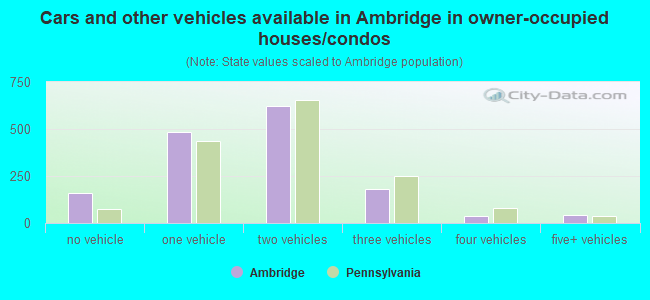
- Cars and other vehicles available in Ambridge in owner-occupied houses/condos
- 158no vehicle
- 4861 vehicle
- 6242 vehicles
- 1803 vehicles
- 354 vehicles
- 445+ vehicles
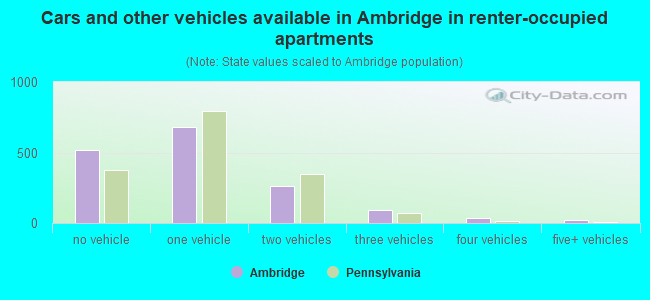
- Cars and other vehicles available in Ambridge in renter-occupied apartments
- 515no vehicle
- 6791 vehicle
- 2592 vehicles
- 953 vehicles
- 394 vehicles
- 205+ vehicles
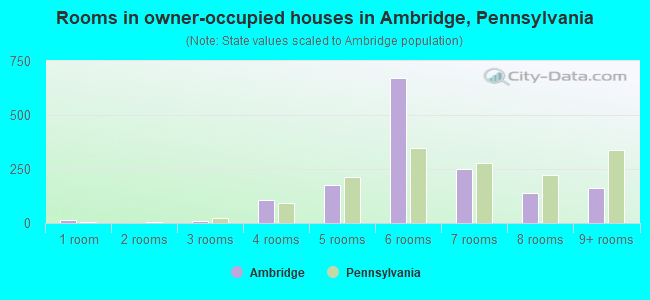
- Rooms in owner-occupied houses in Ambridge, Pennsylvania
- 131 room
- 02 rooms
- 113 rooms
- 1074 rooms
- 1755 rooms
- 6726 rooms
- 2517 rooms
- 1378 rooms
- 1609+ rooms
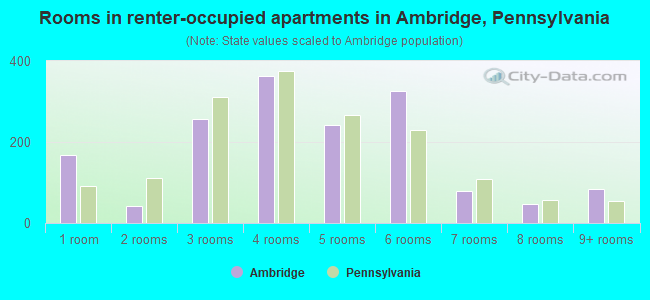
- Rooms in renter-occupied apartments in Ambridge, Pennsylvania
- 1681 room
- 422 rooms
- 2563 rooms
- 3624 rooms
- 2435 rooms
- 3256 rooms
- 797 rooms
- 478 rooms
- 859+ rooms
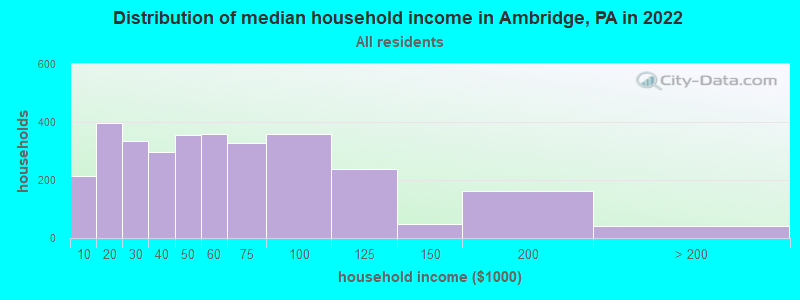
Ambridge, PA household income distribution

- 214Less than $10,000
- 397$10,000 to $19,999
- 334$20,000 to $29,999
- 297$30,000 to $39,999
- 356$40,000 to $49,999
- 358$50,000 to $59,999
- 328$60,000 to $74,999
- 360$75,000 to $99,999
- 239$100,000 to $124,999
- 49$125,000 to $149,999
- 163$150,000 to $199,999
- 40$200,000 or more
Home value of owner - occupied houses in 2022 in Ambridge, PA
-
- 15Less than $10,000
- 17$15,000 to $19,999
- 36$20,000 to $24,999
- 30$25,000 to $29,999
- 12$35,000 to $39,999
- 101$40,000 to $49,999
- 97$50,000 to $59,999
- 56$60,000 to $69,999
- 129$70,000 to $79,999
- 206$80,000 to $89,999
- 151$90,000 to $99,999
- 204$100,000 to $124,999
- 90$125,000 to $149,999
- 114$150,000 to $174,999
- 55$175,000 to $199,999
- 5$300,000 to $399,999
- 13$500,000 to $749,999
Rent paid by renters in 2022 in Ambridge, PA
-
- 28Less than $100
- 16$100 to $149
- 34$150 to $199
- 9$300 to $349
- 21$350 to $399
- 164$400 to $449
- 108$450 to $499
- 119$500 to $549
- 70$550 to $599
- 267$600 to $649
- 178$650 to $699
- 61$700 to $749
- 61$750 to $799
- 243$800 to $899
- 58$900 to $999
- 86$1,000 to $1,249
- 60$1,250 to $1,499
- 16$2,000 to $2,499
- 12$2,500 to $2,999
- 19No cash rent
Percentage of workers working in this county: 54.8%
Number of people working at home: 272 (8.0% of all workers)
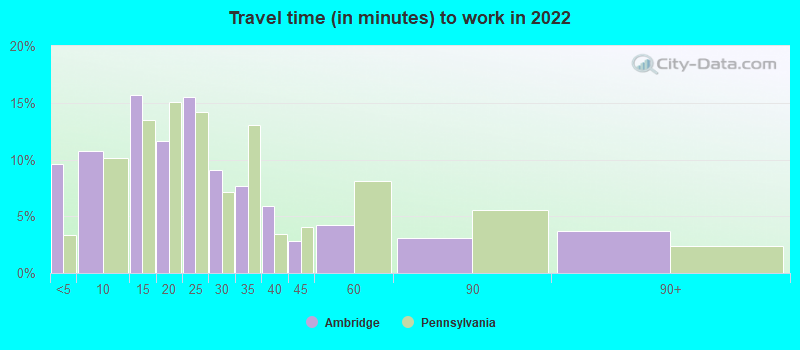
Travel time to work (commute)
- Less than 5 minutes: 287
- 5 to 9 minutes: 339
- 10 to 14 minutes: 343
- 15 to 19 minutes: 335
- 20 to 24 minutes: 462
- 25 to 29 minutes: 254
- 30 to 34 minutes: 402
- 35 to 39 minutes: 27
- 40 to 44 minutes: 94
- 45 to 59 minutes: 122
- 60 to 89 minutes: 316
- 90 or more minutes: 14
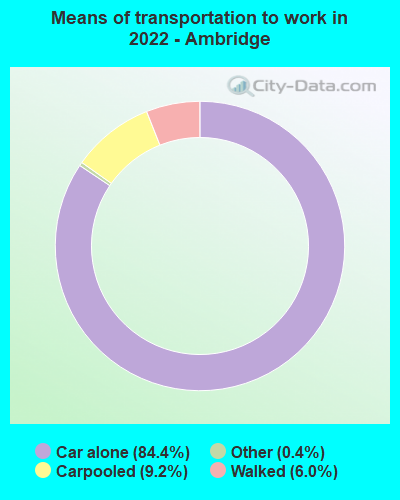
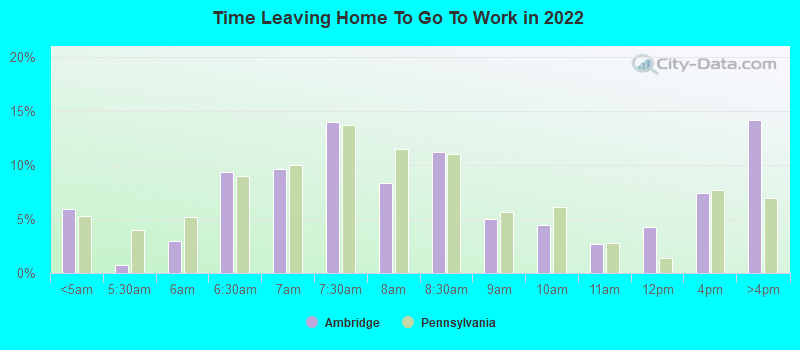
Means of transportation to work:
- Drove a car alone: 1,882 (74.9%)
- Carpooled: 204 (8.1%)
- Taxi: 11 (0.4%)
- Walked: 134 (5.3%)
- Worked at home: 264 (10.5%)
- Unemployment by race in 2022
- Unemployment rate for White non-Hispanic residents
- 9.1%Males
- 2.2%Females
- Unemployment rate for Black residents
- 20.3%Males
- 54.6%Females
- Unemployment rate for two or more race residents
- 29.1%Females
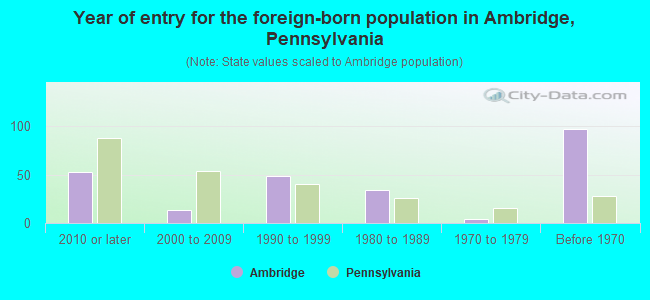
- Year of entry for the foreign-born population in Ambridge, Pennsylvania
- 532010 or later
- 142000 to 2009
- 491990 to 1999
- 341980 to 1989
- 41970 to 1979
- 97Before 1970
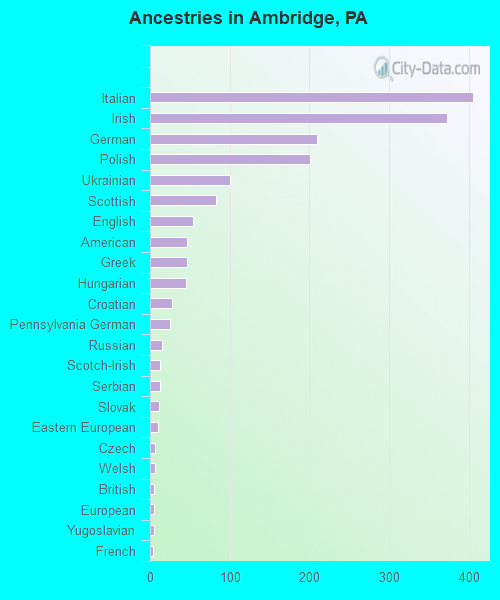
First ancestries reported:
- Italian: 405 (15.2%)
- Irish: 372 (14.0%)
- German: 210 (7.9%)
- Polish: 201 (7.6%)
- Ukrainian: 100 (3.8%)
- Scottish: 83 (3.1%)
- English: 54 (2.0%)
- American: 47 (1.8%)
- Greek: 47 (1.8%)
- Hungarian: 45 (1.7%)
- Croatian: 27 (1.0%)
- Pennsylvania German: 25 (0.9%)
- Russian: 15 (0.6%)
- Scotch-Irish: 13 (0.5%)
- Serbian: 12 (0.5%)
- Slovak: 11 (0.4%)
- Eastern European: 10 (0.4%)
- Czech: 6 (0.2%)
- Welsh: 6 (0.2%)
- British: 5 (0.2%)
- European: 5 (0.2%)
- Yugoslavian: 5 (0.2%)
- French: 4 (0.2%)
- Austrian: 2 (0.08%)
- Kenyan: 2 (0.08%)
Most common places of birth for foreign-born residents (%):
| Ambridge: | 29.7% (44) |
| Pennsylvania: | 0.8% (7,272) |
| Ambridge: | 23.6% (35) |
| Pennsylvania: | 9.2% (86,544) |
| Ambridge: | 8.8% (13) |
| Pennsylvania: | 1.3% (12,172) |
| Ambridge: | 8.1% (12) |
| Pennsylvania: | 1.9% (18,065) |
| Ambridge: | 6.8% (10) |
| Pennsylvania: | 0.1% (750) |
| Ambridge: | 4.1% (6) |
| Pennsylvania: | 0.6% (5,438) |
| Ambridge: | 4.1% (6) |
| Pennsylvania: | 2.2% (21,039) |
| Ambridge: | 4.1% (6) |
| Pennsylvania: | 0.3% (3,273) |
| Ambridge: | 3.4% (5) |
| Pennsylvania: | 1.6% (15,272) |
| Ambridge: | 3.4% (5) |
| Pennsylvania: | 1.8% (17,032) |
Place of birth for U.S.-born residents:
- This state: 5,551
- Other state: 1,137
- Northeast: 221
- Midwest: 207
- South: 498
- West: 239
87.3% of Ambridge residents lived in the same house 1 years ago.
Out of people who lived in different houses, 39.4% lived in this county.
Out of people who lived in different counties, 89.9% lived in Pennsylvania.
| Ambridge: | 87.3% |
| State average: | 89.3% |
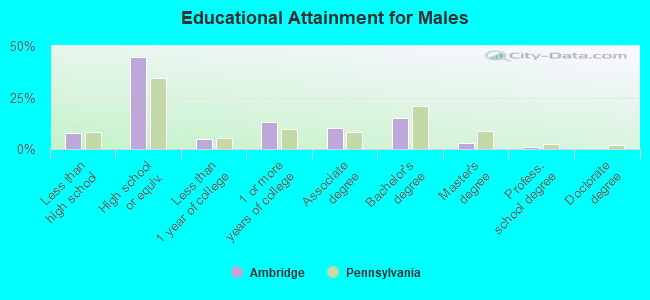
Education attainment for males 25 years and older:
- No schooling: 60
- Nursery to 4th grade: 0
- 5th and 6th grade: 14
- 7th and 8th grade: 6
- 9th grade: 0
- 10th grade: 0
- 11th grade: 35
- 12th grade, no diploma: 66
- High school graduate (or equivalency): 1,053
- Less than 1 year of college: 114
- Some college more than 1 year, no degree: 305
- Associate degree: 239
- Bachelor's degree: 352
- Master's degree: 74
- Professional school degree: 26
- Doctorate degree: 4
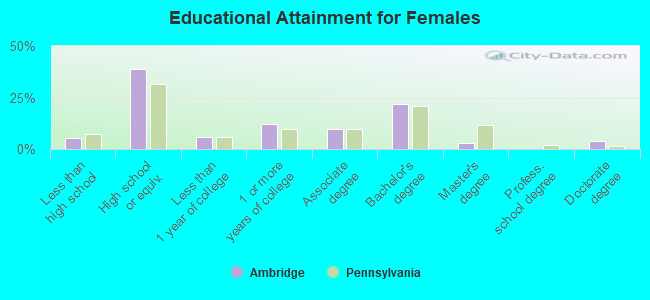
Education attainment for females 25 years and older:
- No schooling: 20
- Nursery to 4th grade: 0
- 5th and 6th grade: 0
- 7th and 8th grade: 12
- 9th grade: 0
- 10th grade: 29
- 11th grade: 64
- 12th grade, no diploma: 0
- High school graduate (or equivalency): 944
- Less than 1 year of college: 144
- Some college more than 1 year, no degree: 295
- Associate degree: 232
- Bachelor's degree: 533
- Master's degree: 77
- Professional school degree: 0
- Doctorate degree: 91


Housing units in structures:
- One, detached: 2,232
- One, attached: 229
- Two: 393
- 3 or 4: 398
- 5 to 9: 329
- 10 to 19: 30
- 20 to 49: 172
- 50 or more: 36
- Mobile homes: 46
Housing units lacking complete kitchen facilities in 2022: 8.7%
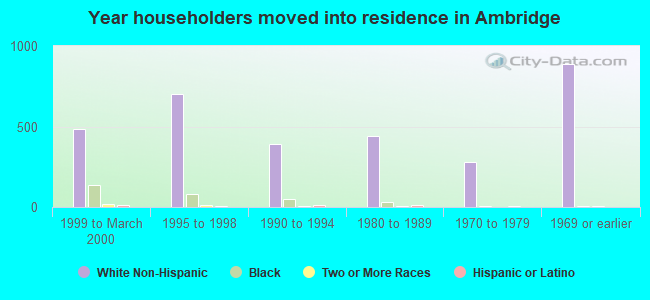
House/condo owner moved in on average 20 years ago
Renter moved in on average 4 years ago
- 92.7%Utility gas
- 5.6%Electricity
- 0.9%Bottled, tank, or LP gas
- 0.9%Fuel oil, kerosene, etc.
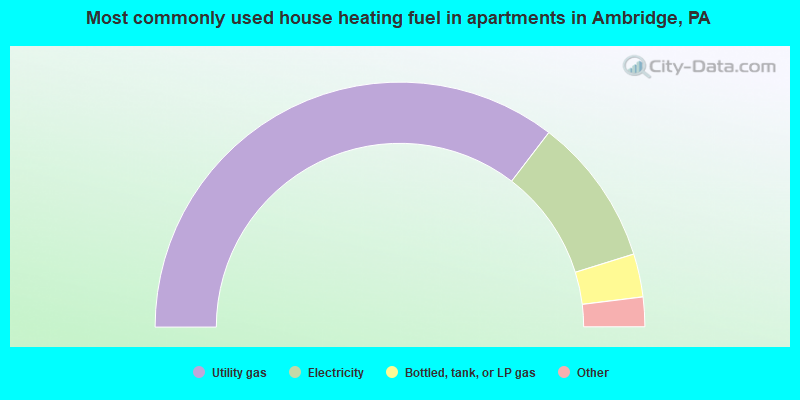
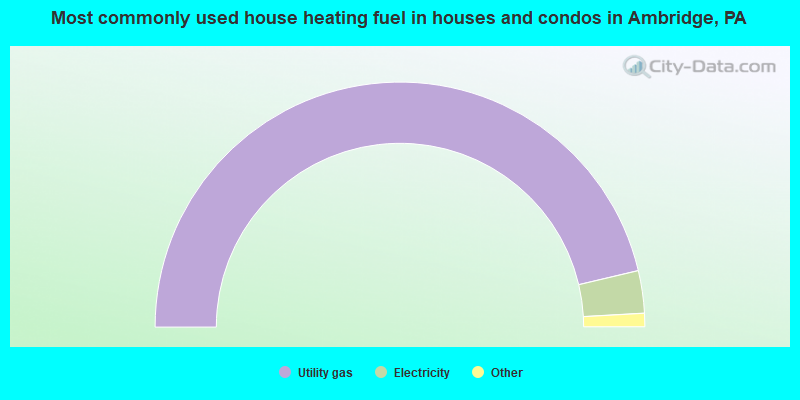
- 70.8%Utility gas
- 19.6%Electricity
- 5.7%Bottled, tank, or LP gas
- 2.7%Fuel oil, kerosene, etc.
- 0.6%Other fuel
- 0.5%No fuel used
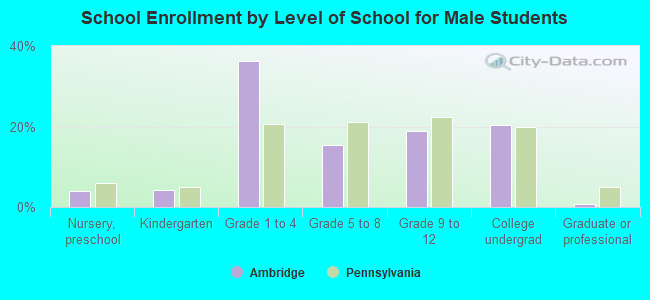
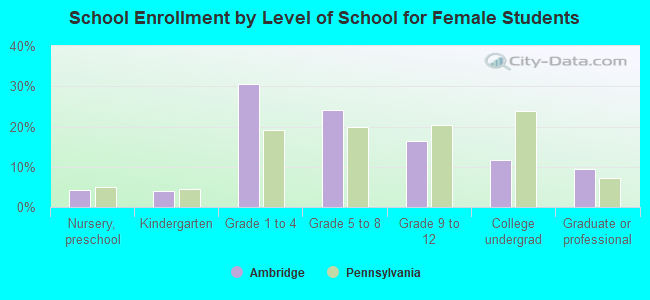
Private vs. public school enrollment:
| Here: | 18.1% |
| Pennsylvania: | 15.7% |
| Here: | 17.1% |
| Pennsylvania: | 13.4% |
| Here: | 3.6% |
| Pennsylvania: | 39.8% |