Andover, CT (Connecticut) Houses and Residents
| Andover: | $338,336 |
| Connecticut: | $347,200 |
Total population: 3,303 (Urban population: 34, Rural population: 3,002 (24 farm, 2,978 nonfarm))
Houses: 1,198 (1,150 occupied: 1,001 owner occupied, 149 renter occupied)
| % of renters here: | 13% |
| State: | 34% |
Housing density: 78 houses/condos per square mile
Median price asked for vacant for-sale houses and condos in 2022 in this county: $251,692.
Median contract rent in 2022: $876 (lower quartile is $707, upper quartile is $1,512)
Median rent asked for vacant for-rent units in 2022: $1,427
Median gross rent in Andover, CT in 2022: $1,086
Housing units in Andover with a mortgage: 740 (93 second mortgage, 101 home equity loan, 4 both second mortgage and home equity loan)
Houses without a mortgage: 174
Compare current foreclosures near Andover, CT:
| Photo | Address | Area | Beds / Baths | Price | Details |
|---|---|---|---|---|---|

|
#1
Lakeview Dr
Andover, CT 06232
|
996 sq. feet
|
1 baths 2 beds |
show details | |

|
#2
Irving St
Manchester, CT 06042
|
1,335 sq. feet
|
2 baths 3 beds |
$265,000
|
show details |

|
#3
Mountain Rd
Stafford Springs, CT 06076
|
1,235 sq. feet
|
2 baths 3 beds |
$299,900
|
show details |

|
#4
Spring St
Glastonbury, CT 06033
|
1,284 sq. feet
|
1 baths 3 beds |
$296,400
|
show details |

|
#5
Talcott Ave
Vernon Rockville, CT 06066
|
1,832 sq. feet
|
2 baths 4 beds |
$148,000
|
show details |

|
#6
Westchester Rd
Colchester, CT 06415
|
900 sq. feet
|
1 baths 2 beds |
$309,900
|
show details |

|
#7
Shares Ln
South Windsor, CT 06074
|
1,850 sq. feet
|
2 baths 4 beds |
$385,000
|
show details |

|
#8
Newberry Rd
South Windsor, CT 06074
|
3,386 sq. feet
|
2 baths 4 beds |
$669,900
|
show details |

|
#9
Tolland Ave
Stafford Springs, CT 06076
|
896 sq. feet
|
1 baths 3 beds |
$100,000
|
show details |

|
#10
Long Hill Rd
Andover, CT 06232
|
- sq. feet
|
- baths - beds |
show details |
| Photo | Address | Area | Beds / Baths | Price | Details |
|---|---|---|---|---|---|

|
#11
Circle Dr
Mansfield Center, CT 06250
|
1,152 sq. feet
|
1 baths 3 beds |
show details | |

|
#12
Anthony Rd
Tolland, CT 06084
|
1,584 sq. feet
|
3 baths 4 beds |
show details | |

|
#13
Northbrook Ct # 9
East Hartford, CT 06108
|
1,130 sq. feet
|
2 baths 2 beds |
show details | |

|
#14
Hollister Dr
East Hartford, CT 06118
|
1,300 sq. feet
|
1 baths 3 beds |
show details | |

|
#15
Butternut Ln
Rocky Hill, CT 06067
|
1,176 sq. feet
|
1 baths 2 beds |
show details | |

|
#16
Llynwood Dr
Bolton, CT 06043
|
1,335 sq. feet
|
1 baths 4 beds |
show details | |

|
#17
Broadview Ter
Hartford, CT 06106
|
1,821 sq. feet
|
2 baths 7 beds |
show details | |

|
#18
Oakland Rd
South Windsor, CT 06074
|
1,040 sq. feet
|
1 baths 2 beds |
show details | |

|
#19
Cheshire St
Hartford, CT 06114
|
3,279 sq. feet
|
2 baths 4 beds |
show details | |

|
#20
Mansfield Ave
Willimantic, CT 06226
|
920 sq. feet
|
1 baths 3 beds |
show details |
| Photo | Address | Area | Beds / Baths | Price | Details |
|---|---|---|---|---|---|

|
#21
Ferncrest Dr
East Hartford, CT 06118
|
1,890 sq. feet
|
3 baths 4 beds |
show details | |

|
#22
Park Rd
Marlborough, CT 06447
|
1,134 sq. feet
|
1 baths 3 beds |
show details | |

|
#23
Connecticut Route 87
Columbia, CT 06237
|
1,796 sq. feet
|
1 baths 3 beds |
show details | |

|
#24
Hope Valley Rd
Amston, CT 06231
|
2,128 sq. feet
|
2 baths 3 beds |
show details | |

|
#25
Deepwood Dr
Manchester, CT 06040
|
734 sq. feet
|
1 baths 2 beds |
show details | |

|
#26
Bell Ct Apt C1
East Hartford, CT 06108
|
890 sq. feet
|
1 baths 2 beds |
show details | |

|
#27
Robinson Hill Rd
North Franklin, CT 06254
|
739 sq. feet
|
1 baths 2 beds |
show details | |

|
#28
Northbrook C 9
East Hartford, CT 06108
|
1,130 sq. feet
|
1 baths 2 beds |
show details | |

|
#29
Webster Rd
Ellington, CT 06029
|
2,744 sq. feet
|
2 baths 3 beds |
show details | |

|
#30
Ferry Ln
South Glastonbury, CT 06073
|
1,385 sq. feet
|
2 baths 3 beds |
show details |
| Photo | Address | Area | Beds / Baths | Price | Details |
|---|---|---|---|---|---|

|
#31
Calvin Burnham Rd
Hampton, CT 06247
|
1,156 sq. feet
|
2 baths 2 beds |
show details | |

|
#32
Burnham St
East Hartford, CT 06108
|
1,278 sq. feet
|
2 baths 3 beds |
show details | |

|
#33
Old Main St
Rocky Hill, CT 06067
|
1,168 sq. feet
|
2 baths 2 beds |
show details | |

|
#34
Dover Ct
Windsor, CT 06095
|
1,231 sq. feet
|
1 baths 2 beds |
show details | |

|
#35
Abbey Rd
East Hampton, CT 06424
|
2,541 sq. feet
|
2 baths 3 beds |
show details | |

|
#36
Pleasant Valley Rd
South Windsor, CT 06074
|
2,133 sq. feet
|
2 baths 4 beds |
show details | |

|
#37
Bonner St
Hartford, CT 06106
|
1,274 sq. feet
|
1 baths 3 beds |
show details | |

|
#38
Mckee St
East Hartford, CT 06108
|
1,480 sq. feet
|
1 baths 3 beds |
show details | |

|
#39
Whiting Rd
East Hartford, CT 06118
|
1,500 sq. feet
|
1 baths 3 beds |
show details | |

|
#40
Saunders St
East Hartford, CT 06108
|
1,870 sq. feet
|
3 baths 4 beds |
show details |
| Photo | Address | Area | Beds / Baths | Price | Details |
|---|---|---|---|---|---|

|
#41
Glastonbury Ave
Rocky Hill, CT 06067
|
3,556 sq. feet
|
3 baths 6 beds |
show details | |

|
#42
Stanley St
East Hartford, CT 06108
|
1,262 sq. feet
|
1 baths 3 beds |
show details | |

|
#43
Mansfield Rd
Ashford, CT 06278
|
1,134 sq. feet
|
2 baths 3 beds |
show details | |

|
#44
Ident Rd
South Windsor, CT 06074
|
1,040 sq. feet
|
1 baths 3 beds |
show details | |

|
#45
Kenyon Pl
East Hartford, CT 06108
|
1,265 sq. feet
|
2 baths 3 beds |
show details | |

|
#46
Broadview Ter
Hartford, CT 06106
|
1,539 sq. feet
|
1 baths 3 beds |
show details | |

|
#47
Haddam St
Hartford, CT 06106
|
900 sq. feet
|
1 baths 2 beds |
show details | |

|
#48
Howard Ct
East Hartford, CT 06108
|
748 sq. feet
|
1 baths 2 beds |
show details | |

|
#49
Taylor St
East Hartford, CT 06118
|
1,510 sq. feet
|
2 baths 3 beds |
show details | |

|
Check over 1 million property listings on Foreclosure.com!
|
browse all offers | |||
Latest news about housing in Andover, CT collected exclusively by city-data.com from local newspapers, TV, and radio stations


Household type by relationship:
Households: 136,574- In family households: 112,649 (26,574 male householders, 10,133 female householders)
29,922 spouses, 38,844 children (36,460 natural, 1,015 adopted, 1,369 stepchildren), 1,606 grandchildren, 688 brothers or sisters, 931 parents, foster children, 693 other relatives, 2,519 non-relatives
- In nonfamily households: 23,925 (8,485 male householders (5,980 living alone)), 9,285 female householders (7,198 living alone)), 6,155 nonrelatives
- In group quarters: 16,117 (4,028 institutionalized population)
24,754 married couples with children.
5,247 single-parent households (1,309 men, 3,938 women).
93.7% of residents of Andover speak English at home.
2.1% of residents speak Spanish at home (73% speak English very well, 20% speak English well, 7% speak English not well).
3.5% of residents speak other Indo-European language at home (77% speak English very well, 23% speak English well).
0.8% of residents speak other language at home (76% speak English very well, 24% speak English well).
Foreign born population: 179 (4.9%)
(70.9% of them are naturalized citizens)
| Here: | 7.2 |
| State: | 6.5 |
| Here: | 3.5 |
| State: | 4.0 |

- Bedrooms in owner-occupied houses and condos in Andover, Connecticut
- 0no bedroom
- 241 bedroom
- 1872 bedrooms
- 5623 bedrooms
- 2054 bedrooms
- 235+ bedrooms

- Bedrooms in renter-occupied apartments in Andover, Connecticut
- 12no bedroom
- 691 bedroom
- 122 bedrooms
- 473 bedrooms
- 34 bedrooms
- 65+ bedrooms

- Cars and other vehicles available in Andover in owner-occupied houses/condos
- 15no vehicle
- 1591 vehicle
- 4762 vehicles
- 2913 vehicles
- 474 vehicles
- 135+ vehicles

- Cars and other vehicles available in Andover in renter-occupied apartments
- 16no vehicle
- 741 vehicle
- 392 vehicles
- 143 vehicles
- 64 vehicles
- 05+ vehicles

- Rooms in owner-occupied houses in Andover, Connecticut
- 01 room
- 02 rooms
- 193 rooms
- 434 rooms
- 2035 rooms
- 2836 rooms
- 1937 rooms
- 1528 rooms
- 1089+ rooms

- Rooms in renter-occupied apartments in Andover, Connecticut
- 81 room
- 72 rooms
- 663 rooms
- 64 rooms
- 165 rooms
- 316 rooms
- 67 rooms
- 08 rooms
- 99+ rooms


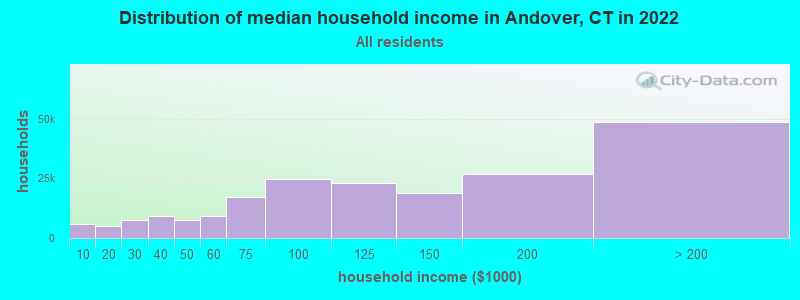
Andover, CT household income distribution

- 6,001Less than $10,000
- 5,189$10,000 to $19,999
- 7,624$20,000 to $29,999
- 9,326$30,000 to $39,999
- 7,764$40,000 to $49,999
- 9,141$50,000 to $59,999
- 17,089$60,000 to $74,999
- 24,873$75,000 to $99,999
- 23,290$100,000 to $124,999
- 18,760$125,000 to $149,999
- 26,895$150,000 to $199,999
- 48,734$200,000 or more
Percentage of workers working in this county: 30.6%
Number of people working at home: 377 (18.7% of all workers)
Travel time to work (commute)
- Less than 5 minutes: 36
- 5 to 9 minutes: 24
- 10 to 14 minutes: 132
- 15 to 19 minutes: 185
- 20 to 24 minutes: 326
- 25 to 29 minutes: 214
- 30 to 34 minutes: 333
- 35 to 39 minutes: 70
- 40 to 44 minutes: 118
- 45 to 59 minutes: 126
- 60 to 89 minutes: 59
- 90 or more minutes: 48
Means of transportation to work:
- Drove a car alone: 1,524 (88.6%)
- Carpooled: 119 (6.9%)
- Bus or trolley bus: 8 (0.5%)
- Railroad: 6 (0.3%)
- Walked: 6 (0.3%)
- Other means: 8 (0.5%)
- Worked at home: 50 (2.9%)


- Year of entry for the foreign-born population in Andover, Connecticut
- 81995 to March 2000
- 131990 to 1994
- 201985 to 1989
- 51980 to 1984
- 151975 to 1979
- 91970 to 1974
- 41965 to 1969
- 34Before 1965

First ancestries reported:
- Irish: 675 (16.1%)
- English: 599 (14.3%)
- Italian: 514 (12.3%)
- French: 441 (10.5%)
- German: 400 (9.5%)
- Other: 313 (7.5%)
- Polish: 278 (6.6%)
- French Canadian: 193 (4.6%)
- Scottish: 160 (3.8%)
- United States: 136 (3.2%)
- Swedish: 95 (2.3%)
- Lithuanian: 57 (1.4%)
- Dutch: 50 (1.2%)
- Scotch-Irish: 50 (1.2%)
- Russian: 47 (1.1%)
- Danish: 39 (0.9%)
- Czech: 34 (0.8%)
- Hungarian: 32 (0.8%)
- Norwegian: 29 (0.7%)
- Portuguese: 21 (0.5%)
- Swiss: 14 (0.3%)
- Ukrainian: 8 (0.2%)
- Welsh: 4 (0.10%)
Most common places of birth for foreign-born residents (%):
| Andover: | 14.8% (16) |
| Connecticut: | 5.2% (19,083) |
| Andover: | 10.2% (11) |
| Connecticut: | 0.6% (2,313) |
| Andover: | 8.3% (9) |
| Connecticut: | 3.6% (13,234) |
| Andover: | 8.3% (9) |
| Connecticut: | 6.9% (25,507) |
| Andover: | 8.3% (9) |
| Connecticut: | 2.1% (7,596) |
| Andover: | 8.3% (9) |
| Connecticut: | 4.1% (15,108) |
| Andover: | 8.3% (9) |
| Connecticut: | 0.3% (1,053) |
| Andover: | 7.4% (8) |
| Connecticut: | 3.1% (11,432) |
| Andover: | 7.4% (8) |
| Connecticut: | 1.5% (5,508) |
| Andover: | 5.6% (6) |
| Connecticut: | 1.7% (6,247) |
| Andover: | 3.7% (4) |
| Connecticut: | 0.7% (2,742) |
| Andover: | 3.7% (4) |
| Connecticut: | 0.7% (2,646) |
| Andover: | 2.8% (3) |
| Connecticut: | 4.4% (16,395) |
| Andover: | 2.8% (3) |
| Connecticut: | 0.4% (1,303) |
Place of birth for U.S.-born residents:
- This state: 2,134
- Other state: 769
- Northeast: 551
- Midwest: 90
- South: 93
- West: 35
65% of Andover residents lived in the same house 5 years ago.
Out of people who lived in different houses, 28% lived in this county.
Out of people who lived in different counties, 78% lived in Connecticut.
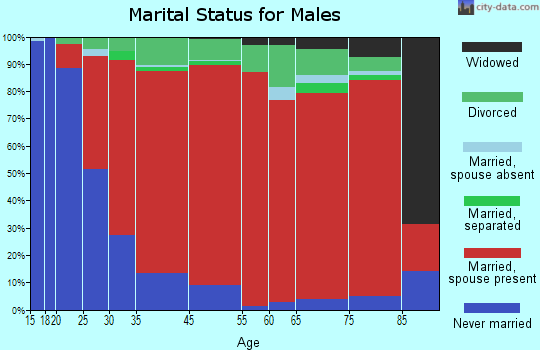
Education attainment for males 25 years and older:
- No schooling: 3
- Nursery to 4th grade: 0
- 5th and 6th grade: 3
- 7th and 8th grade: 9
- 9th grade: 14
- 10th grade: 13
- 11th grade: 27
- 12th grade, no diploma: 12
- High school graduate (or equivalency): 271
- Less than 1 year of college: 79
- Some college more than 1 year, no degree: 145
- Associate degree: 101
- Bachelor's degree: 236
- Master's degree: 67
- Professional school degree: 34
- Doctorate degree: 4

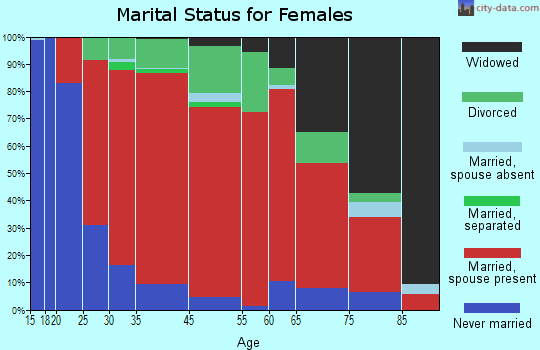
Education attainment for females 25 years and older:
- No schooling: 0
- Nursery to 4th grade: 4
- 5th and 6th grade: 6
- 7th and 8th grade: 11
- 9th grade: 0
- 10th grade: 4
- 11th grade: 12
- 12th grade, no diploma: 19
- High school graduate (or equivalency): 309
- Less than 1 year of college: 90
- Some college more than 1 year, no degree: 156
- Associate degree: 86
- Bachelor's degree: 260
- Master's degree: 86
- Professional school degree: 20
- Doctorate degree: 0

Housing units in structures:
- One, detached: 1,104
- One, attached: 18
- Two: 13
- 3 or 4: 7
- 5 to 9: 49
- 50 or more: 4
- Mobile homes: 3
Median worth of mobile homes: $19,026

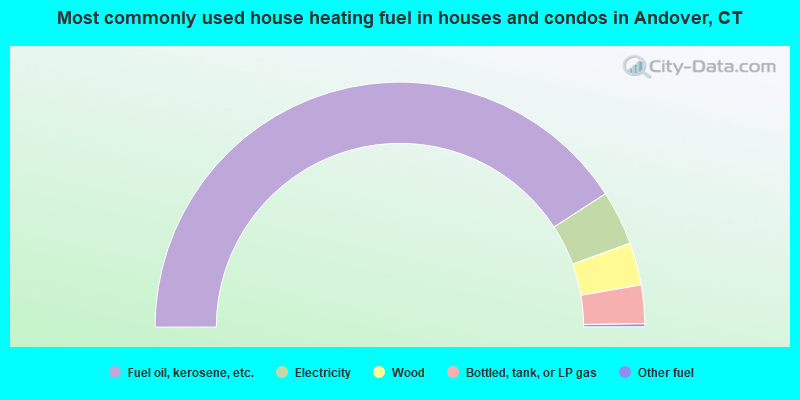
- 81.7%Fuel oil, kerosene, etc.
- 7.2%Electricity
- 5.6%Wood
- 5.1%Bottled, tank, or LP gas
- 0.4%Other fuel
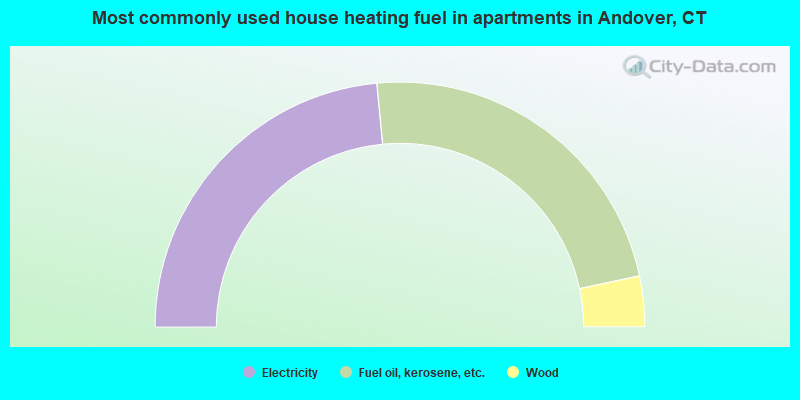
- 47.0%Electricity
- 46.3%Fuel oil, kerosene, etc.
- 6.7%Wood
Private vs. public school enrollment:
| Here: | 1.2% |
| Connecticut: | 9.9% |
| Here: | 2.5% |
| Connecticut: | 11.0% |
| Here: | 3.3% |
| Connecticut: | 33.4% |


