Arlington, GA (Georgia) Houses and Residents
| Arlington: | $127,474 |
| Georgia: | $297,400 |
Mean price in 2022:
Detached houses: $124,565
Here: $124,565 State: $376,364 Mobile homes: $236,510
Here: $236,510 State: $102,413
Total population: 1,409 (Urban population: 0, Rural population: 1,636 (35 farm, 1,601 nonfarm))
Houses: 645 (476 occupied: 260 owner occupied, 221 renter occupied)
| % of renters here: | 46% |
| State: | 34% |
Housing density: 161 houses/condos per square mile
Median price asked for vacant for-sale houses and condos in 2022 in this county: $69,327.
Median contract rent in 2022: $502 (lower quartile is $281, upper quartile is $578)
Median rent asked for vacant for-rent units in 2022: $5,108
Median gross rent in Arlington, GA in 2022: $732
Housing units in Arlington with a mortgage: 102 (0 second mortgage, 0 home equity loan, 0 both second mortgage and home equity loan)
Houses without a mortgage: 6
Median household income for houses/condos with a mortgage: $64,837
Median household income for apartments without a mortgage: $41,033
Median monthly housing costs: $568
Compare current foreclosures near Arlington, GA:
| Photo | Address | Area | Beds / Baths | Price | Details |
|---|---|---|---|---|---|

|
#1
Park Ave SE
Arlington, GA 39813
|
1,008 sq. feet
|
1 baths - beds |
show details | |

|
#2
Thomas Grove Church Rd
Arlington, GA 39813
|
1,950 sq. feet
|
1 baths - beds |
show details | |

|
#3
Thomas Grove Church Rd
Arlington, GA 39813
|
1,026 sq. feet
|
1 baths - beds |
show details | |

|
#4
Harpe Rd
Arlington, GA 39813
|
984 sq. feet
|
1 baths - beds |
show details | |

|
#5
Blakely Rd
Arlington, GA 39813
|
- sq. feet
|
- baths - beds |
show details | |

|
#6
Patmos Milford Hwy
Arlington, GA 39813
|
- sq. feet
|
- baths - beds |
show details | |

|
#7
Fannie Henry Ln
Arlington, GA 39813
|
- sq. feet
|
- baths - beds |
show details | |

|
#8
Three Notch Rd
Blakely, GA 39823
|
2,970 sq. feet
|
6 baths 5 beds |
show details | |

|
#9
Cox Rd
Colquitt, GA 39837
|
2,284 sq. feet
|
2 baths 3 beds |
show details | |

|
#10
Sandy Bottom Rd
Blakely, GA 39823
|
2,584 sq. feet
|
3 baths 4 beds |
show details |
| Photo | Address | Area | Beds / Baths | Price | Details |
|---|---|---|---|---|---|

|
#11
Havenwood Dr
Coleman, GA 39836
|
1,186 sq. feet
|
1 baths - beds |
show details | |

|
#12
Rose Dr
Blakely, GA 39823
|
2,220 sq. feet
|
2 baths - beds |
show details | |

|
#13
Redbud St
Blakely, GA 39823
|
636 sq. feet
|
2 baths - beds |
show details | |

|
#14
Redbud St
Blakely, GA 39823
|
1,112 sq. feet
|
1 baths - beds |
show details | |

|
#15
Westview Dr
Blakely, GA 39823
|
1,092 sq. feet
|
1 baths - beds |
show details | |

|
#16
Jenkins Rd
Blakely, GA 39823
|
500 sq. feet
|
1 baths - beds |
show details | |

|
#17
Meadowbrook Dr
Blakely, GA 39823
|
2,160 sq. feet
|
2 baths - beds |
show details | |

|
#18
North Ave
Blakely, GA 39823
|
1,014 sq. feet
|
1 baths - beds |
show details | |

|
#19
Poplar St
Blakely, GA 39823
|
1,056 sq. feet
|
1 baths - beds |
show details | |

|
#20
S Central Ave
Blakely, GA 39823
|
1,622 sq. feet
|
2 baths - beds |
show details |
| Photo | Address | Area | Beds / Baths | Price | Details |
|---|---|---|---|---|---|

|
#21
Flowers Dr
Blakely, GA 39823
|
1,410 sq. feet
|
2 baths - beds |
show details | |

|
#22
S Central Ave
Blakely, GA 39823
|
1,600 sq. feet
|
2 baths - beds |
show details | |

|
#23
Howell St
Blakely, GA 39823
|
1,425 sq. feet
|
1 baths - beds |
show details | |

|
#24
E South Blvd
Blakely, GA 39823
|
1,431 sq. feet
|
1 baths - beds |
show details | |

|
#25
Damascus St
Blakely, GA 39823
|
1,050 sq. feet
|
2 baths - beds |
show details | |

|
#26
Kestler Ave
Damascus, GA 39841
|
1,165 sq. feet
|
1 baths - beds |
show details | |

|
#27
Five Bridges Rd
Blakely, GA 39823
|
- sq. feet
|
- baths - beds |
show details | |

|
#28
Giles Hightower Rd
Blakely, GA 39823
|
1,536 sq. feet
|
- baths - beds |
show details | |

|
#29
Turner St
Edison, GA 39846
|
- sq. feet
|
- baths - beds |
show details | |

|
#30
Ga Highway 39
Blakely, GA 39823
|
- sq. feet
|
- baths - beds |
show details |
| Photo | Address | Area | Beds / Baths | Price | Details |
|---|---|---|---|---|---|

|
#31
Booker Washington St
Edison, GA 39846
|
- sq. feet
|
- baths - beds |
show details | |

|
#32
Freeman Rd
Blakely, GA 39823
|
- sq. feet
|
- baths - beds |
show details | |

|
#33
Avern Rd
Morgan, GA 39866
|
- sq. feet
|
- baths - beds |
show details | |

|
#34
Pullen Rd
Damascus, GA 39841
|
1,280 sq. feet
|
- baths - beds |
show details | |

|
#35
Ga Highway 200
Leary, GA 39862
|
- sq. feet
|
- baths - beds |
show details | |

|
#36
Phillipsburg Rd
Damascus, GA 39841
|
- sq. feet
|
- baths - beds |
show details | |

|
#37
Meadowbrook Dr
Blakely, GA 39823
|
- sq. feet
|
- baths - beds |
show details | |

|
#38
Meadowbrook Dr
Blakely, GA 39823
|
- sq. feet
|
- baths - beds |
show details | |

|
#39
Mulberry Ln
Blakely, GA 39823
|
- sq. feet
|
- baths - beds |
show details | |

|
#40
Radney Rd
Damascus, GA 39841
|
780 sq. feet
|
- baths - beds |
show details |
| Photo | Address | Area | Beds / Baths | Price | Details |
|---|---|---|---|---|---|

|
#41
E South Blvd Lot 46
Blakely, GA 39823
|
- sq. feet
|
- baths - beds |
show details | |

|
#42
Jesse Johnson Dr
Blakely, GA 39823
|
- sq. feet
|
- baths - beds |
show details | |

|
#43
Blakely Commons Cir
Blakely, GA 39823
|
- sq. feet
|
- baths - beds |
show details | |

|
#44
North Ave
Blakely, GA 39823
|
- sq. feet
|
- baths - beds |
show details | |

|
#45
Hogan Ave
Blakely, GA 39823
|
- sq. feet
|
- baths - beds |
show details | |

|
#46
First Kolomoki Rd
Blakely, GA 39823
|
840 sq. feet
|
- baths - beds |
show details | |

|
#47
Hogan Ave
Blakely, GA 39823
|
- sq. feet
|
- baths - beds |
show details | |

|
#48
Cuba Rd
Blakely, GA 39823
|
- sq. feet
|
- baths - beds |
show details | |

|
#49
Old Leary Rd
Leary, GA 39862
|
- sq. feet
|
- baths - beds |
show details | |

|
Check over 1 million property listings on Foreclosure.com!
|
browse all offers | |||

Latest news about housing in Arlington, GA collected exclusively by city-data.com from local newspapers, TV, and radio stations

 | Youth Development Park underway in Anthony Homes Community (0 replies) |
| NHL open to another expansion franchise in Atlanta (257 replies) |
| Could the ATL be getting a pro hockey team? (211 replies) |
| Luxury housing dominates in Atlanta, the most unequal US city (404 replies) |
| Atlanta MSA one of few top metros growing (296 replies) |
| Seeking Education: Supply vs. Demand of Residential Homes (7 replies) |

Median year apartment built: 1980
Household type by relationship:
Households: 1,161- Male householders: 140 (31 living alone), Female householders: 332 (71 living alone)
121 spouses (121 opposite-sex spouses), 44 unmarried partners, (44 opposite-sex unmarried partners), 418 children (410 natural, 0 adopted, 8 stepchildren), 38 grandchildren, 0 brothers or sisters, 22 parents, 0 foster children, 22 other relatives, 18 non-relatives
- In group quarters: 2
Size of family households: 220 2-persons, 97 3-persons, 27 4-persons, 11 5-persons, 12 7-or-more-persons.
Size of nonfamily households: 103 1-person, 10 2-persons.
8 married couples with children.
286 single-parent households (28 men, 258 women).
96.9% of residents of Arlington speak English at home.
1.9% of residents speak Spanish at home (24% speak English very well, 14% speak English well, 38% speak English not well, 24% don't speak English at all).
0.6% of residents speak other Indo-European language at home (100% speak English very well).
Foreign born population: 17 (1.5%)
(0.0% of them are naturalized citizens)
| Here: | 6.4 |
| State: | 6.8 |
| Here: | 4.7 |
| State: | 4.6 |

- Bedrooms in owner-occupied houses and condos in Arlington, Georgia
- 0no bedroom
- 01 bedroom
- 102 bedrooms
- 2033 bedrooms
- 474 bedrooms
- 05+ bedrooms

- Bedrooms in renter-occupied apartments in Arlington, Georgia
- 0no bedroom
- 101 bedroom
- 1082 bedrooms
- 803 bedrooms
- 244 bedrooms
- 05+ bedrooms

- Cars and other vehicles available in Arlington in owner-occupied houses/condos
- 30no vehicle
- 281 vehicle
- 1132 vehicles
- 613 vehicles
- 124 vehicles
- 165+ vehicles

- Cars and other vehicles available in Arlington in renter-occupied apartments
- 39no vehicle
- 1191 vehicle
- 382 vehicles
- 253 vehicles
- 04 vehicles
- 05+ vehicles

- Rooms in owner-occupied houses in Arlington, Georgia
- 01 room
- 02 rooms
- 03 rooms
- 104 rooms
- 465 rooms
- 866 rooms
- 397 rooms
- 468 rooms
- 339+ rooms

- Rooms in renter-occupied apartments in Arlington, Georgia
- 01 room
- 02 rooms
- 103 rooms
- 904 rooms
- 535 rooms
- 416 rooms
- 277 rooms
- 08 rooms
- 09+ rooms


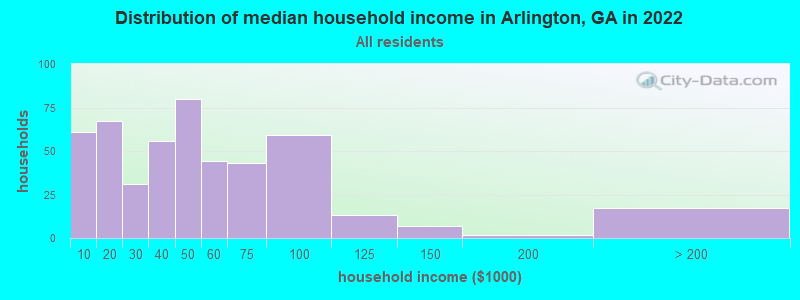
Arlington, GA household income distribution

- 61Less than $10,000
- 67$10,000 to $19,999
- 31$20,000 to $29,999
- 56$30,000 to $39,999
- 80$40,000 to $49,999
- 44$50,000 to $59,999
- 43$60,000 to $74,999
- 59$75,000 to $99,999
- 13$100,000 to $124,999
- 7$125,000 to $149,999
- 2$150,000 to $199,999
- 17$200,000 or more
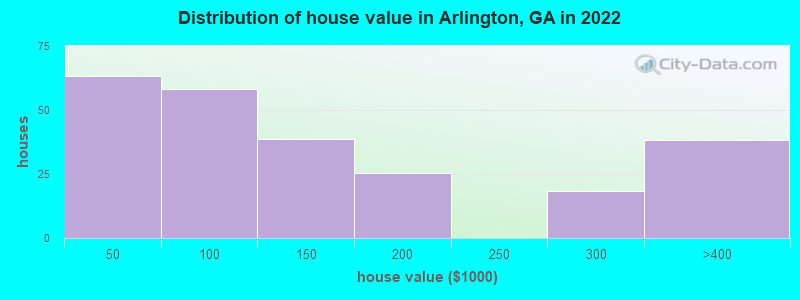
Home value of owner - occupied houses in 2022 in Arlington, GA
-
- 2$10,000 to $14,999
- 20$15,000 to $19,999
- 6$20,000 to $24,999
- 21$25,000 to $29,999
- 8$35,000 to $39,999
- 2$40,000 to $49,999
- 3$50,000 to $59,999
- 7$60,000 to $69,999
- 34$70,000 to $79,999
- 8$80,000 to $89,999
- 1$90,000 to $99,999
- 24$100,000 to $124,999
- 14$125,000 to $149,999
- 19$150,000 to $174,999
- 5$175,000 to $199,999
- 18$250,000 to $299,999
- 38$300,000 to $399,999
Rent paid by renters in 2022 in Arlington, GA
-
- 8Less than $100
- 20$200 to $249
- 16$250 to $299
- 53$450 to $499
- 12$500 to $549
- 6$550 to $599
- 3$600 to $649
- 25$650 to $699
- 54No cash rent


Percentage of workers working in this county: 45.2%
Number of people working at home: 83 (18.9% of all workers)
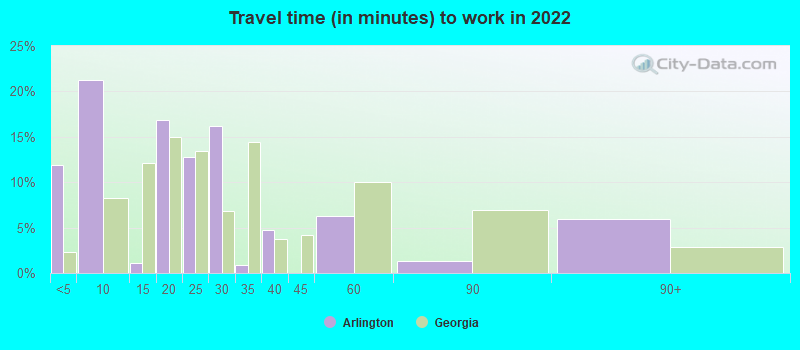
Travel time to work (commute)
- Less than 5 minutes: 17
- 5 to 9 minutes: 42
- 10 to 14 minutes: 56
- 15 to 19 minutes: 30
- 20 to 24 minutes: 38
- 25 to 29 minutes: 2
- 30 to 34 minutes: 15
- 35 to 39 minutes: 16
- 40 to 44 minutes: 10
- 45 to 59 minutes: 92
- 60 to 89 minutes: 32
- 90 or more minutes: 2
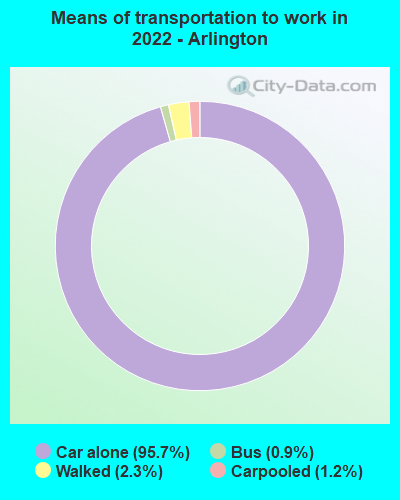
Means of transportation to work:
- Drove a car alone: 372 (88.2%)
- Carpooled: 4 (0.9%)
- Bus or trolley bus: 2 (0.5%)
- Walked: 8 (1.9%)
- Worked at home: 12 (2.8%)

- Unemployment by race in 2022
- Unemployment rate for Black residents
- 13.2%Males
- 6.3%Females

- Year of entry for the foreign-born population in Arlington, Georgia
- 02010 or later
- 52000 to 2009
- 01990 to 1999
- 01980 to 1989
- 01970 to 1979
- 2Before 1970

First ancestries reported:
- American: 109 (11.3%)
- Irish: 7 (0.7%)
- English: 6 (0.6%)
- African: 3 (0.3%)
- German: 2 (0.2%)
- Scotch-Irish: 1 (0.1%)
- Welsh: 1 (0.1%)
Most common places of birth for foreign-born residents (%):
| Arlington: | 94.1% (16) |
| Georgia: | 20.0% (223,400) |
Place of birth for U.S.-born residents:
- This state: 986
- Other state: 139
- Northeast: 13
- Midwest: 15
- South: 92
- West: 18
95.3% of Arlington residents lived in the same house 1 years ago.
Out of people who lived in different houses, 16.7% lived in this county.
Out of people who lived in different counties, 100.0% lived in Georgia.
| Arlington: | 95.3% |
| State average: | 86.6% |
Education attainment for males 25 years and older:
- No schooling: 5
- Nursery to 4th grade: 0
- 5th and 6th grade: 2
- 7th and 8th grade: 0
- 9th grade: 0
- 10th grade: 13
- 11th grade: 27
- 12th grade, no diploma: 7
- High school graduate (or equivalency): 135
- Less than 1 year of college: 3
- Some college more than 1 year, no degree: 60
- Associate degree: 21
- Bachelor's degree: 16
- Master's degree: 1
- Professional school degree: 3
- Doctorate degree: 0

Education attainment for females 25 years and older:
- No schooling: 0
- Nursery to 4th grade: 5
- 5th and 6th grade: 0
- 7th and 8th grade: 10
- 9th grade: 4
- 10th grade: 5
- 11th grade: 41
- 12th grade, no diploma: 3
- High school graduate (or equivalency): 130
- Less than 1 year of college: 5
- Some college more than 1 year, no degree: 89
- Associate degree: 40
- Bachelor's degree: 29
- Master's degree: 51
- Professional school degree: 0
- Doctorate degree: 0


Housing units in structures:
- One, detached: 390
- Two: 51
- 5 to 9: 20
- Mobile homes: 183
Housing units lacking complete kitchen facilities in 2022: 4.0%
House/condo owner moved in on average 18 years ago
Renter moved in on average 6 years ago

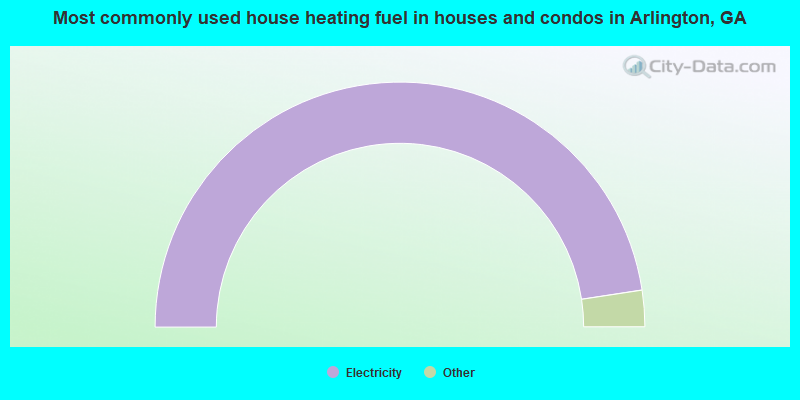
- 95.2%Electricity
- 3.2%Bottled, tank, or LP gas
- 1.6%Wood
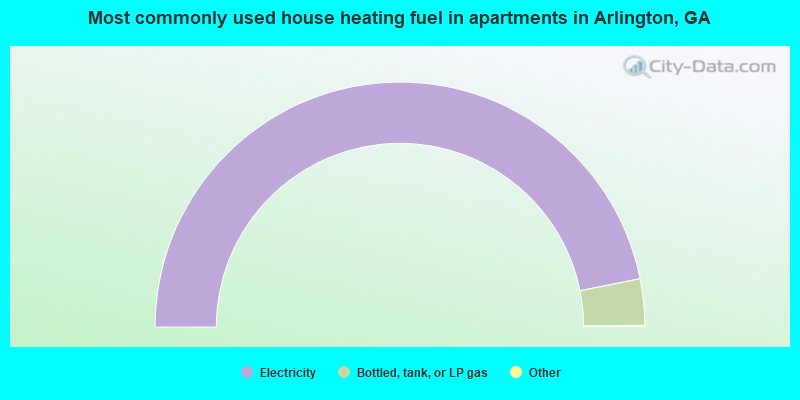
- 93.9%Electricity
- 6.1%Bottled, tank, or LP gas
Private vs. public school enrollment:
| Here: | 0.0% |
| Georgia: | 12.1% |
| Here: | 0.0% |
| Georgia: | 10.8% |
| Here: | 31.8% |
| Georgia: | 17.1% |


