Baldwin Harbor, NY (New York) Houses and Residents
Estimated median house or condo value in 2022: $634,978 (it was $233,000 in 2000 )
Baldwin Harbor:
$634,978New York:
$400,400
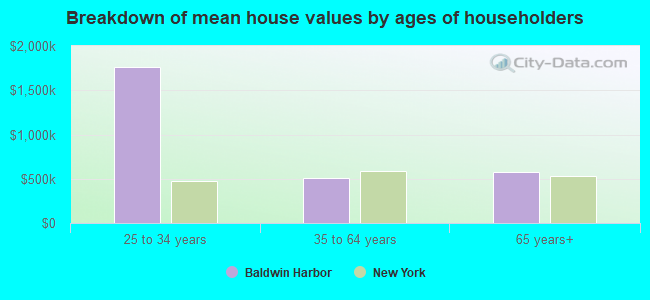
Lower value quartile - upper value quartile: $510,385 - $718,271Mean price in 2022: Detached houses: $579,871 Here:
$579,871State:
$476,719
Townhouses or other attached units: $403,047 Here:
$403,047State:
$699,270
In 2-unit structures: $772,634 Here:
$772,634State:
$713,077
In 5-or-more-unit structures: $212,502 Here:
$212,502State:
$912,009
Total population: 8,102 (All urban)
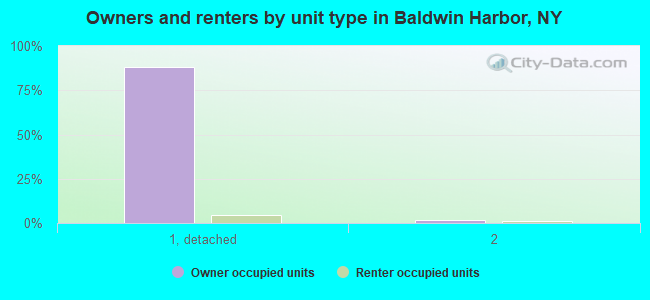
Houses: 2,817 (2,572 occupied: 2,465 owner occupied, 152 renter occupied )
% of renters here:
6%State:
46%
Housing density: 2,297 houses/condos per square mile
Median price asked for vacant for-sale houses and condos in 2022 in this county: $728,543.
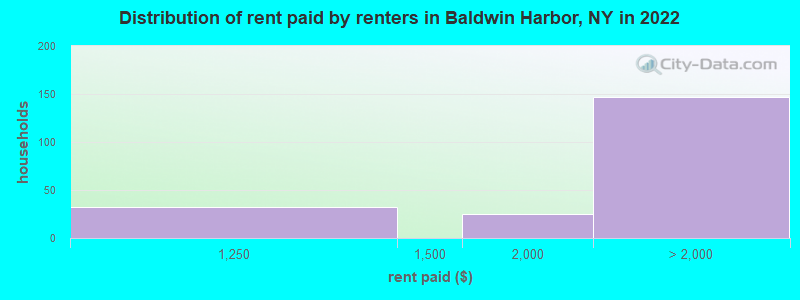
Median contract rent in 2022: $1,860 (lower quartile is $1,475, upper quartile is over $2,000)
Median rent asked for vacant for-rent units in 2022: $1,387
Median gross rent in Baldwin Harbor, NY in 2022: over $2,000
Housing units in Baldwin Harbor with a mortgage: 1,454 (27 second mortgage, 203 home equity loan, 12 both second mortgage and home equity loan )Houses without a mortgage: 924
Median household income for houses/condos with a mortgage: $182,046
Median household income for apartments without a mortgage: $137,471
Median monthly housing costs: $2,794
Data:
Median house or condo value ($)
Median house or condo value ($ change since 2000)
Median house or condo value ($) - White
Median house or condo value ($) - Black or African American
Median house or condo value ($) - Asian
Median house or condo value ($) - Hispanic or Latino
Median house or condo value ($) - American Indian and Alaska Native
Median house or condo value ($) - Multirace
Median house or condo value ($) - Other Race
Median price asked for mobile homes ($)
Household density (households per square mile)
Mean house or condo value by units in structure - 1, detached ($)
Mean house or condo value by units in structure - 1, attached ($)
Mean house or condo value by units in structure - 2 ($)
Mean house or condo value by units in structure by units in structure - 3 or 4 ($)
Mean house or condo value by units in structure - 5 or more ($)
Mean house or condo value by units in structure - Boat, RV, van, etc. ($)
Mean house or condo value by units in structure - Mobile home ($)
Median contract rent ($)
Median contract rent - Lower quartile ($)
Median contract rent - Upper quartile ($)
Median gross rent ($)
Urban houses (%)
Rural houses (%)
Houses occupied (%)
Houses occupied (% change since 2000)
Houses owner occupied (%)
Houses owner occupied (% change since 2000)
Houses renter occupied (%)
Houses renter occupied (% change since 2000)
Vacant housing units - For rent (%)
Vacant housing units - For rent (% change since 2000)
Vacant housing units - For sale only (%)
Vacant housing units - For sale only (% change since 2000)
Vacant housing units - Rented or sold, not occupied (%)
Vacant housing units - Rented or sold, not occupied (% change since 2000)
Vacant housing units - For seasonal, recreational, or occasional use (%)
Vacant housing units - For seasonal, recreational, or occasional use (% change since 2000)
Vacant housing units - For migrant workers (%)
Vacant housing units - For migrant workers (% change since 2000)
Vacant housing units - Other vacant (%)
Vacant housing units - Other vacant (% change since 2000)
Median monthly housing costs ($)
Median household income for houses/condos with a mortgage ($)
Median household income for houses/condos without a mortgage ($)
Median household income ($)
Median household income ($) - White
Median household income ($) - Black or African American
Median household income ($) - Asian
Median household income ($) - Hispanic or Latino
Median household income ($) - American Indian and Alaska Native
Median household income ($) - Multirace
Median household income ($) - Other Race
Mortgage status - with mortgage (%)
Mortgage status - with second mortgage (%)
Mortgage status - with home equity loan (%)
Mortgage status - with both second mortgage and home equity loan (%)
Mortgage status - without a mortgage (%)
Median year house/condo built
Median year apartment built
Household type by relationship - Male householder living alone (%)
Household type by relationship - Male householder not living alone (%)
Household type by relationship - Female householder living alone (%)
Household type by relationship - Female householder not living alone (%)
Household type by relationship - Opposite-Sex spouse (%)
Household type by relationship - Same-Sex spouse (%)
Household type by relationship - Opposite-Sex unmarried partner (%)
Household type by relationship - Same-Sex unmarried partner (%)
Household type by relationship - In group quarters (%)
Size of family households - 2-person household (%)
Size of family households - 3-person household (%)
Size of family households - 4-person household (%)
Size of family households - 5-person household (%)
Size of family households - 6-person household (%)
Size of family households - 7-or-more-person household (%)
Size of nonfamily households - 1-person household (%)
Size of nonfamily households - 2-person household (%)
Size of nonfamily households - 3-person household (%)
Size of nonfamily households - 4-person household (%)
Size of nonfamily households - 5-person household (%)
Size of nonfamily households - 6-person household (%)
Size of nonfamily households - 7-or-moreperson household (%)
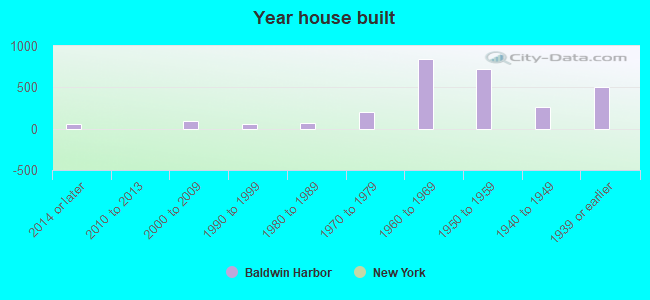
Year house built - Built 2010 or later (%)
Year house built - Built 2000 to 2009 (%)
Year house built - Built 1990 to 1999 (%)
Year house built - Built 1980 to 1989 (%)
Year house built - Built 1970 to 1979 (%)
Year house built - Built 1960 to 1969 (%)
Year house built - Built 1950 to 1959 (%)
Year house built - Built 1940 to 1949 (%)
Year house built - Built 1939 or earlier (%)
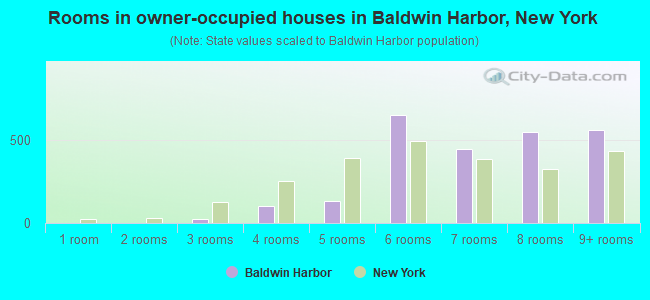
Median number of rooms in houses and condos
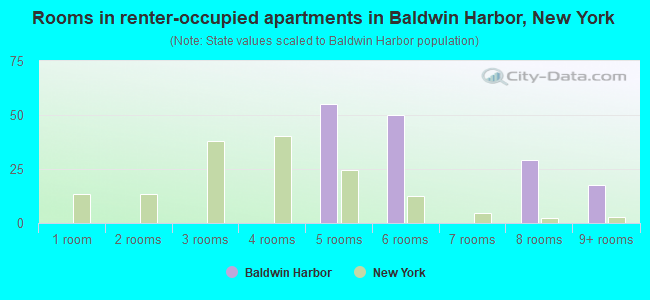
Median number of rooms in apartments
Median number of bedrooms in owner occupied houses
Mean number of bedrooms in owner occupied houses
Median number of bedrooms in renter occupied houses
Mean number of bedrooms in renter occupied houses
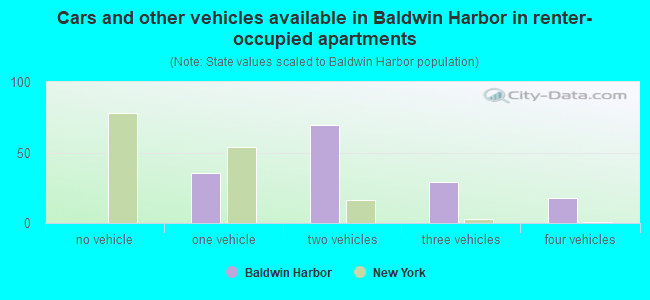
Median number of vehichles in owner occupied houses
Mean number of vehichles in owner occupied houses
Median number of vehichles in renter occupied houses
Mean number of vehichles in renter occupied houses
Rooms in owner-occupied houses - 1 room (%)
Rooms in owner-occupied houses - 2 rooms (%)
Rooms in owner-occupied houses - 3 rooms (%)
Rooms in owner-occupied houses - 4 rooms (%)
Rooms in owner-occupied houses - 5 rooms (%)
Rooms in owner-occupied houses - 6 rooms (%)
Rooms in owner-occupied houses - 7 rooms (%)
Rooms in owner-occupied houses - 8 rooms (%)
Rooms in owner-occupied houses - 9+ rooms (%)
Rooms in renter-occupied houses - 1 room (%)
Rooms in renter-occupied houses - 2 rooms (%)
Rooms in renter-occupied houses - 3 rooms (%)
Rooms in renter-occupied houses - 4 rooms (%)
Rooms in renter-occupied houses - 5 rooms (%)
Rooms in renter-occupied houses - 6 rooms (%)
Rooms in renter-occupied houses - 7 rooms (%)
Rooms in renter-occupied houses - 8 rooms (%)
Rooms in renter-occupied houses - 9+ rooms (%)
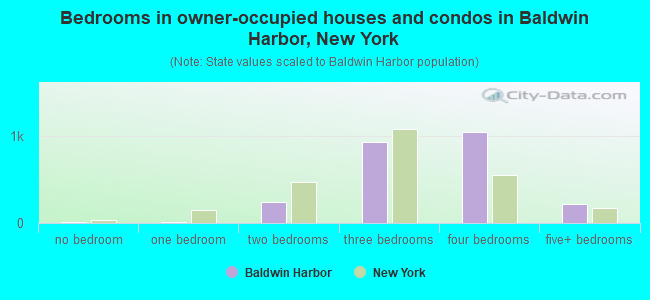
Bedrooms in owner-occupied houses - no bedrooms (%)
Bedrooms in owner-occupied houses - 1 bedroom (%)
Bedrooms in owner-occupied houses - 2 bedrooms (%)
Bedrooms in owner-occupied houses - 3 bedrooms (%)
Bedrooms in owner-occupied houses - 4 bedrooms (%)
Bedrooms in owner-occupied houses - 5+ bedrooms (%)
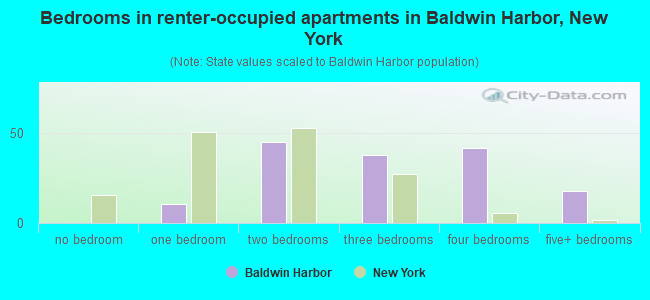
Bedrooms in renter-occupied houses - no bedrooms (%)
Bedrooms in renter-occupied houses - 1 bedroom (%)
Bedrooms in renter-occupied houses - 2 bedrooms (%)
Bedrooms in renter-occupied houses - 3 bedrooms (%)
Bedrooms in renter-occupied houses - 4 bedrooms (%)
Bedrooms in renter-occupied houses - 5+ bedrooms (%)
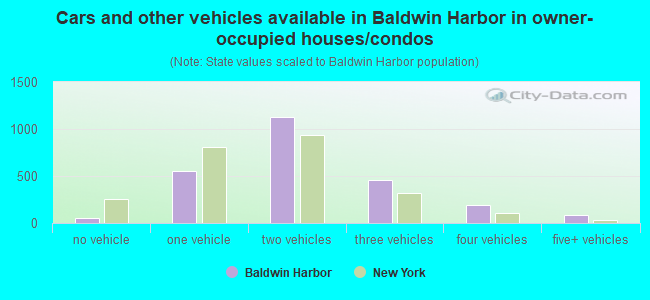
Vehicles available in owner-occupied houses - no vehicle available (%)
Vehicles available in owner-occupied houses - 1 vehicle available(%)
Vehicles available in owner-occupied houses - 2 Vehicles available (%)
Vehicles available in owner-occupied houses - 3 Vehicles available (%)
Vehicles available in owner-occupied houses - 4 Vehicles available (%)
Vehicles available in owner-occupied houses - 5+ Vehicles available (%)
Vehicles available in renter-occupied houses - no vehicle available (%)
Vehicles available in renter-occupied houses - 1 vehicle available (%)
Vehicles available in renter-occupied houses - 2 Vehicles available (%)
Vehicles available in renter-occupied houses - 3 Vehicles available (%)
Vehicles available in renter-occupied houses - 4 Vehicles available (%)
Vehicles available in renter-occupied houses - 5+ Vehicles available (%)
Housing units in structures - 1, detached (%)
Housing units in structures - 1, attached (%)
Housing units in structures - 2 (%)
Housing units in structures - 3 or 4 (%)
Housing units in structures - 5 to 9 (%)
Housing units in structures - 10 to 19 (%)
Housing units in structures - 20 to 49 (%)
Housing units in structures - 50 or more (%)
Housing units in structures - Mobile home (%)
Housing units in structures - Boat, RV, van, etc. (%)
Housing units in structures - Owners - 1, detached (%)
Housing units in structures - Owners - 1, attached (%)
Housing units in structures - Owners - 2 (%)
Housing units in structures - Owners - 3 or 4 (%)
Housing units in structures - Owners - 5 to 9 (%)
Housing units in structures - Owners - 10 to 19 (%)
Housing units in structures - Owners - 20 to 49 (%)
Housing units in structures - Owners - 50 or more (%)
Housing units in structures - Owners - Mobile home (%)
Housing units in structures - Owners - Boat, RV, van, etc. (%)
Housing units in structures - Renters - 1, detached (%)
Housing units in structures - Renters - 1, attached (%)
Housing units in structures - Renters - 2 (%)
Housing units in structures - Renters - 3 or 4 (%)
Housing units in structures - Renters - 5 to 9 (%)
Housing units in structures - Renters - 10 to 19 (%)
Housing units in structures - Renters - 20 to 49 (%)
Housing units in structures - Renters - 50 or more (%)
Housing units in structures - Renters - Mobile home (%)
Housing units in structures - Renters - Boat, RV, van, etc. (%)
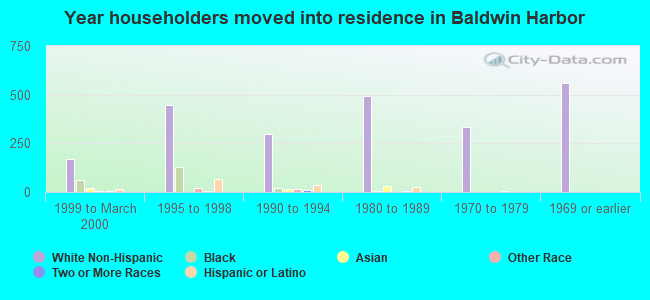
House/condo owner moved in on average (years ago)
Renter moved in on average (years ago)
Year householder moved into unit - Moved in 1999 to March 2000 (%)
Year householder moved into unit - Moved in 1999 to March 2000 (%) - White
Year householder moved into unit - Moved in 1999 to March 2000 (%) - Black or African American
Year householder moved into unit - Moved in 1999 to March 2000 (%) - Asian
Year householder moved into unit - Moved in 1999 to March 2000 (%) - Hispanic or Latino
Year householder moved into unit - Moved in 1999 to March 2000 (%) - American Indian and Alaska Native
Year householder moved into unit - Moved in 1999 to March 2000 (%) - Multirace
Year householder moved into unit - Moved in 1999 to March 2000 (%) - Other Race
Year householder moved into unit - Moved in 1995 to 1998 (%)
Year householder moved into unit - Moved in 1995 to 1998 (%) - White
Year householder moved into unit - Moved in 1995 to 1998 (%) - Black or African American
Year householder moved into unit - Moved in 1995 to 1998 (%) - Asian
Year householder moved into unit - Moved in 1995 to 1998 (%) - Hispanic or Latino
Year householder moved into unit - Moved in 1995 to 1998 (%) - American Indian and Alaska Native
Year householder moved into unit - Moved in 1995 to 1998 (%) - Multirace
Year householder moved into unit - Moved in 1995 to 1998 (%) - Other Race
Year householder moved into unit - Moved in 1990 to 1994 (%)
Year householder moved into unit - Moved in 1990 to 1994 (%) - White
Year householder moved into unit - Moved in 1990 to 1994 (%) - Black or African American
Year householder moved into unit - Moved in 1990 to 1994 (%) - Asian
Year householder moved into unit - Moved in 1990 to 1994 (%) - Hispanic or Latino
Year householder moved into unit - Moved in 1990 to 1994 (%) - American Indian and Alaska Native
Year householder moved into unit - Moved in 1990 to 1994 (%) - Multirace
Year householder moved into unit - Moved in 1990 to 1994 (%) - Other Race
Year householder moved into unit - Moved in 1980 to 1989 (%)
Year householder moved into unit - Moved in 1980 to 1989 (%) - White
Year householder moved into unit - Moved in 1980 to 1989 (%) - Black or African American
Year householder moved into unit - Moved in 1980 to 1989 (%) - Asian
Year householder moved into unit - Moved in 1980 to 1989 (%) - Hispanic or Latino
Year householder moved into unit - Moved in 1980 to 1989 (%) - American Indian and Alaska Native
Year householder moved into unit - Moved in 1980 to 1989 (%) - Multirace
Year householder moved into unit - Moved in 1980 to 1989 (%) - Other Race
Year householder moved into unit - Moved in 1970 to 1979 (%)
Year householder moved into unit - Moved in 1970 to 1979 (%) - White
Year householder moved into unit - Moved in 1970 to 1979 (%) - Black or African American
Year householder moved into unit - Moved in 1970 to 1979 (%) - Asian
Year householder moved into unit - Moved in 1970 to 1979 (%) - Hispanic or Latino
Year householder moved into unit - Moved in 1970 to 1979 (%) - American Indian and Alaska Native
Year householder moved into unit - Moved in 1970 to 1979 (%) - Multirace
Year householder moved into unit - Moved in 1970 to 1979 (%) - Other Race
Year householder moved into unit - Moved in 1969 or earlier (%)
Year householder moved into unit - Moved in 1969 or earlier (%) - White
Year householder moved into unit - Moved in 1969 or earlier (%) - Black or African American
Year householder moved into unit - Moved in 1969 or earlier (%) - Asian
Year householder moved into unit - Moved in 1969 or earlier (%) - Hispanic or Latino
Year householder moved into unit - Moved in 1969 or earlier (%) - American Indian and Alaska Native
Year householder moved into unit - Moved in 1969 or earlier (%) - Multirace
Year householder moved into unit - Moved in 1969 or earlier (%) - Other Race
Housing units lacking complete plumbing facilities (%)
Housing units lacking complete kitchen facilities (%)
House heating fuel used in houses and condos - Utility gas (%)
House heating fuel used in houses and condos - Bottled, tank, or LP gas (%)
House heating fuel used in houses and condos - Electricity (%)
House heating fuel used in houses and condos - Fuel oil, kerosene, etc. (%)
House heating fuel used in houses and condos - Coal or coke (%)
House heating fuel used in houses and condos - Wood (%)
House heating fuel used in houses and condos - Solar energy (%)
House heating fuel used in houses and condos - Other fuel (%)
House heating fuel used in houses and condos - No fuel used (%)
House heating fuel used in apartments - Utility gas (%)
House heating fuel used in apartments - Bottled, tank, or LP gas (%)
House heating fuel used in apartments - Electricity (%)
House heating fuel used in apartments - Fuel oil, kerosene, etc. (%)
House heating fuel used in apartments - Coal or coke (%)
House heating fuel used in apartments - Wood (%)
House heating fuel used in apartments - Solar energy (%)
House heating fuel used in apartments - Other fuel (%)
House heating fuel used in apartments - No fuel used (%)
Median year house/condo built: 1960Median year apartment built: 1945Household type by relationship:
Households: 7,789
Male householders: 1,368 (191 living alone ), Female householders: 1,198 (273 living alone )1,516 spouses (1,512 opposite-sex spouses ), 131 unmarried partners , (119 opposite-sex unmarried partners ), 2,486 children (2,366 natural , 53 adopted , 66 stepchildren ), 254 grandchildren , 126 brothers or sisters , 139 parents , 0 foster children , 434 other relatives , 111 non-relatives In group quarters: 21
Size of family households: 581 2-persons , 650 3-persons , 448 4-persons , 196 5-persons , 87 6-persons , 32 7-or-more-persons .
Size of nonfamily households: 493 1-person , 96 2-persons , 11 3-persons , 10 6-persons .
949 married couples with children. single-parent households (10 men , 76 women ).
78.2% of residents of Baldwin Harbor speak English at home. of residents speak Spanish at home (66% speak English very well , 21% speak English well , 10% speak English not well , 3% don't speak English at all ).of residents speak other Indo-European language at home (59% speak English very well , 39% speak English well , 2% don't speak English at all ).of residents speak Asian or Pacific Island language at home (79% speak English very well , 18% speak English well , 3% speak English not well ).of residents speak other language at home (83% speak English very well , 17% speak English well ).
Foreign born population: 1,989 (25.5%)of them are naturalized citizens )
Median number of rooms in houses and condos:
Median number of rooms in apartments
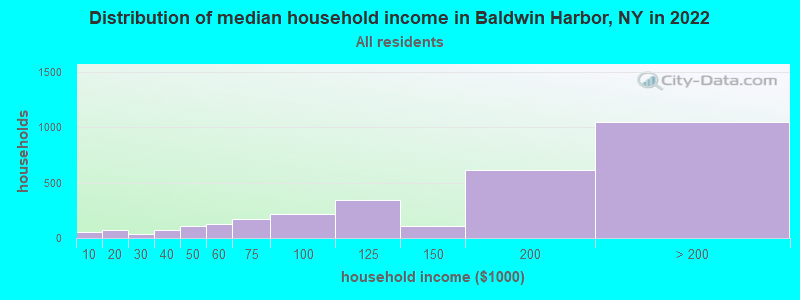
Baldwin Harbor, NY household income distribution 51 Less than $10,00074 $10,000 to $19,99940 $20,000 to $29,99975 $30,000 to $39,999110 $40,000 to $49,999123 $50,000 to $59,999169 $60,000 to $74,999213 $75,000 to $99,999342 $100,000 to $124,999109 $125,000 to $149,999616 $150,000 to $199,9991,047 $200,000 or more
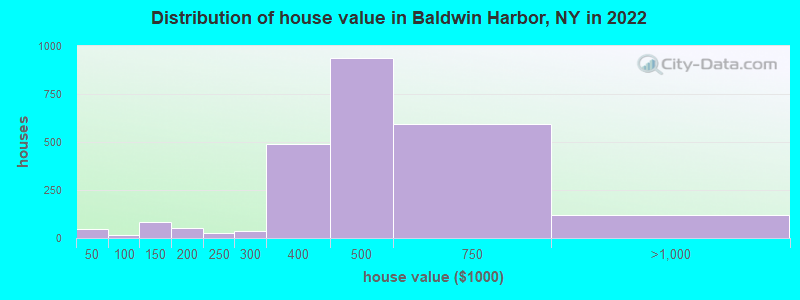
Home value of owner - occupied houses in 2022 in Baldwin Harbor, NY 32 Less than $10,0005 $35,000 to $39,9998 $40,000 to $49,9996 $80,000 to $89,9998 $100,000 to $124,99971 $125,000 to $149,99953 $150,000 to $174,99928 $200,000 to $249,99936 $250,000 to $299,999486 $300,000 to $399,999934 $400,000 to $499,999595 $500,000 to $749,999111 $750,000 to $999,9999 $2,000,000 or moreRent paid by renters in 2022 in Baldwin Harbor, NY 31 $1,000 to $1,24924 $1,500 to $1,999105 $2,500 to $2,99941 $3,000 to $3,499
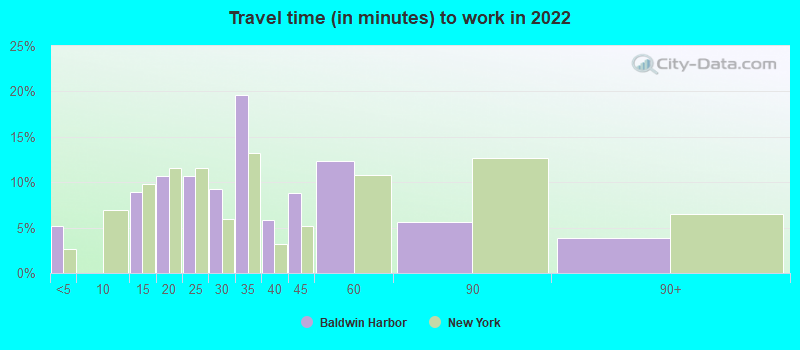
Percentage of workers working in this county: 58.2%Number of people working at home: 1,323 (30.1% of all workers )
Travel time to work (commute)
Less than 5 minutes: 875 to 9 minutes: 21110 to 14 minutes: 24215 to 19 minutes: 16220 to 24 minutes: 26225 to 29 minutes: 24230 to 34 minutes: 43635 to 39 minutes: 3140 to 44 minutes: 22045 to 59 minutes: 57860 to 89 minutes: 81690 or more minutes: 345
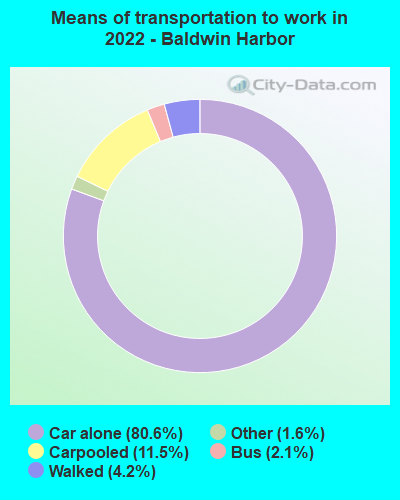
Means of transportation to work:
Drove a car alone: 549 (48.8%)Carpooled: 74 (6.6%)Bus : 12 (1.1%)Taxi: 24 (2.1%)Walked: 27 (2.4%)Worked at home: 1,323 (117.6%)
Unemployment by race in 2022
Unemployment rate for White non-Hispanic residents 3.2% Males2.4% FemalesUnemployment rate for Black residents 1.2% Males3.3% FemalesUnemployment rate for American Indian and Alaska Native residents 100.0% MalesUnemployment rate for Asian residents 4.9% FemalesUnemployment rate for two or more race residents 11.5% MalesUnemployment rate for Hispanic or Latino residents 6.2% Males
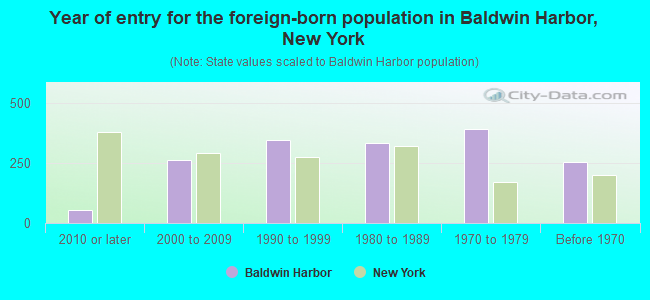
Year of entry for the foreign-born population in Baldwin Harbor, New York
54 2010 or later 263 2000 to 2009 346 1990 to 1999 334 1980 to 1989 393 1970 to 1979 255 Before 1970
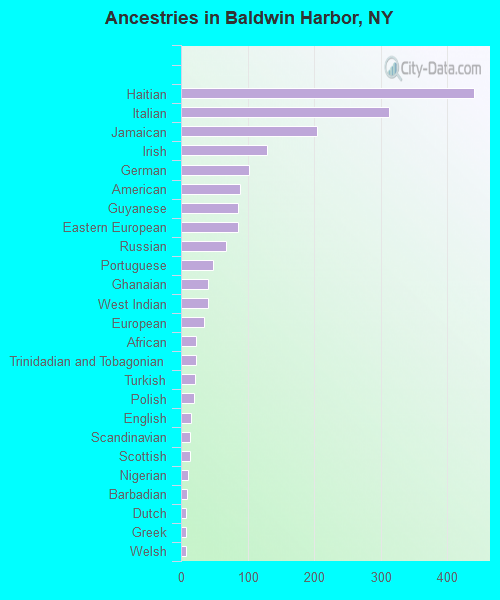
First ancestries reported:
Haitian: 441 (11.1%)
Italian: 313 (7.9%)
Jamaican: 205 (5.2%)
Irish: 130 (3.3%)
German: 102 (2.6%)
American: 89 (2.2%)
Guyanese: 86 (2.2%)
Eastern European: 85 (2.1%)
Russian: 68 (1.7%)
Portuguese: 48 (1.2%)
Ghanaian: 41 (1.0%)
West Indian: 41 (1.0%)
European: 34 (0.9%)
African: 23 (0.6%)
Trinidadian and Tobagonian: 22 (0.6%)
Turkish: 21 (0.5%)
Polish: 19 (0.5%)
English: 15 (0.4%)
Scandinavian: 13 (0.3%)
Scottish: 13 (0.3%)
Nigerian: 10 (0.3%)
Barbadian: 9 (0.2%)
Dutch: 8 (0.2%)
Greek: 8 (0.2%)
Welsh: 8 (0.2%)
French Canadian: 7 (0.2%)
Iranian: 7 (0.2%) Most common places of birth for foreign-born residents (%): Haiti Baldwin Harbor:
21.2% (402)New York:
100.0% (-1)
Dominican Republic Baldwin Harbor:
13.8% (262)New York:
100.0% (-1)
Jamaica Baldwin Harbor:
10.2% (194)New York:
100.0% (-1)
Guyana Baldwin Harbor:
8.9% (168)New York:
100.0% (-1)
Mexico Baldwin Harbor:
5.9% (111)New York:
100.0% (-1)
India Baldwin Harbor:
4.8% (91)New York:
100.0% (-1)
Uruguay Baldwin Harbor:
4.4% (83)New York:
100.0% (-1)
Colombia Baldwin Harbor:
4.3% (81)New York:
100.0% (-1)
Philippines Baldwin Harbor:
3.2% (61)New York:
100.0% (-1)
Ghana Baldwin Harbor:
2.8% (53)New York:
100.0% (-1)
Trinidad and Tobago Baldwin Harbor:
2.2% (41)New York:
100.0% (-1)
Ecuador Baldwin Harbor:
2.2% (41)New York:
100.0% (-1)
St. Vincent and the Grenadines Baldwin Harbor:
1.7% (33)New York:
100.0% (-1)
Barbados Baldwin Harbor:
1.7% (32)New York:
100.0% (-1)
Place of birth for U.S.-born residents:
This state: 5,135Other state: 534Northeast: 304Midwest: 12South: 234West: 7 94.1% of Baldwin Harbor residents lived in the same house 1 years ago.
Out of people who lived in different houses, 37.4% lived in this county.
Out of people who lived in different counties, 30.0% lived in New York.
Baldwin Harbor:
94.1%State average:
89.6%
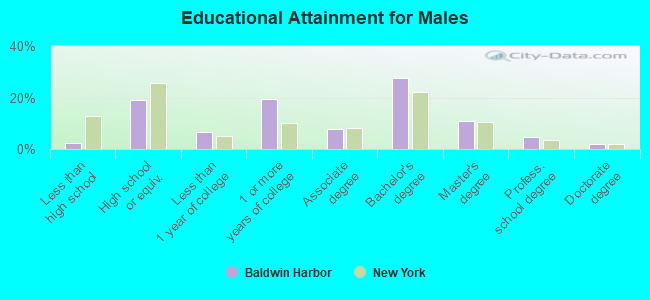
Education attainment for males 25 years and older:
No schooling: 49Nursery to 4th grade: 05th and 6th grade: 117th and 8th grade: 99th grade: 010th grade: 011th grade: 012th grade, no diploma: 0High school graduate (or equivalency): 540Less than 1 year of college: 185Some college more than 1 year, no degree: 552Associate degree: 227Bachelor's degree: 790Master's degree: 308Professional school degree: 134Doctorate degree: 59
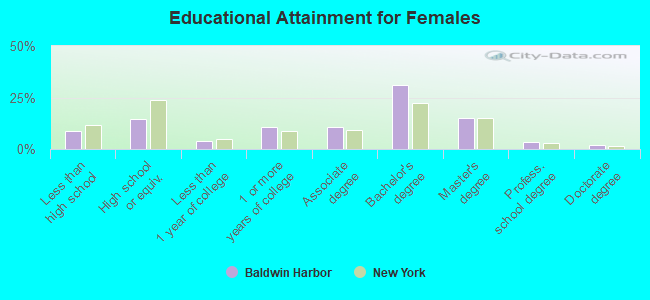
Education attainment for females 25 years and older:
No schooling: 78Nursery to 4th grade: 155th and 6th grade: 517th and 8th grade: 529th grade: 010th grade: 011th grade: 612th grade, no diploma: 56High school graduate (or equivalency): 426Less than 1 year of college: 109Some college more than 1 year, no degree: 309Associate degree: 314Bachelor's degree: 903Master's degree: 441Professional school degree: 106Doctorate degree: 61
Housing units in structures:
One, detached: 2,666One, attached: 57Two: 2420 to 49: 3350 or more: 34Median worth of mobile homes: $403,846
Housing units lacking complete plumbing facilities in 2022: 1.1%Housing units lacking complete kitchen facilities in 2022: 1.1%House/condo owner moved in on average 18 years ago
Renter moved in on average 2 years ago
Private vs. public school enrollment:
Students in private schools in grades 1 to 8 (elementary and middle school): 109 Students in private schools in grades 9 to 12 (high school): 77 Students in private undergraduate colleges: 155