Bartlett, NH (New Hampshire) Houses and Residents
Estimated median house or condo value in 2022: $349,379 (it was $114,200 in 2000 )
Bartlett:
$349,379New Hampshire:
$384,700
Lower value quartile - upper value quartile: $239,515 - $496,499Total population: 2,788 (Urban population: 0, Rural population: 2,736 (13 farm, 2,723 nonfarm ))
Houses: 3,613 (1,220 occupied: 891 owner occupied, 329 renter occupied )
% of renters here:
27%State:
28%
Housing density: 48 houses/condos per square mile
Median price asked for vacant for-sale houses and condos in 2022 in this county: $272,426.
Median contract rent in 2022: $1,042 (lower quartile is $802, upper quartile is $1,339)
Median rent asked for vacant for-rent units in 2022: $876
Median gross rent in Bartlett, NH in 2022: $1,303
Housing units in Bartlett with a mortgage: 428 (27 second mortgage, 27 home equity loan, 0 both second mortgage and home equity loan )Houses without a mortgage: 248
Data:
Median house or condo value ($)
Median house or condo value ($ change since 2000)
Median house or condo value ($) - White
Median house or condo value ($) - Black or African American
Median house or condo value ($) - Asian
Median house or condo value ($) - Hispanic or Latino
Median house or condo value ($) - American Indian and Alaska Native
Median house or condo value ($) - Multirace
Median house or condo value ($) - Other Race
Median price asked for mobile homes ($)
Household density (households per square mile)
Mean house or condo value by units in structure - 1, detached ($)
Mean house or condo value by units in structure - 1, attached ($)
Mean house or condo value by units in structure - 2 ($)
Mean house or condo value by units in structure by units in structure - 3 or 4 ($)
Mean house or condo value by units in structure - 5 or more ($)
Mean house or condo value by units in structure - Boat, RV, van, etc. ($)
Mean house or condo value by units in structure - Mobile home ($)
Median contract rent ($)
Median contract rent - Lower quartile ($)
Median contract rent - Upper quartile ($)
Median gross rent ($)
Urban houses (%)
Rural houses (%)
Houses occupied (%)
Houses occupied (% change since 2000)
Houses owner occupied (%)
Houses owner occupied (% change since 2000)
Houses renter occupied (%)
Houses renter occupied (% change since 2000)
Vacant housing units - For rent (%)
Vacant housing units - For rent (% change since 2000)
Vacant housing units - For sale only (%)
Vacant housing units - For sale only (% change since 2000)
Vacant housing units - Rented or sold, not occupied (%)
Vacant housing units - Rented or sold, not occupied (% change since 2000)
Vacant housing units - For seasonal, recreational, or occasional use (%)
Vacant housing units - For seasonal, recreational, or occasional use (% change since 2000)
Vacant housing units - For migrant workers (%)
Vacant housing units - For migrant workers (% change since 2000)
Vacant housing units - Other vacant (%)
Vacant housing units - Other vacant (% change since 2000)
Median monthly housing costs ($)
Median household income for houses/condos with a mortgage ($)
Median household income for houses/condos without a mortgage ($)
Median household income ($)
Median household income ($) - White
Median household income ($) - Black or African American
Median household income ($) - Asian
Median household income ($) - Hispanic or Latino
Median household income ($) - American Indian and Alaska Native
Median household income ($) - Multirace
Median household income ($) - Other Race
Mortgage status - with mortgage (%)
Mortgage status - with second mortgage (%)
Mortgage status - with home equity loan (%)
Mortgage status - with both second mortgage and home equity loan (%)
Mortgage status - without a mortgage (%)
Median year house/condo built
Median year apartment built
Household type by relationship - Male householder living alone (%)
Household type by relationship - Male householder not living alone (%)
Household type by relationship - Female householder living alone (%)
Household type by relationship - Female householder not living alone (%)
Household type by relationship - Opposite-Sex spouse (%)
Household type by relationship - Same-Sex spouse (%)
Household type by relationship - Opposite-Sex unmarried partner (%)
Household type by relationship - Same-Sex unmarried partner (%)
Household type by relationship - In group quarters (%)
Size of family households - 2-person household (%)
Size of family households - 3-person household (%)
Size of family households - 4-person household (%)
Size of family households - 5-person household (%)
Size of family households - 6-person household (%)
Size of family households - 7-or-more-person household (%)
Size of nonfamily households - 1-person household (%)
Size of nonfamily households - 2-person household (%)
Size of nonfamily households - 3-person household (%)
Size of nonfamily households - 4-person household (%)
Size of nonfamily households - 5-person household (%)
Size of nonfamily households - 6-person household (%)
Size of nonfamily households - 7-or-moreperson household (%)
Year house built - Built 2010 or later (%)
Year house built - Built 2000 to 2009 (%)
Year house built - Built 1990 to 1999 (%)
Year house built - Built 1980 to 1989 (%)
Year house built - Built 1970 to 1979 (%)
Year house built - Built 1960 to 1969 (%)
Year house built - Built 1950 to 1959 (%)
Year house built - Built 1940 to 1949 (%)
Year house built - Built 1939 or earlier (%)
Median number of rooms in houses and condos
Median number of rooms in apartments
Median number of bedrooms in owner occupied houses
Mean number of bedrooms in owner occupied houses
Median number of bedrooms in renter occupied houses
Mean number of bedrooms in renter occupied houses
Median number of vehichles in owner occupied houses
Mean number of vehichles in owner occupied houses
Median number of vehichles in renter occupied houses
Mean number of vehichles in renter occupied houses
Rooms in owner-occupied houses - 1 room (%)
Rooms in owner-occupied houses - 2 rooms (%)
Rooms in owner-occupied houses - 3 rooms (%)
Rooms in owner-occupied houses - 4 rooms (%)
Rooms in owner-occupied houses - 5 rooms (%)
Rooms in owner-occupied houses - 6 rooms (%)
Rooms in owner-occupied houses - 7 rooms (%)
Rooms in owner-occupied houses - 8 rooms (%)
Rooms in owner-occupied houses - 9+ rooms (%)
Rooms in renter-occupied houses - 1 room (%)
Rooms in renter-occupied houses - 2 rooms (%)
Rooms in renter-occupied houses - 3 rooms (%)
Rooms in renter-occupied houses - 4 rooms (%)
Rooms in renter-occupied houses - 5 rooms (%)
Rooms in renter-occupied houses - 6 rooms (%)
Rooms in renter-occupied houses - 7 rooms (%)
Rooms in renter-occupied houses - 8 rooms (%)
Rooms in renter-occupied houses - 9+ rooms (%)
Bedrooms in owner-occupied houses - no bedrooms (%)
Bedrooms in owner-occupied houses - 1 bedroom (%)
Bedrooms in owner-occupied houses - 2 bedrooms (%)
Bedrooms in owner-occupied houses - 3 bedrooms (%)
Bedrooms in owner-occupied houses - 4 bedrooms (%)
Bedrooms in owner-occupied houses - 5+ bedrooms (%)
Bedrooms in renter-occupied houses - no bedrooms (%)
Bedrooms in renter-occupied houses - 1 bedroom (%)
Bedrooms in renter-occupied houses - 2 bedrooms (%)
Bedrooms in renter-occupied houses - 3 bedrooms (%)
Bedrooms in renter-occupied houses - 4 bedrooms (%)
Bedrooms in renter-occupied houses - 5+ bedrooms (%)
Vehicles available in owner-occupied houses - no vehicle available (%)
Vehicles available in owner-occupied houses - 1 vehicle available(%)
Vehicles available in owner-occupied houses - 2 Vehicles available (%)
Vehicles available in owner-occupied houses - 3 Vehicles available (%)
Vehicles available in owner-occupied houses - 4 Vehicles available (%)
Vehicles available in owner-occupied houses - 5+ Vehicles available (%)
Vehicles available in renter-occupied houses - no vehicle available (%)
Vehicles available in renter-occupied houses - 1 vehicle available (%)
Vehicles available in renter-occupied houses - 2 Vehicles available (%)
Vehicles available in renter-occupied houses - 3 Vehicles available (%)
Vehicles available in renter-occupied houses - 4 Vehicles available (%)
Vehicles available in renter-occupied houses - 5+ Vehicles available (%)
Housing units in structures - 1, detached (%)
Housing units in structures - 1, attached (%)
Housing units in structures - 2 (%)
Housing units in structures - 3 or 4 (%)
Housing units in structures - 5 to 9 (%)
Housing units in structures - 10 to 19 (%)
Housing units in structures - 20 to 49 (%)
Housing units in structures - 50 or more (%)
Housing units in structures - Mobile home (%)
Housing units in structures - Boat, RV, van, etc. (%)
Housing units in structures - Owners - 1, detached (%)
Housing units in structures - Owners - 1, attached (%)
Housing units in structures - Owners - 2 (%)
Housing units in structures - Owners - 3 or 4 (%)
Housing units in structures - Owners - 5 to 9 (%)
Housing units in structures - Owners - 10 to 19 (%)
Housing units in structures - Owners - 20 to 49 (%)
Housing units in structures - Owners - 50 or more (%)
Housing units in structures - Owners - Mobile home (%)
Housing units in structures - Owners - Boat, RV, van, etc. (%)
Housing units in structures - Renters - 1, detached (%)
Housing units in structures - Renters - 1, attached (%)
Housing units in structures - Renters - 2 (%)
Housing units in structures - Renters - 3 or 4 (%)
Housing units in structures - Renters - 5 to 9 (%)
Housing units in structures - Renters - 10 to 19 (%)
Housing units in structures - Renters - 20 to 49 (%)
Housing units in structures - Renters - 50 or more (%)
Housing units in structures - Renters - Mobile home (%)
Housing units in structures - Renters - Boat, RV, van, etc. (%)
House/condo owner moved in on average (years ago)
Renter moved in on average (years ago)
Year householder moved into unit - Moved in 1999 to March 2000 (%)
Year householder moved into unit - Moved in 1999 to March 2000 (%) - White
Year householder moved into unit - Moved in 1999 to March 2000 (%) - Black or African American
Year householder moved into unit - Moved in 1999 to March 2000 (%) - Asian
Year householder moved into unit - Moved in 1999 to March 2000 (%) - Hispanic or Latino
Year householder moved into unit - Moved in 1999 to March 2000 (%) - American Indian and Alaska Native
Year householder moved into unit - Moved in 1999 to March 2000 (%) - Multirace
Year householder moved into unit - Moved in 1999 to March 2000 (%) - Other Race
Year householder moved into unit - Moved in 1995 to 1998 (%)
Year householder moved into unit - Moved in 1995 to 1998 (%) - White
Year householder moved into unit - Moved in 1995 to 1998 (%) - Black or African American
Year householder moved into unit - Moved in 1995 to 1998 (%) - Asian
Year householder moved into unit - Moved in 1995 to 1998 (%) - Hispanic or Latino
Year householder moved into unit - Moved in 1995 to 1998 (%) - American Indian and Alaska Native
Year householder moved into unit - Moved in 1995 to 1998 (%) - Multirace
Year householder moved into unit - Moved in 1995 to 1998 (%) - Other Race
Year householder moved into unit - Moved in 1990 to 1994 (%)
Year householder moved into unit - Moved in 1990 to 1994 (%) - White
Year householder moved into unit - Moved in 1990 to 1994 (%) - Black or African American
Year householder moved into unit - Moved in 1990 to 1994 (%) - Asian
Year householder moved into unit - Moved in 1990 to 1994 (%) - Hispanic or Latino
Year householder moved into unit - Moved in 1990 to 1994 (%) - American Indian and Alaska Native
Year householder moved into unit - Moved in 1990 to 1994 (%) - Multirace
Year householder moved into unit - Moved in 1990 to 1994 (%) - Other Race
Year householder moved into unit - Moved in 1980 to 1989 (%)
Year householder moved into unit - Moved in 1980 to 1989 (%) - White
Year householder moved into unit - Moved in 1980 to 1989 (%) - Black or African American
Year householder moved into unit - Moved in 1980 to 1989 (%) - Asian
Year householder moved into unit - Moved in 1980 to 1989 (%) - Hispanic or Latino
Year householder moved into unit - Moved in 1980 to 1989 (%) - American Indian and Alaska Native
Year householder moved into unit - Moved in 1980 to 1989 (%) - Multirace
Year householder moved into unit - Moved in 1980 to 1989 (%) - Other Race
Year householder moved into unit - Moved in 1970 to 1979 (%)
Year householder moved into unit - Moved in 1970 to 1979 (%) - White
Year householder moved into unit - Moved in 1970 to 1979 (%) - Black or African American
Year householder moved into unit - Moved in 1970 to 1979 (%) - Asian
Year householder moved into unit - Moved in 1970 to 1979 (%) - Hispanic or Latino
Year householder moved into unit - Moved in 1970 to 1979 (%) - American Indian and Alaska Native
Year householder moved into unit - Moved in 1970 to 1979 (%) - Multirace
Year householder moved into unit - Moved in 1970 to 1979 (%) - Other Race
Year householder moved into unit - Moved in 1969 or earlier (%)
Year householder moved into unit - Moved in 1969 or earlier (%) - White
Year householder moved into unit - Moved in 1969 or earlier (%) - Black or African American
Year householder moved into unit - Moved in 1969 or earlier (%) - Asian
Year householder moved into unit - Moved in 1969 or earlier (%) - Hispanic or Latino
Year householder moved into unit - Moved in 1969 or earlier (%) - American Indian and Alaska Native
Year householder moved into unit - Moved in 1969 or earlier (%) - Multirace
Year householder moved into unit - Moved in 1969 or earlier (%) - Other Race
Housing units lacking complete plumbing facilities (%)
Housing units lacking complete kitchen facilities (%)
House heating fuel used in houses and condos - Utility gas (%)
House heating fuel used in houses and condos - Bottled, tank, or LP gas (%)
House heating fuel used in houses and condos - Electricity (%)
House heating fuel used in houses and condos - Fuel oil, kerosene, etc. (%)
House heating fuel used in houses and condos - Coal or coke (%)
House heating fuel used in houses and condos - Wood (%)
House heating fuel used in houses and condos - Solar energy (%)
House heating fuel used in houses and condos - Other fuel (%)
House heating fuel used in houses and condos - No fuel used (%)
House heating fuel used in apartments - Utility gas (%)
House heating fuel used in apartments - Bottled, tank, or LP gas (%)
House heating fuel used in apartments - Electricity (%)
House heating fuel used in apartments - Fuel oil, kerosene, etc. (%)
House heating fuel used in apartments - Coal or coke (%)
House heating fuel used in apartments - Wood (%)
House heating fuel used in apartments - Solar energy (%)
House heating fuel used in apartments - Other fuel (%)
House heating fuel used in apartments - No fuel used (%)
Latest news about housing in Bartlett, NH collected exclusively by city-data.com from local newspapers, TV, and radio stations
Household type by relationship:
Households: 47,381
In family households: 38,112 (9,462 male householders , 4,107 female householders )
10,988 spouses , 10,875 children (9,957 natural , 313 adopted , 605 stepchildren ), 588 grandchildren , 203 brothers or sisters , 322 parents , foster children , 216 other relatives , 1,138 non-relatives In nonfamily households: 9,269 (3,748 male householders (2,863 living alone )), 3,735 female householders (3,109 living alone )), 1,786 nonrelatives In group quarters: 437 (372 institutionalized population)
6,866 married couples with children. single-parent households (707 men , 1,570 women ).
94.9% of residents of Bartlett speak English at home. of residents speak Spanish at home (100% speak English very well ).of residents speak other Indo-European language at home (80% speak English very well , 8% speak English well , 12% speak English not well ).of residents speak Asian or Pacific Island language at home (100% speak English well ).
Foreign born population: 97 (3.0%)of them are naturalized citizens )
Median number of rooms in houses and condos:
Median number of rooms in apartments
Bartlett, NH household income distribution 5,136 Less than $10,0008,475 $10,000 to $19,9998,485 $20,000 to $29,99911,036 $30,000 to $39,9999,071 $40,000 to $49,9999,797 $50,000 to $59,99914,630 $60,000 to $74,99921,288 $75,000 to $99,99919,951 $100,000 to $124,99916,252 $125,000 to $149,99920,111 $150,000 to $199,99927,997 $200,000 or more
Percentage of workers working in this county: 93.5%Number of people working at home: 290 (17.5% of all workers )
Travel time to work (commute)
Less than 5 minutes: 1825 to 9 minutes: 24910 to 14 minutes: 33615 to 19 minutes: 20120 to 24 minutes: 14825 to 29 minutes: 4630 to 34 minutes: 8135 to 39 minutes: 940 to 44 minutes: 1045 to 59 minutes: 4260 to 89 minutes: 2490 or more minutes: 37
Means of transportation to work:
Drove a car alone: 1,190 (83.6%)Carpooled: 64 (4.5%)Bus or trolley bus : 2 (0.1%)Railroad : 2 (0.1%)Motorcycle: 2 (0.1%)Walked: 80 (5.6%)Other means: 25 (1.8%)Worked at home: 58 (4.1%)
Year of entry for the foreign-born population in Bartlett, New Hampshire
6 1995 to March 2000 7 1990 to 1994 7 1985 to 1989 5 1980 to 1984 8 1975 to 1979 4 1970 to 1974 11 1965 to 1969 21 Before 1965
First ancestries reported:
English: 697 (21.7%)
Irish: 591 (18.4%)
French: 379 (11.8%)
German: 275 (8.6%)
Other: 236 (7.4%)
Italian: 210 (6.5%)
Scottish: 163 (5.1%)
United States: 137 (4.3%)
Polish: 104 (3.2%)
French Canadian: 91 (2.8%)
Scotch-Irish: 82 (2.6%)
Swedish: 76 (2.4%)
Welsh: 26 (0.8%)
Russian: 23 (0.7%)
Dutch: 21 (0.7%)
Norwegian: 20 (0.6%)
Czech: 18 (0.6%)
Portuguese: 18 (0.6%)
Danish: 13 (0.4%)
Greek: 8 (0.2%)
Swiss: 8 (0.2%)
Lithuanian: 5 (0.2%)
Ukrainian: 3 (0.09%)
Arab: 2 (0.06%)
Hungarian: 1 (0.03%) Most common places of birth for foreign-born residents (%): United Kingdom Bartlett:
21.7% (15)New Hampshire:
8.1% (4,396)
Germany Bartlett:
21.7% (15)New Hampshire:
4.9% (2,670)
Poland Bartlett:
18.8% (13)New Hampshire:
1.7% (931)
Other Northern Europe Bartlett:
5.8% (4)New Hampshire:
0.9% (508)
Brazil Bartlett:
5.8% (4)New Hampshire:
2.0% (1,103)
Canada Bartlett:
5.8% (4)New Hampshire:
22.9% (12,397)
Sweden Bartlett:
2.9% (2)New Hampshire:
0.5% (250)
Other Western Europe Bartlett:
2.9% (2)New Hampshire:
0.6% (339)
Czechoslovakia (includes Czech Republic and Slovakia) Bartlett:
2.9% (2)New Hampshire:
0.3% (176)
Other Eastern Europe Bartlett:
2.9% (2)New Hampshire:
1.5% (786)
Korea Bartlett:
2.9% (2)New Hampshire:
2.9% (1,582)
Philippines Bartlett:
2.9% (2)New Hampshire:
1.9% (1,031)
Argentina Bartlett:
2.9% (2)New Hampshire:
0.3% (168)
Place of birth for U.S.-born residents:
This state: 971Other state: 1,681Northeast: 1,436Midwest: 112South: 98West: 35 56% of Bartlett residents lived in the same house 5 years ago.
Out of people who lived in different houses, 55% lived in this county.
Out of people who lived in different counties, 21% lived in New Hampshire.
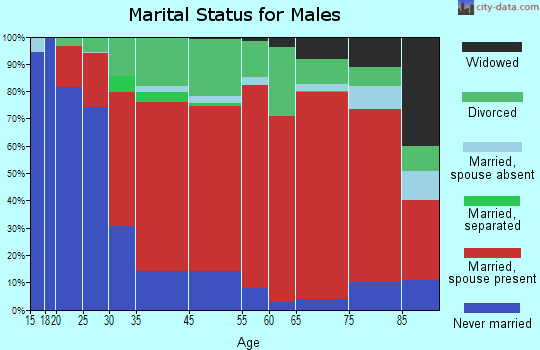
Education attainment for males 25 years and older:
No schooling: 0Nursery to 4th grade: 05th and 6th grade: 07th and 8th grade: 269th grade: 1510th grade: 1511th grade: 1812th grade, no diploma: 53High school graduate (or equivalency): 266Less than 1 year of college: 55Some college more than 1 year, no degree: 141Associate degree: 90Bachelor's degree: 226Master's degree: 72Professional school degree: 10Doctorate degree: 14
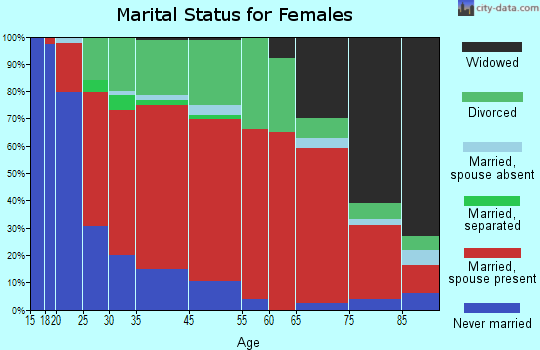
Education attainment for females 25 years and older:
No schooling: 0Nursery to 4th grade: 25th and 6th grade: 27th and 8th grade: 39th grade: 710th grade: 2811th grade: 1912th grade, no diploma: 44High school graduate (or equivalency): 249Less than 1 year of college: 69Some college more than 1 year, no degree: 159Associate degree: 107Bachelor's degree: 193Master's degree: 96Professional school degree: 14Doctorate degree: 7
Housing units in structures:
One, detached: 1,792One, attached: 637Two: 1493 or 4: 2915 to 9: 49110 to 19: 12620 to 49: 65Mobile homes: 62Median worth of mobile homes: $117,072
Housing units lacking complete plumbing facilities: 1.0%Housing units lacking complete kitchen facilities: 1.0%Private vs. public school enrollment:
Students in private schools in grades 1 to 8 (elementary and middle school): 3 Here:
1.0%New Hampshire:
8.9%
Students in private schools in grades 9 to 12 (high school): 12 Here:
8.3%New Hampshire:
10.7%
Students in private undergraduate colleges: 8 Here:
12.7%New Hampshire:
36.4%