Beech Creek, TN (Tennessee) Houses and Residents
| Beech Creek: | $193,502 |
| Tennessee: | $284,800 |
Total population: 3,736 (Urban population: 0, Rural population: 3,518 (329 farm, 3,189 nonfarm))
Houses: 1,578 (1,427 occupied: 1,235 owner occupied, 192 renter occupied)
| % of renters here: | 13% |
| State: | 33% |
Housing density: 21 houses/condos per square mile
Median price asked for vacant for-sale houses and condos in 2022 in this county: $331,302.
Median contract rent in 2022: $540 (lower quartile is $362, upper quartile is $663)
Median gross rent in Beech Creek, TN in 2022: $701
Housing units in Beech Creek with a mortgage: 203 (6 second mortgage, 8 home equity loan, 0 both second mortgage and home equity loan)
Houses without a mortgage: 343


Household type by relationship:
Households: 56,377- In family households: 48,304 (12,203 male householders, 4,196 female householders)
12,672 spouses, 14,933 children (13,385 natural, 503 adopted, 1,045 stepchildren), 1,721 grandchildren, 336 brothers or sisters, 403 parents, foster children, 471 other relatives, 1,054 non-relatives
- In nonfamily households: 8,073 (3,374 male householders (2,800 living alone)), 3,570 female householders (3,222 living alone)), 1,129 nonrelatives
- In group quarters: 456 (all institutionalized)
8,838 married couples with children.
2,546 single-parent households (623 men, 1,923 women).
98.0% of residents of Beech Creek speak English at home.
1.0% of residents speak Spanish at home (62% speak English very well, 38% speak English well).
1.0% of residents speak other Indo-European language at home (58% speak English very well, 24% speak English well, 18% speak English not well).
Foreign born population: 49 (1.2%)
(30.6% of them are naturalized citizens)
| Here: | 6.3 |
| State: | 6.5 |
| Here: | 4.9 |
| State: | 4.4 |

- Bedrooms in owner-occupied houses and condos in Beech Creek, Tennessee
- 3no bedroom
- 341 bedroom
- 3642 bedrooms
- 6963 bedrooms
- 1164 bedrooms
- 225+ bedrooms

- Bedrooms in renter-occupied apartments in Beech Creek, Tennessee
- 0no bedroom
- 61 bedroom
- 962 bedrooms
- 753 bedrooms
- 54 bedrooms
- 105+ bedrooms

- Cars and other vehicles available in Beech Creek in owner-occupied houses/condos
- 92no vehicle
- 3391 vehicle
- 4652 vehicles
- 2473 vehicles
- 784 vehicles
- 145+ vehicles

- Cars and other vehicles available in Beech Creek in renter-occupied apartments
- 10no vehicle
- 871 vehicle
- 802 vehicles
- 153 vehicles
- 04 vehicles
- 05+ vehicles

- Rooms in owner-occupied houses in Beech Creek, Tennessee
- 31 room
- 122 rooms
- 273 rooms
- 1514 rooms
- 4155 rooms
- 3696 rooms
- 1607 rooms
- 678 rooms
- 319+ rooms

- Rooms in renter-occupied apartments in Beech Creek, Tennessee
- 01 room
- 02 rooms
- 63 rooms
- 734 rooms
- 585 rooms
- 306 rooms
- 157 rooms
- 08 rooms
- 109+ rooms


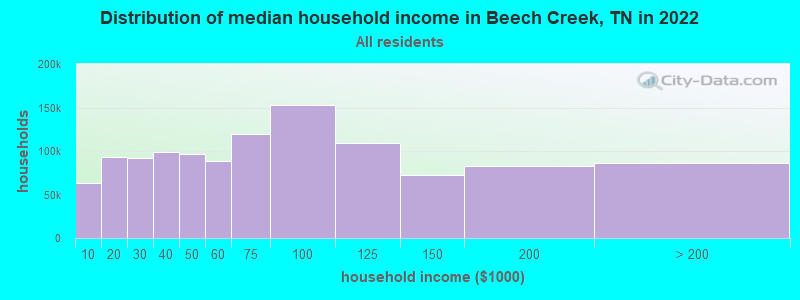
Beech Creek, TN household income distribution

- 41,611Less than $10,000
- 69,794$10,000 to $19,999
- 66,191$20,000 to $29,999
- 67,676$30,000 to $39,999
- 65,435$40,000 to $49,999
- 60,565$50,000 to $59,999
- 82,574$60,000 to $74,999
- 105,250$75,000 to $99,999
- 78,715$100,000 to $124,999
- 46,887$125,000 to $149,999
- 51,462$150,000 to $199,999
- 43,504$200,000 or more
Percentage of workers working in this county: 38.1%
Number of people working at home: 154 (9.8% of all workers)
Travel time to work (commute)
- Less than 5 minutes: 2
- 5 to 9 minutes: 51
- 10 to 14 minutes: 117
- 15 to 19 minutes: 149
- 20 to 24 minutes: 217
- 25 to 29 minutes: 117
- 30 to 34 minutes: 389
- 35 to 39 minutes: 88
- 40 to 44 minutes: 23
- 45 to 59 minutes: 117
- 60 to 89 minutes: 41
- 90 or more minutes: 43
Means of transportation to work:
- Drove a car alone: 1,180 (84.2%)
- Carpooled: 154 (11.0%)
- Walked: 12 (0.9%)
- Other means: 8 (0.6%)
- Worked at home: 47 (3.4%)


- Year of entry for the foreign-born population in Beech Creek, Tennessee
- 01995 to March 2000
- 121990 to 1994
- 01985 to 1989
- 01980 to 1984
- 61975 to 1979
- 01970 to 1974
- 01965 to 1969
- 6Before 1965
Most common places of birth for foreign-born residents (%):
| Beech Creek: | 50.0% (12) |
| Tennessee: | 0.5% (811) |
| Beech Creek: | 25.0% (6) |
| Tennessee: | 5.2% (8,316) |
| Beech Creek: | 25.0% (6) |
| Tennessee: | 4.4% (6,981) |
Place of birth for U.S.-born residents:
- This state: 2,779
- Other state: 697
- Northeast: 144
- Midwest: 125
- South: 382
- West: 46
67% of Beech Creek residents lived in the same house 5 years ago.
Out of people who lived in different houses, 55% lived in this county.
Out of people who lived in different counties, 58% lived in Tennessee.
Education attainment for males 25 years and older:
- No schooling: 29
- Nursery to 4th grade: 32
- 5th and 6th grade: 63
- 7th and 8th grade: 136
- 9th grade: 64
- 10th grade: 69
- 11th grade: 39
- 12th grade, no diploma: 47
- High school graduate (or equivalency): 514
- Less than 1 year of college: 33
- Some college more than 1 year, no degree: 68
- Associate degree: 34
- Bachelor's degree: 79
- Master's degree: 20
- Professional school degree: 7
- Doctorate degree: 0

Education attainment for females 25 years and older:
- No schooling: 19
- Nursery to 4th grade: 11
- 5th and 6th grade: 46
- 7th and 8th grade: 166
- 9th grade: 77
- 10th grade: 24
- 11th grade: 63
- 12th grade, no diploma: 55
- High school graduate (or equivalency): 479
- Less than 1 year of college: 82
- Some college more than 1 year, no degree: 104
- Associate degree: 33
- Bachelor's degree: 73
- Master's degree: 22
- Professional school degree: 15
- Doctorate degree: 0


Housing units in structures:
- One, detached: 1,058
- 5 to 9: 6
- Mobile homes: 514
Median worth of mobile homes: $82,026
Housing units lacking complete kitchen facilities: 6.4%

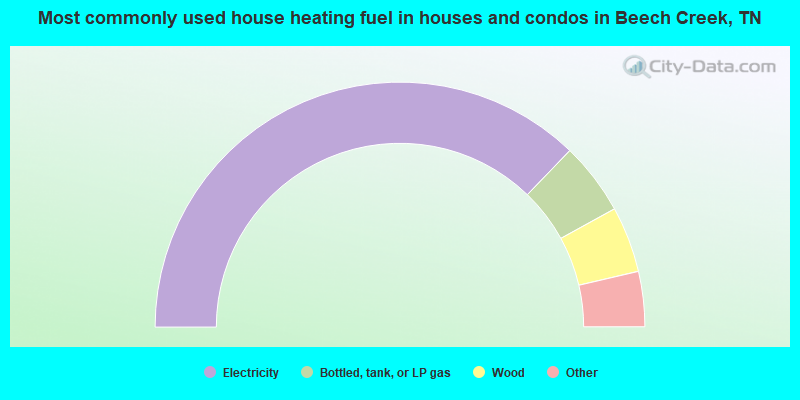
- 74.4%Electricity
- 9.6%Bottled, tank, or LP gas
- 8.7%Wood
- 3.6%Fuel oil, kerosene, etc.
- 2.6%Utility gas
- 0.6%Coal or coke
- 0.5%Other fuel
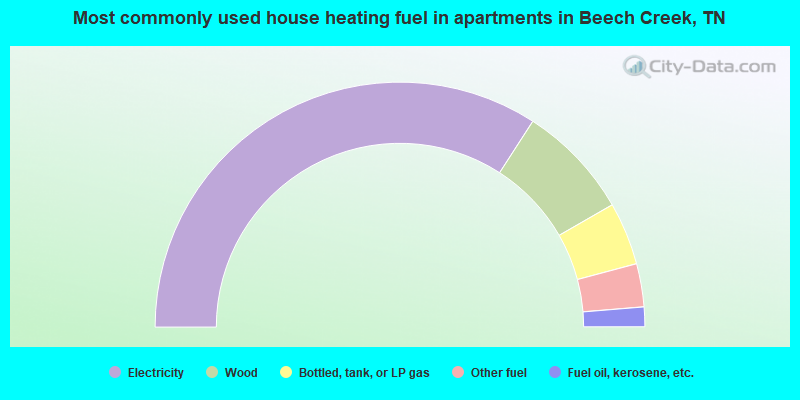
- 68.2%Electricity
- 15.1%Wood
- 8.3%Bottled, tank, or LP gas
- 5.7%Other fuel
- 2.6%Fuel oil, kerosene, etc.
Private vs. public school enrollment:
| Here: | 6.1% |
| Tennessee: | 9.5% |
| Here: | 0.0% |
| Tennessee: | 10.4% |
| Here: | 0.0% |
| Tennessee: | 22.8% |


