Jump to a detailed profile or search site with Google Custom Search

Bellflower, CA (California) Houses and Residents

Estimated median house or condo value in 2022: $671,900 (it was $172,600 in 2000)
Bellflower:

$671,900
California:

$715,900
Lower value quartile - upper value quartile: $540,000 - $832,700

Mean price in 2022:

Detached houses: $796,305
Here:

$796,305
State:

$988,808

Townhouses or other attached units: $530,878
Here:

$530,878
State:

$838,546

In 5-or-more-unit structures: $488,382
Here:

$488,382
State:

$730,996

Mobile homes: $59,333
Here:

$59,333
State:

$184,506

Total population: 78,236 (Urban population: 72,829, Rural population: 0)

Houses: 25,755 (24,984 occupied: 10,013 owner occupied, 14,971 renter occupied)

% of renters here:

60%
State:

44%

Housing density: 4,241 houses/condos per square mile

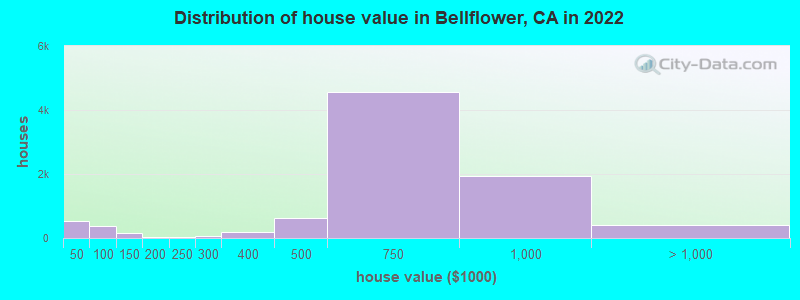
Median price asked for vacant for-sale houses and condos in 2022: $510,001.

Median contract rent in 2022: $1,616 (lower quartile is $1,191, upper quartile is $1,957)


Median rent asked for vacant for-rent units in 2022: $3,134


Median gross rent in Bellflower, CA in 2022: $1,760

Housing units in Bellflower with a mortgage: 6,238 (356 second mortgage, 0 home equity loan, 306 both second mortgage and home equity loan)
Houses without a mortgage: 67

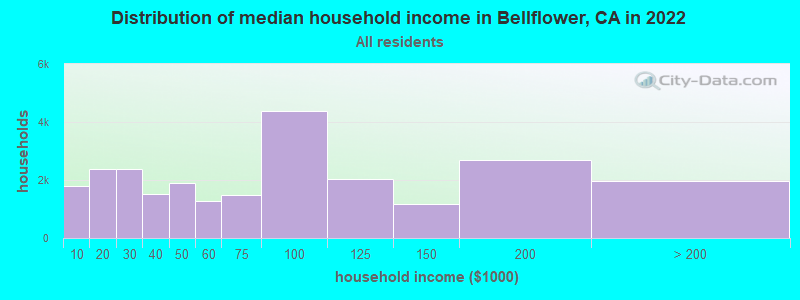
Median household income for houses/condos with a mortgage: $116,802

Median household income for apartments without a mortgage: $52,517

Median monthly housing costs: $1,873

Compare current foreclosures in Bellflower, CA:

Check out more offers in Bellflower, CA.
Powered by Foreclosure.com

Settings
X
Data:
Loading data...
Based on 2000-2020 data
Loading data...

123
Hide US histogram

Latest news about housing in Bellflower, CA collected exclusively by city-data.com from local newspapers, TV, and radio stations

Bellflower, California Age and Sex of Residents
Median year house/condo built: 1959

Median year apartment built: 1968

Household type by relationship:

Households: 76,405
  • Male householders: 11,359 (2,058 living alone), Female householders: 13,625 (3,447 living alone)
  • 10,726 spouses (10,423 opposite-sex spouses), 2,272 unmarried partners, (2,228 opposite-sex unmarried partners), 25,388 children (23,632 natural, 188 adopted, 1,568 stepchildren), 1,433 grandchildren, 2,368 brothers or sisters, 3,052 parents, 0 foster children, 2,348 other relatives, 2,817 non-relatives
  • In group quarters: 1,017

Size of family households: 5,902 2-persons, 3,619 3-persons, 3,946 4-persons, 3,332 5-persons, 581 6-persons, 647 7-or-more-persons.

Size of nonfamily households: 5,505 1-person, 996 2-persons, 158 3-persons, 67 4-persons, 231 6-persons.

8,510 married couples with children.
5,705 single-parent households (541 men, 5,164 women).

43.4% of residents of Bellflower speak English at home.
44.9% of residents speak Spanish at home (65% speak English very well, 17% speak English well, 12% speak English not well, 6% don't speak English at all).
1.6% of residents speak other Indo-European language at home (67% speak English very well, 22% speak English well, 11% speak English not well).
8.3% of residents speak Asian or Pacific Island language at home (57% speak English very well, 22% speak English well, 18% speak English not well, 2% don't speak English at all).
1.5% of residents speak other language at home (73% speak English very well, 10% speak English well, 12% speak English not well, 5% don't speak English at all).

Foreign born population: 20,626 (27.0%)
(54.9% of them are naturalized citizens)

Median number of rooms in houses and condos:
Here:

5.7
State:

6.0

Median number of rooms in apartments
Here:

3.8
State:

3.9

Owner-occupied Renter-occupied
Bedrooms in owner-occupied houses and condos in Bellflower, California
  • Bedrooms in owner-occupied houses and condos in Bellflower, California
  • 134no bedroom
  • 2901 bedroom
  • 2,4272 bedrooms
  • 5,4983 bedrooms
  • 1,3814 bedrooms
  • 2835+ bedrooms
Bedrooms in renter-occupied apartments in Bellflower, California
  • Bedrooms in renter-occupied apartments in Bellflower, California
  • 1,259no bedroom
  • 4,4331 bedroom
  • 5,8562 bedrooms
  • 2,9583 bedrooms
  • 4654 bedrooms
  • 05+ bedrooms
Owner-occupied Renter-occupied
Cars and other vehicles available in Bellflower in owner-occupied houses/condos
  • Cars and other vehicles available in Bellflower in owner-occupied houses/condos
  • 176no vehicle
  • 2,2421 vehicle
  • 3,4462 vehicles
  • 2,5663 vehicles
  • 8844 vehicles
  • 6995+ vehicles
Cars and other vehicles available in Bellflower in renter-occupied apartments
  • Cars and other vehicles available in Bellflower in renter-occupied apartments
  • 1,103no vehicle
  • 5,8091 vehicle
  • 4,6972 vehicles
  • 2,5333 vehicles
  • 5764 vehicles
  • 2535+ vehicles
Owner-occupied Renter-occupied
Rooms in owner-occupied houses in Bellflower, California
  • Rooms in owner-occupied houses in Bellflower, California
  • 1341 room
  • 2462 rooms
  • 3803 rooms
  • 1,3454 rooms
  • 2,4005 rooms
  • 2,2456 rooms
  • 2,1777 rooms
  • 5678 rooms
  • 5199+ rooms
Rooms in renter-occupied apartments in Bellflower, California
  • Rooms in renter-occupied apartments in Bellflower, California
  • 1,2141 room
  • 1,8192 rooms
  • 2,8073 rooms
  • 5,1374 rooms
  • 2,2195 rooms
  • 1,1836 rooms
  • 3847 rooms
  • 2088 rooms
  • 09+ rooms
Year house built
Median 2022 house/condo value by year built
Median house/condo value by year householder moved into unit
Breakdown of mean house values by ages of householders
Owners and renters by unit type in Bellflower, CA
  • Bellflower, CA household income distribution

  • Distribution of median household income in Bellflower, CA in 2022
  • 1,780Less than $10,000
  • 2,374$10,000 to $19,999
  • 2,384$20,000 to $29,999
  • 1,508$30,000 to $39,999
  • 1,902$40,000 to $49,999
  • 1,291$50,000 to $59,999
  • 1,466$60,000 to $74,999
  • 4,369$75,000 to $99,999
  • 2,040$100,000 to $124,999
  • 1,184$125,000 to $149,999
  • 2,705$150,000 to $199,999
  • 1,981$200,000 or more
  • Home value of owner - occupied houses in 2022 in Bellflower, CA

  • Distribution of house value in Bellflower, CA in 2022
  • 309Less than $10,000
  • 13$10,000 to $14,999
  • 11$15,000 to $19,999
  • 49$20,000 to $24,999
  • 67$25,000 to $29,999
  • 49$30,000 to $34,999
  • 7$35,000 to $39,999
  • 34$40,000 to $49,999
  • 40$50,000 to $59,999
  • 54$60,000 to $69,999
  • 80$70,000 to $79,999
  • 127$80,000 to $89,999
  • 35$90,000 to $99,999
  • 123$100,000 to $124,999
  • 37$125,000 to $149,999
  • 28$150,000 to $174,999
  • 18$200,000 to $249,999
  • 66$250,000 to $299,999
  • 183$300,000 to $399,999
  • 625$400,000 to $499,999
  • 4,565$500,000 to $749,999
  • 1,921$750,000 to $999,999
  • 311$1,000,000 to $1,499,999
  • 31$1,500,000 to $1,999,999
  • 69$2,000,000 or more
  • Rent paid by renters in 2022 in Bellflower, CA

  • Distribution of rent paid by renters in Bellflower, CA in 2022
  • 8Less than $100
  • 6$100 to $149
  • 99$150 to $199
  • 30$200 to $249
  • 93$250 to $299
  • 53$300 to $349
  • 55$350 to $399
  • 50$400 to $449
  • 83$450 to $499
  • 87$500 to $549
  • 14$550 to $599
  • 84$600 to $649
  • 44$650 to $699
  • 106$700 to $749
  • 84$750 to $799
  • 369$800 to $899
  • 619$900 to $999
  • 2,404$1,000 to $1,249
  • 2,162$1,250 to $1,499
  • 5,574$1,500 to $1,999
  • 2,126$2,000 to $2,499
  • 554$2,500 to $2,999
  • 124$3,000 to $3,499
  • 42$3,500 or more
  • 193No cash rent
Time Leaving Home To Go To Work in 2022

Percentage of workers working in this county: 86.5%
Number of people working at home: 3,820 (10.4% of all workers)

Travel time (in minutes) to work in 2022

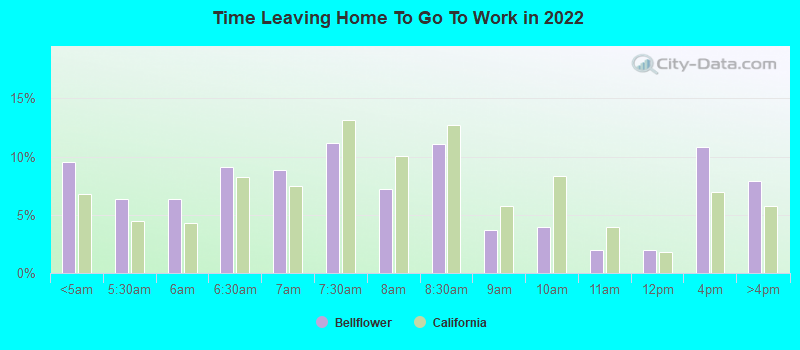
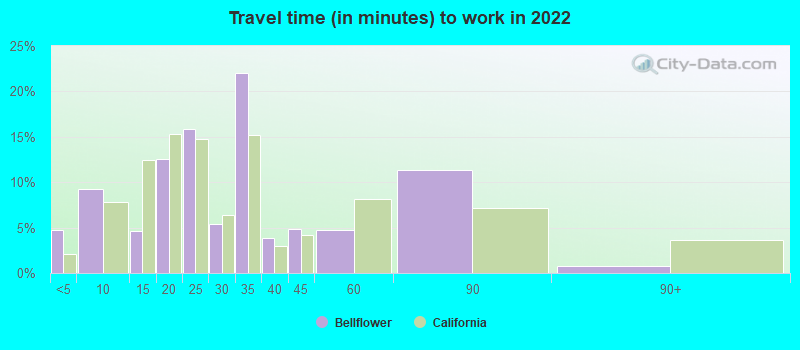
Travel time to work (commute)

  • Less than 5 minutes: 650
  • 5 to 9 minutes: 2,299
  • 10 to 14 minutes: 3,403
  • 15 to 19 minutes: 4,229
  • 20 to 24 minutes: 4,261
  • 25 to 29 minutes: 2,401
  • 30 to 34 minutes: 5,670
  • 35 to 39 minutes: 662
  • 40 to 44 minutes: 1,237
  • 45 to 59 minutes: 3,181
  • 60 to 89 minutes: 2,573
  • 90 or more minutes: 477
Means of transportation to work in 2022 - Bellflower

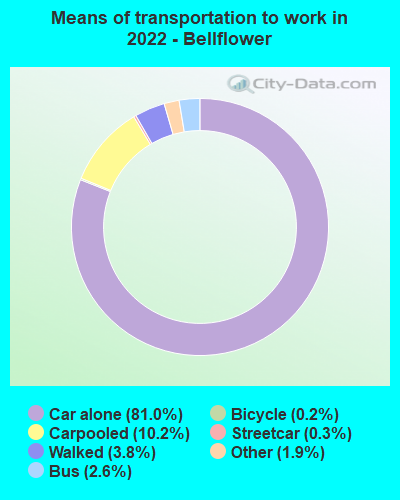
Means of transportation to work:

  • Drove a car alone: 8,831 (61.1%)
  • Carpooled: 1,229 (8.5%)
  • Bus: 261 (1.8%)
  • Subway or elevated rail: 22 (0.2%)
  • Taxi: 224 (1.6%)
  • Bicycle: 24 (0.2%)
  • Walked: 442 (3.1%)
  • Worked at home: 3,820 (26.4%)
Class of Workers in 2022
  • Unemployment by race in 2022
  • Unemployment rate for White non-Hispanic residents
  • 1.5%Males
  • 4.2%Females
  • Unemployment rate for Black residents
  • 12.7%Males
  • 4.6%Females
  • Unemployment rate for American Indian and Alaska Native residents
  • 1.9%Males
  • 33.0%Females
  • Unemployment rate for Asian residents
  • 7.2%Males
  • 4.1%Females
  • Unemployment rate for other race residents
  • 14.9%Males
  • 5.1%Females
  • Unemployment rate for two or more race residents
  • 7.1%Males
  • 5.3%Females
  • Unemployment rate for Hispanic or Latino residents
  • 10.9%Males
  • 7.8%Females
Year of entry for the foreign-born population in Bellflower, California
  • Year of entry for the foreign-born population in Bellflower, California
  • 4,3002010 or later
  • 4,6172000 to 2009
  • 4,3661990 to 1999
  • 7,4421980 to 1989
  • 4,3211970 to 1979
  • 2,064Before 1970
Ancestries in Bellflower, CA

First ancestries reported:

  • German: 846 (1.6%)
  • Nigerian: 738 (1.4%)
  • American: 664 (1.3%)
  • English: 418 (0.8%)
  • Irish: 384 (0.7%)
  • Italian: 368 (0.7%)
  • Dutch: 362 (0.7%)
  • European: 287 (0.5%)
  • African: 281 (0.5%)
  • Egyptian: 251 (0.5%)
  • Lebanese: 171 (0.3%)
  • West Indian: 135 (0.3%)
  • Polish: 63 (0.1%)
  • Scottish: 60 (0.1%)
  • French: 59 (0.1%)
  • Portuguese: 56 (0.1%)
  • Romanian: 55 (0.1%)
  • Norwegian: 52 (0.10%)
  • French Canadian: 45 (0.09%)
  • Belizean: 45 (0.09%)
  • Jamaican: 43 (0.08%)
  • Eastern European: 39 (0.07%)
  • Trinidadian and Tobagonian: 36 (0.07%)
  • Croatian: 25 (0.05%)
  • Yugoslavian: 21 (0.04%)
  • Bahamian: 19 (0.04%)
  • Scotch-Irish: 16 (0.03%)
  • Basque: 15 (0.03%)
  • British: 14 (0.03%)
  • Greek: 12 (0.02%)
  • Armenian: 11 (0.02%)
  • Hungarian: 10 (0.02%)
  • Danish: 9 (0.02%)
  • Swedish: 9 (0.02%)
  • Slavic: 7 (0.01%)
  • Arab: 5 (0.01%)
  • Austrian: 5 (0.01%)
  • Russian: 5 (0.01%)
  • Slovak: 5 (0.01%)
  • Iranian: 4 (0.01%)
  • Icelander: 4 (0.01%)

Most common places of birth for foreign-born residents (%):

Mexico
Bellflower:

51.3% (11,484)
California:

37.2% (3,881,193)

Philippines
Bellflower:

13.5% (3,027)
California:

7.8% (818,297)

El Salvador
Bellflower:

4.5% (1,019)
California:

4.2% (440,287)

Guatemala
Bellflower:

3.7% (826)
California:

2.8% (290,436)

Cambodia
Bellflower:

3.1% (689)
California:

0.5% (51,974)

Korea
Bellflower:

2.8% (618)
California:

3.0% (315,248)

Nigeria
Bellflower:

2.3% (505)
California:

0.3% (35,557)

Vietnam
Bellflower:

1.8% (404)
California:

4.9% (512,335)

Place of birth for U.S.-born residents:

  • This state: 49,120
  • Other state: 5,033
  • Northeast: 656
  • Midwest: 2,574
  • South: 986
  • West: 817

91.7% of Bellflower residents lived in the same house 1 years ago.
   Out of people who lived in different houses, 45.2% lived in this county.
   Out of people who lived in different counties, 52.0% lived in California.


Bellflower:

91.7%
State average:

88.9%

Education attainment for males 25 years and older:

  • No schooling: 1,633
  • Nursery to 4th grade: 288
  • 5th and 6th grade: 506
  • 7th and 8th grade: 68
  • 9th grade: 497
  • 10th grade: 814
  • 11th grade: 552
  • 12th grade, no diploma: 1,302
  • High school graduate (or equivalency): 6,226
  • Less than 1 year of college: 1,710
  • Some college more than 1 year, no degree: 3,698
  • Associate degree: 1,236
  • Bachelor's degree: 3,897
  • Master's degree: 1,804
  • Professional school degree: 112
  • Doctorate degree: 47
Educational Attainment for Males

Education attainment for females 25 years and older:

  • No schooling: 2,068
  • Nursery to 4th grade: 824
  • 5th and 6th grade: 404
  • 7th and 8th grade: 593
  • 9th grade: 397
  • 10th grade: 405
  • 11th grade: 149
  • 12th grade, no diploma: 970
  • High school graduate (or equivalency): 6,500
  • Less than 1 year of college: 1,048
  • Some college more than 1 year, no degree: 5,599
  • Associate degree: 2,326
  • Bachelor's degree: 4,081
  • Master's degree: 2,385
  • Professional school degree: 375
  • Doctorate degree: 44
Educational Attainment for Females
Bellflower marital status for males
Bellflower marital status for females

Housing units in structures:

  • One, detached: 13,618
  • One, attached: 2,205
  • Two: 320
  • 3 or 4: 902
  • 5 to 9: 1,413
  • 10 to 19: 841
  • 20 to 49: 2,077
  • 50 or more: 3,169
  • Mobile homes: 1,210

Median worth of mobile homes: $73,285

Housing units lacking complete plumbing facilities in 2022: 0.2%

Housing units lacking complete kitchen facilities in 2022: 2.1%

House/condo owner moved in on average 16 years ago

Renter moved in on average 5 years ago

Year householders moved into residence in Bellflower
Houses and condos Apartments
Most commonly used house heating fuel in houses and condos in Bellflower, CA
  • 66.3%Utility gas
  • 25.6%Electricity
  • 5.0%No fuel used
  • 1.7%Bottled, tank, or LP gas
  • 0.8%Solar energy
  • 0.6%Wood
Most commonly used house heating fuel in apartments in Bellflower, CA
  • 52.5%Utility gas
  • 35.3%Electricity
  • 10.3%No fuel used
  • 1.1%Bottled, tank, or LP gas
  • 0.6%Fuel oil, kerosene, etc.
  • 0.1%Other fuel

Private vs. public school enrollment:

Students in private schools in grades 1 to 8 (elementary and middle school): 665
Here:

8.4%
California:

10.5%

Students in private schools in grades 9 to 12 (high school): 254
Here:

6.9%
California:

8.5%

Students in private undergraduate colleges: 571
Here:

10.8%
California:

15.9%
School Enrollment by Level of School for Male Students
School Enrollment by Level of School for Female Students
Age and Sex of Sensory-Disabled Noninstitutionalized Residents
Age and Sex of Physically-Disabled Noninstitutionalized Residents
Age and Sex of Mentally-Disabled Noninstitutionalized Residents
Age and Sex of Self-Care Disabled Noninstitutionalized Residents
Age and Sex of Go-Outside-Home Disabled Noninstitutionalized Residents
Age and Sex of Noninstitutionalized Residents with Employment Disability