Bellmead, TX (Texas) Houses and Residents
| Bellmead: | $135,001 |
| Texas: | $275,400 |
Total population: 10,184 (Urban population: 8,907, Rural population: 168 (all nonfarm))
Houses: 4,000 (3,631 occupied: 2,001 owner occupied, 1,546 renter occupied)
| % of renters here: | 44% |
| State: | 38% |
Housing density: 642 houses/condos per square mile
Median price asked for vacant for-sale houses and condos in 2022: $381,655.
Median contract rent in 2022: $792 (lower quartile is $636, upper quartile is $974)
Median rent asked for vacant for-rent units in 2022: $505
Median gross rent in Bellmead, TX in 2022: $1,050
Housing units in Bellmead with a mortgage: 1,106 (0 second mortgage, 0 home equity loan, 0 both second mortgage and home equity loan)
Houses without a mortgage: 28
Median household income for houses/condos with a mortgage: $70,169
Median household income for apartments without a mortgage: $50,447
Median monthly housing costs: $953
Compare current foreclosures near Bellmead, TX:
| Photo | Address | Area | Beds / Baths | Price | Details |
|---|---|---|---|---|---|

|
#1
Cranbrook Dr
Wac-Woodway, TX 76712
|
1,888 sq. feet
|
2 baths 3 beds |
$319,900
|
show details |

|
#2
Lux Dr
Waco, TX 76706
|
1,745 sq. feet
|
2 baths 4 beds |
$182,000
|
show details |

|
#3
Bosque Bend Ln
China Spring, TX 76633
|
1,592 sq. feet
|
2 baths 3 beds |
$210,000
|
show details |

|
#4
Woodland Dr
Lorena, TX 76655
|
- sq. feet
|
3 baths 4 beds |
show details | |

|
#5
N 40th St
Waco, TX 76707
|
- sq. feet
|
1 baths 2 beds |
show details | |

|
#6
Hood St
Waco, TX 76704
|
1,077 sq. feet
|
1 baths 3 beds |
show details | |

|
#7
Haden Dr
Waco, TX 76710
|
1,360 sq. feet
|
2 baths 3 beds |
show details | |

|
#8
Old Marlin Rd
Waco, TX 76705
|
1,502 sq. feet
|
1 baths 3 beds |
show details | |

|
#9
Avenue I
Waco, TX 76705
|
1,584 sq. feet
|
3 baths 3 beds |
show details | |

|
#10
Beckon Fls
Waco, TX 76708
|
1,561 sq. feet
|
3 baths 3 beds |
show details |
| Photo | Address | Area | Beds / Baths | Price | Details |
|---|---|---|---|---|---|

|
#11
Alexander Ave
Waco, TX 76708
|
1,428 sq. feet
|
2 baths 2 beds |
show details | |

|
#12
Beckon Falls
Waco, TX 76708
|
1,561 sq. feet
|
2 baths 3 beds |
show details | |

|
#13
Elmwood Dr
Wac-Woodway, TX 76712
|
1,148 sq. feet
|
1 baths 2 beds |
show details | |

|
#14
Blackwell St
Waco, TX 76705
|
1,481 sq. feet
|
2 baths 3 beds |
show details | |

|
#15
Elmwood Dr
Wac-Woodway, TX 76712
|
1,148 sq. feet
|
1 baths 2 beds |
show details | |

|
#16
Camp Ground Rd
Waco, TX 76705
|
1,200 sq. feet
|
1 baths 2 beds |
show details | |

|
#17
Darden Dr
Waco, TX 76706
|
1,756 sq. feet
|
2 baths 3 beds |
show details | |

|
#18
Durango Trl
Wac-Woodway, TX 76712
|
1,759 sq. feet
|
2 baths 3 beds |
show details | |

|
#19
N 22nd St
Waco, TX 76708
|
1,160 sq. feet
|
1 baths 3 beds |
show details | |

|
#20
Glasgow Dr
Waco, TX 76710
|
2,271 sq. feet
|
2 baths 4 beds |
show details |
| Photo | Address | Area | Beds / Baths | Price | Details |
|---|---|---|---|---|---|

|
#21
Marquita St
Waco, TX 76711
|
1,141 sq. feet
|
1 baths 3 beds |
show details | |

|
#22
Lake Haven Dr
Waco, TX 76710
|
1,836 sq. feet
|
2 baths 3 beds |
show details | |

|
#23
Glenleigh Dr
Hewitt, TX 76643
|
1,406 sq. feet
|
2 baths 3 beds |
show details | |

|
#24
Cedarwood Ln
Hewitt, TX 76643
|
1,931 sq. feet
|
2 baths 3 beds |
show details | |

|
#25
Haden Dr
Waco, TX 76710
|
1,642 sq. feet
|
1 baths 3 beds |
show details | |

|
#26
Serena Ln
Wac-Woodway, TX 76712
|
1,947 sq. feet
|
2 baths 4 beds |
show details | |

|
#27
White Hall Rd
Wac-Woodway, TX 76712
|
2,120 sq. feet
|
2 baths 4 beds |
show details | |

|
#28
Country Aire Dr
Waco, TX 76708
|
1,899 sq. feet
|
2 baths 3 beds |
show details | |

|
#29
Mount Moriah Rd
Riesel, TX 76682
|
1,708 sq. feet
|
2 baths - beds |
show details | |

|
#30
Eagles Nest Dr
Hewitt, TX 76643
|
1,593 sq. feet
|
2 baths 3 beds |
show details |
| Photo | Address | Area | Beds / Baths | Price | Details |
|---|---|---|---|---|---|

|
#31
Granite Ln
Lorena, TX 76655
|
2,871 sq. feet
|
3 baths 4 beds |
show details | |

|
#32
Rosa Ln
China Spring, TX 76633
|
1,188 sq. feet
|
1 baths - beds |
show details | |

|
#33
N Barbara St
Waco, TX 76705
|
1,496 sq. feet
|
2 baths 3 beds |
show details | |

|
#34
Dossett St
Waco, TX 76705
|
1,668 sq. feet
|
1 baths 3 beds |
show details | |

|
#35
Avenue G
Waco, TX 76705
|
1,461 sq. feet
|
2 baths 3 beds |
show details | |

|
#36
Garrison St
Waco, TX 76704
|
1,244 sq. feet
|
1 baths 3 beds |
show details | |

|
#37
N 30th St
Waco, TX 76707
|
1,506 sq. feet
|
1 baths 3 beds |
show details | |

|
#38
Colonial Ave
Waco, TX 76710
|
1,328 sq. feet
|
2 baths - beds |
show details | |

|
#39
W Jade Dr
Hewitt, TX 76643
|
1,544 sq. feet
|
- baths 3 beds |
show details | |

|
#40
Ute Trl
Hewitt, TX 76643
|
2,103 sq. feet
|
- baths 4 beds |
show details |
| Photo | Address | Area | Beds / Baths | Price | Details |
|---|---|---|---|---|---|

|
#41
Tom Mccartney Ln
Waco, TX 76705
|
1,487 sq. feet
|
2 baths - beds |
show details | |

|
#42
E Stegall Rd
Waco, TX 76706
|
1,695 sq. feet
|
1 baths - beds |
show details | |

|
#43
Hubby Ave
Waco, TX 76710
|
1,648 sq. feet
|
2 baths - beds |
show details | |

|
#44
N New Rd
Waco, TX 76710
|
1,492 sq. feet
|
1 baths - beds |
show details | |

|
#45
N Walnut St
Waco, TX 76705
|
2,029 sq. feet
|
2 baths - beds |
show details | |

|
#46
S Hedwig St
Riesel, TX 76682
|
1,612 sq. feet
|
2 baths - beds |
show details | |

|
#47
Memorial Dr
Waco, TX 76711
|
922 sq. feet
|
1 baths - beds |
show details | |

|
#48
Paradise Island Rd
Waco, TX 76705
|
1,161 sq. feet
|
2 baths - beds |
show details | |

|
#49
Mahalia Dr
Waco, TX 76705
|
2,647 sq. feet
|
2 baths - beds |
show details | |

|
Check over 1 million property listings on Foreclosure.com!
|
browse all offers | |||

Latest news about housing in Bellmead, TX collected exclusively by city-data.com from local newspapers, TV, and radio stations

 | Help with relocating to Texas (14 replies) |
| Relocation to Tx help (6 replies) |
| Why is Waco hated so much? (430 replies) |
| Waco info-update from a newcomer (29 replies) |
| Friendly factor in Waco Midway ISD neighborhoods (3 replies) |
| Where to move in Waco (8 replies) |

Median year apartment built: 1984
Household type by relationship:
Households: 10,710- Male householders: 1,656 (410 living alone), Female householders: 1,979 (414 living alone)
1,510 spouses (1,510 opposite-sex spouses), 259 unmarried partners, (234 opposite-sex unmarried partners), 4,059 children (3,890 natural, 16 adopted, 152 stepchildren), 544 grandchildren, 151 brothers or sisters, 165 parents, 0 foster children, 74 other relatives, 286 non-relatives
- In group quarters: 22
Size of family households: 716 2-persons, 670 3-persons, 361 4-persons, 408 5-persons, 148 6-persons, 115 7-or-more-persons.
Size of nonfamily households: 757 1-person, 358 2-persons, 6 3-persons.
1,997 married couples with children.
692 single-parent households (24 men, 668 women).
57.9% of residents of Bellmead speak English at home.
37.1% of residents speak Spanish at home (50% speak English very well, 31% speak English well, 9% speak English not well, 10% don't speak English at all).
2.3% of residents speak other Indo-European language at home (34% speak English very well, 66% speak English well).
2.2% of residents speak Asian or Pacific Island language at home (72% speak English very well, 28% speak English well).
Foreign born population: 2,276 (21.3%)
(7.1% of them are naturalized citizens)
| Here: | 5.6 |
| State: | 6.3 |
| Here: | 4.5 |
| State: | 4.0 |

- Bedrooms in owner-occupied houses and condos in Bellmead, Texas
- 75no bedroom
- 421 bedroom
- 4462 bedrooms
- 1,2743 bedrooms
- 1394 bedrooms
- 275+ bedrooms

- Bedrooms in renter-occupied apartments in Bellmead, Texas
- 39no bedroom
- 1761 bedroom
- 7752 bedrooms
- 5573 bedrooms
- 04 bedrooms
- 05+ bedrooms

- Cars and other vehicles available in Bellmead in owner-occupied houses/condos
- 137no vehicle
- 4651 vehicle
- 7032 vehicles
- 5323 vehicles
- 1494 vehicles
- 175+ vehicles

- Cars and other vehicles available in Bellmead in renter-occupied apartments
- 20no vehicle
- 8911 vehicle
- 1892 vehicles
- 4473 vehicles
- 04 vehicles
- 05+ vehicles

- Rooms in owner-occupied houses in Bellmead, Texas
- 751 room
- 422 rooms
- 483 rooms
- 1464 rooms
- 5565 rooms
- 6986 rooms
- 3037 rooms
- 988 rooms
- 369+ rooms

- Rooms in renter-occupied apartments in Bellmead, Texas
- 321 room
- 602 rooms
- 2473 rooms
- 3734 rooms
- 6455 rooms
- 1546 rooms
- 227 rooms
- 148 rooms
- 09+ rooms


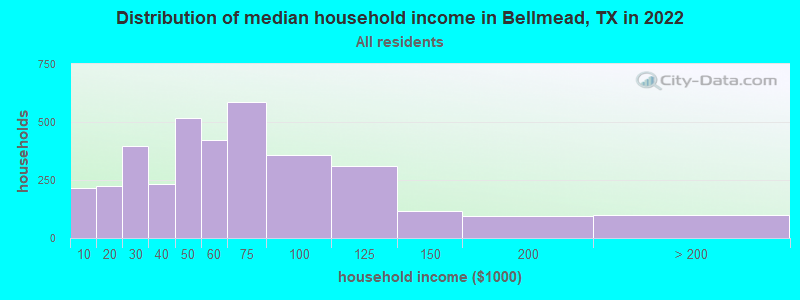
Bellmead, TX household income distribution

- 216Less than $10,000
- 226$10,000 to $19,999
- 396$20,000 to $29,999
- 232$30,000 to $39,999
- 519$40,000 to $49,999
- 422$50,000 to $59,999
- 586$60,000 to $74,999
- 357$75,000 to $99,999
- 309$100,000 to $124,999
- 117$125,000 to $149,999
- 96$150,000 to $199,999
- 98$200,000 or more
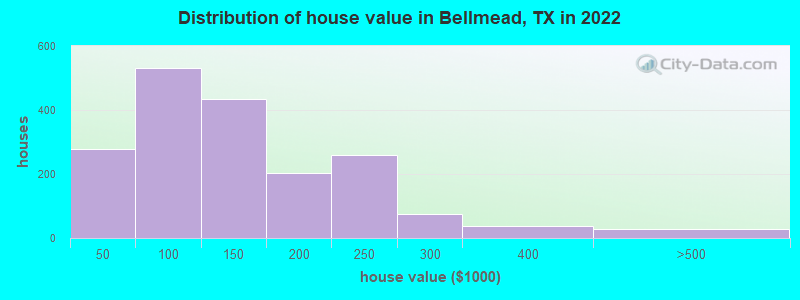
Home value of owner - occupied houses in 2022 in Bellmead, TX
-
- 42Less than $10,000
- 21$10,000 to $14,999
- 9$15,000 to $19,999
- 21$20,000 to $24,999
- 44$25,000 to $29,999
- 51$30,000 to $34,999
- 37$35,000 to $39,999
- 49$40,000 to $49,999
- 31$50,000 to $59,999
- 131$60,000 to $69,999
- 104$70,000 to $79,999
- 183$80,000 to $89,999
- 29$90,000 to $99,999
- 259$100,000 to $124,999
- 174$125,000 to $149,999
- 120$150,000 to $174,999
- 82$175,000 to $199,999
- 258$200,000 to $249,999
- 74$250,000 to $299,999
- 35$300,000 to $399,999
- 28$400,000 to $499,999
Rent paid by renters in 2022 in Bellmead, TX
-
- 28$200 to $249
- 28$250 to $299
- 27$300 to $349
- 18$400 to $449
- 38$500 to $549
- 157$550 to $599
- 94$600 to $649
- 37$650 to $699
- 158$700 to $749
- 57$750 to $799
- 205$800 to $899
- 125$900 to $999
- 108$1,000 to $1,249
- 117No cash rent


Percentage of workers working in this county: 88.2%
Number of people working at home: 262 (6.1% of all workers)
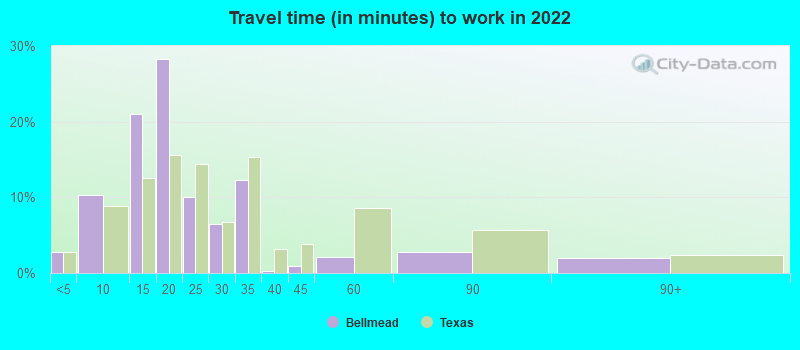
Travel time to work (commute)
- Less than 5 minutes: 275
- 5 to 9 minutes: 438
- 10 to 14 minutes: 630
- 15 to 19 minutes: 665
- 20 to 24 minutes: 678
- 25 to 29 minutes: 262
- 30 to 34 minutes: 401
- 35 to 39 minutes: 0
- 40 to 44 minutes: 84
- 45 to 59 minutes: 215
- 60 to 89 minutes: 106
- 90 or more minutes: 213

Means of transportation to work:
- Drove a car alone: 2,483 (78.8%)
- Carpooled: 330 (10.5%)
- Taxi: 39 (1.2%)
- Worked at home: 262 (8.3%)

- Unemployment by race in 2022
- Unemployment rate for White non-Hispanic residents
- 8.1%Males
- Unemployment rate for other race residents
- 6.0%Males
- Unemployment rate for two or more race residents
- 0.5%Males
- Unemployment rate for Hispanic or Latino residents
- 1.1%Males

- Year of entry for the foreign-born population in Bellmead, Texas
- 1,3522010 or later
- 4152000 to 2009
- 6561990 to 1999
- 1541980 to 1989
- 1151970 to 1979
- 42Before 1970
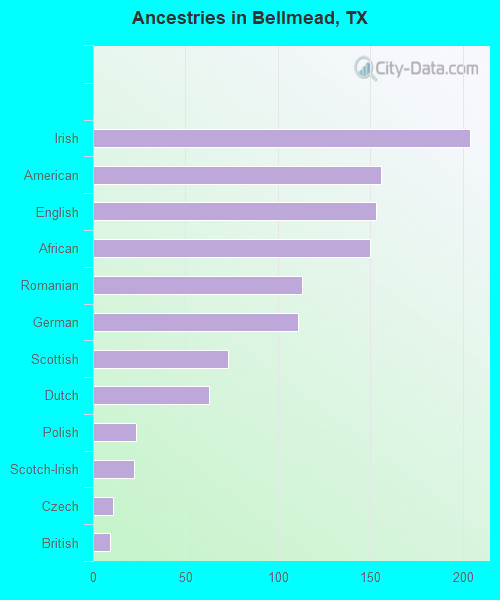
First ancestries reported:
- Irish: 204 (2.9%)
- American: 156 (2.2%)
- English: 153 (2.2%)
- African: 150 (2.1%)
- Romanian: 113 (1.6%)
- German: 111 (1.6%)
- Scottish: 73 (1.0%)
- Dutch: 63 (0.9%)
- Polish: 23 (0.3%)
- Scotch-Irish: 22 (0.3%)
- Czech: 11 (0.2%)
- British: 9 (0.1%)
Most common places of birth for foreign-born residents (%):
| Bellmead: | 79.9% (1,893) |
| Texas: | 48.4% (2,411,723) |
| Bellmead: | 8.4% (198) |
| Texas: | 3.7% (184,770) |
| Bellmead: | 4.9% (116) |
| Texas: | 0.1% (6,849) |
Place of birth for U.S.-born residents:
- This state: 6,395
- Other state: 1,744
- Northeast: 76
- Midwest: 349
- South: 1,022
- West: 300
88.0% of Bellmead residents lived in the same house 1 years ago.
Out of people who lived in different houses, 47.9% lived in this county.
Out of people who lived in different counties, 77.9% lived in Texas.
| Bellmead: | 88.0% |
| State average: | 85.7% |
Education attainment for males 25 years and older:
- No schooling: 80
- Nursery to 4th grade: 0
- 5th and 6th grade: 77
- 7th and 8th grade: 101
- 9th grade: 158
- 10th grade: 206
- 11th grade: 45
- 12th grade, no diploma: 213
- High school graduate (or equivalency): 720
- Less than 1 year of college: 173
- Some college more than 1 year, no degree: 341
- Associate degree: 292
- Bachelor's degree: 325
- Master's degree: 74
- Professional school degree: 0
- Doctorate degree: 0

Education attainment for females 25 years and older:
- No schooling: 24
- Nursery to 4th grade: 18
- 5th and 6th grade: 121
- 7th and 8th grade: 120
- 9th grade: 118
- 10th grade: 11
- 11th grade: 45
- 12th grade, no diploma: 0
- High school graduate (or equivalency): 1,215
- Less than 1 year of college: 278
- Some college more than 1 year, no degree: 734
- Associate degree: 170
- Bachelor's degree: 354
- Master's degree: 214
- Professional school degree: 50
- Doctorate degree: 0


Housing units in structures:
- One, detached: 2,545
- One, attached: 37
- Two: 126
- 3 or 4: 114
- 5 to 9: 274
- 10 to 19: 156
- 50 or more: 7
- Mobile homes: 711
- Boats, RVs, vans, etc.: 27
Median worth of mobile homes: $90,401
Housing units lacking complete kitchen facilities in 2022: 2.0%
House/condo owner moved in on average 9 years ago
Renter moved in on average 6 years ago

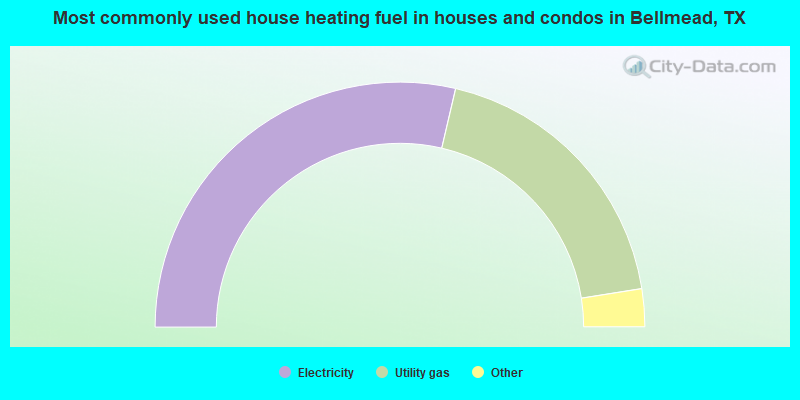
- 57.3%Electricity
- 37.7%Utility gas
- 3.0%Bottled, tank, or LP gas
- 1.9%Other fuel
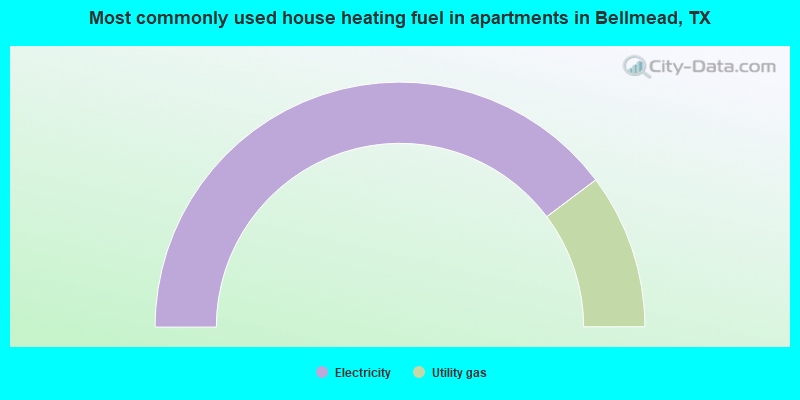
- 79.5%Electricity
- 20.5%Utility gas
Private vs. public school enrollment:
| Here: | 0.0% |
| Texas: | 8.8% |
| Here: | 0.0% |
| Texas: | 8.0% |
| Here: | 14.6% |
| Texas: | 16.2% |


