Bethalto, IL (Illinois) Houses and Residents
| Bethalto: | $167,184 |
| Illinois: | $251,600 |
Total population: 9,382 (All urban)
Houses: 4,475 (3,942 occupied: 3,063 owner occupied, 905 renter occupied)
| % of renters here: | 23% |
| State: | 33% |
Housing density: 680 houses/condos per square mile
Median price asked for vacant for-sale houses and condos in 2022: $94,073.
Median contract rent in 2022: $662 (lower quartile is $568, upper quartile is $866)
Median rent asked for vacant for-rent units in 2022: $2,570
Median gross rent in Bethalto, IL in 2022: $840
Housing units in Bethalto with a mortgage: 1,730 (93 second mortgage, 0 home equity loan, 71 both second mortgage and home equity loan)
Houses without a mortgage: 72
Median household income for houses/condos with a mortgage: $87,865
Median household income for apartments without a mortgage: $61,061
Median monthly housing costs: $905
Compare current foreclosures near Bethalto, IL:
| Photo | Address | Area | Beds / Baths | Price | Details |
|---|---|---|---|---|---|

|
#1
Sheridan St
Bethalto, IL 62010
|
940 sq. feet
|
1 baths 2 beds |
$139,900
|
show details |

|
#2
Sheridan St
Bethalto, IL 62010
|
1,440 sq. feet
|
2 baths 3 beds |
show details | |

|
#3
Valley View Dr
Bethalto, IL 62010
|
828 sq. feet
|
1 baths 4 beds |
show details | |

|
#4
Greenbrier Ln
Bethalto, IL 62010
|
1,646 sq. feet
|
2 baths - beds |
show details | |

|
#5
W Corbin St
Bethalto, IL 62010
|
1,408 sq. feet
|
1 baths - beds |
show details | |

|
#6
Greenbrier Ln
Bethalto, IL 62010
|
1,352 sq. feet
|
1 baths - beds |
show details | |

|
#7
Seiler Rd
Bethalto, IL 62010
|
- sq. feet
|
- baths - beds |
show details | |

|
#8
N Old Bethalto Rd
Bethalto, IL 62010
|
1,203 sq. feet
|
- baths - beds |
show details | |

|
#9
Virginia St
Bethalto, IL 62010
|
1,610 sq. feet
|
- baths - beds |
show details | |

|
#10
Mense Dr # 9
Bethalto, IL 62010
|
- sq. feet
|
- baths - beds |
show details |
| Photo | Address | Area | Beds / Baths | Price | Details |
|---|---|---|---|---|---|

|
#11
Whispering Oaks Dr
Bethalto, IL 62010
|
1,860 sq. feet
|
- baths - beds |
show details | |

|
#12
Rue Sans Souci Apt A
Bethalto, IL 62010
|
- sq. feet
|
- baths - beds |
show details | |

|
#13
Montana St
Bethalto, IL 62010
|
1,608 sq. feet
|
- baths - beds |
show details | |

|
#14
Homm St
Bethalto, IL 62010
|
988 sq. feet
|
- baths - beds |
show details | |

|
#15
Circle Dr
Bethalto, IL 62010
|
1,180 sq. feet
|
- baths - beds |
show details | |

|
#16
S Prairie St Apt B
Bethalto, IL 62010
|
- sq. feet
|
- baths - beds |
show details | |

|
#17
Shellview St
Bethalto, IL 62010
|
922 sq. feet
|
- baths - beds |
show details | |

|
#18
Oregon St
Bethalto, IL 62010
|
1,796 sq. feet
|
- baths - beds |
show details | |

|
#19
Wyoming St
Bethalto, IL 62010
|
- sq. feet
|
- baths - beds |
show details | |

|
#20
Valley View Dr
Bethalto, IL 62010
|
1,680 sq. feet
|
- baths - beds |
show details |
| Photo | Address | Area | Beds / Baths | Price | Details |
|---|---|---|---|---|---|

|
#21
W Corbin St
Bethalto, IL 62010
|
2,064 sq. feet
|
- baths - beds |
show details | |

|
#22
Lothian Cir
Saint Louis, MO 63137
|
1,044 sq. feet
|
1 baths 2 beds |
$99,900
|
show details |

|
#23
Aqueduct Dr
Florissant, MO 63033
|
1,197 sq. feet
|
2 baths 3 beds |
$259,000
|
show details |

|
#24
Jerries Ln
Saint Louis, MO 63136
|
1,380 sq. feet
|
1 baths 3 beds |
$219,900
|
show details |

|
#25
Bagley Dr
Saint Louis, MO 63136
|
982 sq. feet
|
1 baths 2 beds |
$119,900
|
show details |

|
#26
Grants Pkwy
Florissant, MO 63031
|
986 sq. feet
|
1 baths 3 beds |
$159,900
|
show details |

|
#27
Concord Pl
Saint Louis, MO 63147
|
768 sq. feet
|
1 baths 2 beds |
$59,900
|
show details |

|
#28
N New Florissant Roa
Florissant, MO 63031
|
840 sq. feet
|
1 baths 2 beds |
$167,000
|
show details |

|
#29
Velma Ave
South Roxana, IL 62087
|
1,008 sq. feet
|
1 baths 3 beds |
$29,900
|
show details |

|
#30
Walnut Dr
Cottage Hills, IL 62018
|
657 sq. feet
|
1 baths 2 beds |
$35,000
|
show details |
| Photo | Address | Area | Beds / Baths | Price | Details |
|---|---|---|---|---|---|

|
#31
Partridge Run Dr
Florissant, MO 63033
|
1,140 sq. feet
|
1 baths 2 beds |
$113,000
|
show details |

|
#32
Grand Ave
Wood River, IL 62095
|
1,320 sq. feet
|
1 baths 4 beds |
$157,000
|
show details |

|
#33
Hillcrest Dr
Glen Carbon, IL 62034
|
1,425 sq. feet
|
2 baths 3 beds |
$265,000
|
show details |

|
#34
Gabrielle Cir
Bethalto, IL 62010
|
- sq. feet
|
- baths - beds |
show details | |

|
#35
Mclaran Ave
Saint Louis, MO 63136
|
1,379 sq. feet
|
2 baths 2 beds |
$1
|
show details |

|
#36
Edwards St
Granite City, IL 62040
|
828 sq. feet
|
- baths 2 beds |
$39,900
|
show details |

|
#37
Hollis Dr
Saint Louis, MO 63136
|
1,054 sq. feet
|
2 baths 3 beds |
show details | |

|
#38
Old Straube Ln
Alton, IL 62002
|
960 sq. feet
|
2 baths 3 beds |
show details | |

|
#39
Bugle Run Dr
Florissant, MO 63034
|
1,632 sq. feet
|
3 baths 3 beds |
show details | |

|
#40
Monticello Dr
Saint Louis, MO 63138
|
1,887 sq. feet
|
1 baths 3 beds |
show details |
| Photo | Address | Area | Beds / Baths | Price | Details |
|---|---|---|---|---|---|

|
#41
Muny Vista Ct
Alton, IL 62002
|
1,637 sq. feet
|
2 baths 3 beds |
show details | |

|
#42
W 24th St
Granite City, IL 62040
|
1,186 sq. feet
|
1 baths 3 beds |
show details | |

|
#43
Lincoln Ave
Granite City, IL 62040
|
656 sq. feet
|
1 baths 2 beds |
show details | |

|
#44
W 2nd St
Hartford, IL 62048
|
734 sq. feet
|
1 baths 2 beds |
show details | |

|
#45
Secretariat Dr
Florissant, MO 63034
|
2,146 sq. feet
|
2 baths 3 beds |
show details | |

|
#46
Behlmann Grove Pl
Florissant, MO 63034
|
2,744 sq. feet
|
2 baths 4 beds |
show details | |

|
#47
Edwards St
Granite City, IL 62040
|
1,202 sq. feet
|
1 baths 3 beds |
show details | |

|
#48
Siesta Ln
Saint Louis, MO 63138
|
1,344 sq. feet
|
2 baths 3 beds |
show details | |

|
#49
Spruce St
Granite City, IL 62040
|
1,120 sq. feet
|
1 baths 2 beds |
show details | |

|
Check over 1 million property listings on Foreclosure.com!
|
browse all offers | |||

Latest news about housing in Bethalto, IL collected exclusively by city-data.com from local newspapers, TV, and radio stations

 | how are bethalto,il schools? (1 reply) |
| How's St. Louis's Metro East? (6 replies) |
| What's Wood River like these days? (3 replies) |
| Relocating to Illinois with family (38 replies) |
| Who actually lives in Alton? (47 replies) |
| Transferring to St. Louis on a budget and with a family... HELP! (27 replies) |

Median year apartment built: 1980
Household type by relationship:
Households: 9,223- Male householders: 2,021 (448 living alone), Female householders: 1,881 (636 living alone)
1,987 spouses (1,965 opposite-sex spouses), 457 unmarried partners, (457 opposite-sex unmarried partners), 2,455 children (2,175 natural, 101 adopted, 178 stepchildren), 111 grandchildren, 70 brothers or sisters, 46 parents, 38 foster children, 49 other relatives, 40 non-relatives
- In group quarters: 62
Size of family households: 1,101 2-persons, 717 3-persons, 476 4-persons, 129 5-persons, 16 6-persons, 10 7-or-more-persons.
Size of nonfamily households: 1,178 1-person, 270 2-persons, 38 3-persons.
1,347 married couples with children.
531 single-parent households (111 men, 420 women).
99.3% of residents of Bethalto speak English at home.
0.3% of residents speak Spanish at home (87% speak English very well, 13% speak English well).
0.1% of residents speak Asian or Pacific Island language at home (100% speak English well).
Foreign born population: 21 (0.2%)
(66.7% of them are naturalized citizens)
| Here: | 6.5 |
| State: | 6.4 |
| Here: | 4.0 |
| State: | 4.1 |

- Bedrooms in owner-occupied houses and condos in Bethalto, Illinois
- 0no bedroom
- 181 bedroom
- 5222 bedrooms
- 1,7933 bedrooms
- 6864 bedrooms
- 445+ bedrooms

- Bedrooms in renter-occupied apartments in Bethalto, Illinois
- 30no bedroom
- 2401 bedroom
- 4972 bedrooms
- 1013 bedrooms
- 374 bedrooms
- 05+ bedrooms

- Cars and other vehicles available in Bethalto in owner-occupied houses/condos
- 28no vehicle
- 8121 vehicle
- 1,6322 vehicles
- 4633 vehicles
- 1144 vehicles
- 145+ vehicles

- Cars and other vehicles available in Bethalto in renter-occupied apartments
- 108no vehicle
- 5441 vehicle
- 2062 vehicles
- 293 vehicles
- 184 vehicles
- 05+ vehicles

- Rooms in owner-occupied houses in Bethalto, Illinois
- 01 room
- 02 rooms
- 03 rooms
- 3774 rooms
- 5945 rooms
- 6046 rooms
- 7617 rooms
- 3588 rooms
- 3699+ rooms

- Rooms in renter-occupied apartments in Bethalto, Illinois
- 301 room
- 372 rooms
- 2313 rooms
- 2704 rooms
- 1355 rooms
- 1106 rooms
- 487 rooms
- 138 rooms
- 309+ rooms


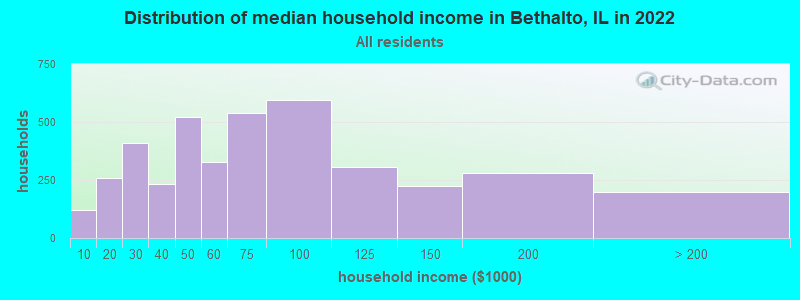
Bethalto, IL household income distribution

- 120Less than $10,000
- 258$10,000 to $19,999
- 408$20,000 to $29,999
- 231$30,000 to $39,999
- 522$40,000 to $49,999
- 329$50,000 to $59,999
- 538$60,000 to $74,999
- 594$75,000 to $99,999
- 304$100,000 to $124,999
- 226$125,000 to $149,999
- 280$150,000 to $199,999
- 197$200,000 or more
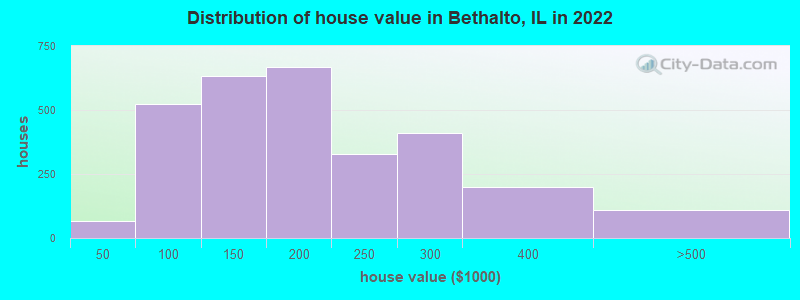
Home value of owner - occupied houses in 2022 in Bethalto, IL
-
- 2Less than $10,000
- 10$10,000 to $14,999
- 44$15,000 to $19,999
- 8$40,000 to $49,999
- 85$50,000 to $59,999
- 32$60,000 to $69,999
- 88$70,000 to $79,999
- 93$80,000 to $89,999
- 215$90,000 to $99,999
- 321$100,000 to $124,999
- 311$125,000 to $149,999
- 535$150,000 to $174,999
- 133$175,000 to $199,999
- 327$200,000 to $249,999
- 409$250,000 to $299,999
- 198$300,000 to $399,999
- 97$400,000 to $499,999
- 10$500,000 to $749,999
Rent paid by renters in 2022 in Bethalto, IL
-
- 44$100 to $149
- 13$150 to $199
- 7$400 to $449
- 48$450 to $499
- 7$500 to $549
- 131$550 to $599
- 94$600 to $649
- 139$650 to $699
- 76$700 to $749
- 9$750 to $799
- 121$800 to $899
- 78$900 to $999
- 29$1,000 to $1,249
- 4$1,250 to $1,499
- 49$1,500 to $1,999
- 60$2,000 to $2,499
- 29No cash rent


Percentage of workers working in this county: 73.4%
Number of people working at home: 501 (11.3% of all workers)
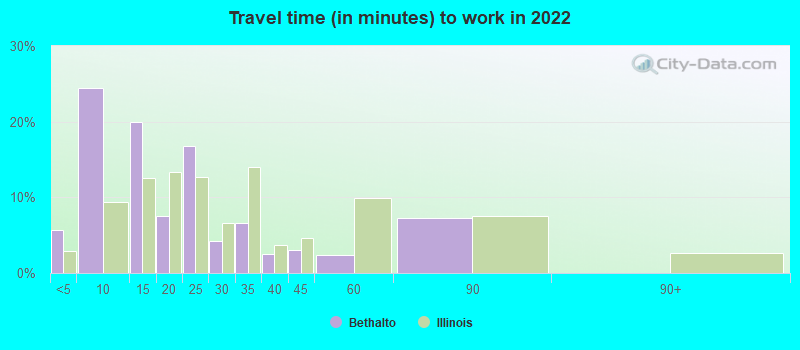
Travel time to work (commute)
- Less than 5 minutes: 137
- 5 to 9 minutes: 503
- 10 to 14 minutes: 332
- 15 to 19 minutes: 564
- 20 to 24 minutes: 714
- 25 to 29 minutes: 202
- 30 to 34 minutes: 335
- 35 to 39 minutes: 413
- 40 to 44 minutes: 166
- 45 to 59 minutes: 356
- 60 to 89 minutes: 107
- 90 or more minutes: 48
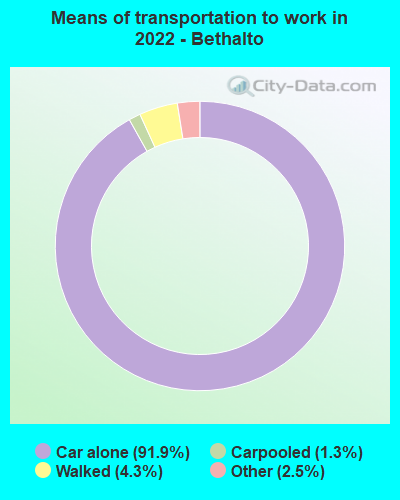
Means of transportation to work:
- Drove a car alone: 1,843 (74.0%)
- Carpooled: 25 (1.0%)
- Taxi: 72 (2.9%)
- Walked: 106 (4.3%)
- Worked at home: 501 (20.1%)

- Unemployment by race in 2022
- Unemployment rate for White non-Hispanic residents
- 5.1%Males
- 3.1%Females

- Year of entry for the foreign-born population in Bethalto, Illinois
- 122010 or later
- 02000 to 2009
- 91990 to 1999
- 01980 to 1989
- 391970 to 1979
- 50Before 1970

First ancestries reported:
- American: 951 (26.4%)
- German: 808 (22.4%)
- English: 315 (8.8%)
- Irish: 277 (7.7%)
- Italian: 129 (3.6%)
- Northern European: 91 (2.5%)
- Scottish: 49 (1.4%)
- European: 47 (1.3%)
- Swedish: 26 (0.7%)
- Polish: 16 (0.4%)
- Yugoslavian: 12 (0.3%)
- Dutch: 10 (0.3%)
- Ethiopian: 10 (0.3%)
- Croatian: 8 (0.2%)
- Czech: 8 (0.2%)
- French: 7 (0.2%)
- Russian: 7 (0.2%)
- Slovak: 7 (0.2%)
- French Canadian: 5 (0.1%)
Most common places of birth for foreign-born residents (%):
| Bethalto: | 45.5% (10) |
| Illinois: | 0.3% (4,775) |
| Bethalto: | 31.8% (7) |
| Illinois: | 1.2% (22,269) |
| Bethalto: | 9.1% (2) |
| Illinois: | 34.7% (626,958) |
Place of birth for U.S.-born residents:
- This state: 7,150
- Other state: 2,045
- Northeast: 72
- Midwest: 1,339
- South: 440
- West: 189
92.2% of Bethalto residents lived in the same house 1 years ago.
Out of people who lived in different houses, 43.3% lived in this county.
Out of people who lived in different counties, 25.0% lived in Illinois.
| Bethalto: | 92.2% |
| State average: | 88.3% |
Education attainment for males 25 years and older:
- No schooling: 46
- Nursery to 4th grade: 0
- 5th and 6th grade: 0
- 7th and 8th grade: 1
- 9th grade: 23
- 10th grade: 59
- 11th grade: 127
- 12th grade, no diploma: 20
- High school graduate (or equivalency): 899
- Less than 1 year of college: 198
- Some college more than 1 year, no degree: 262
- Associate degree: 553
- Bachelor's degree: 697
- Master's degree: 130
- Professional school degree: 20
- Doctorate degree: 41

Education attainment for females 25 years and older:
- No schooling: 23
- Nursery to 4th grade: 0
- 5th and 6th grade: 0
- 7th and 8th grade: 33
- 9th grade: 131
- 10th grade: 40
- 11th grade: 7
- 12th grade, no diploma: 11
- High school graduate (or equivalency): 1,249
- Less than 1 year of college: 244
- Some college more than 1 year, no degree: 471
- Associate degree: 319
- Bachelor's degree: 648
- Master's degree: 321
- Professional school degree: 25
- Doctorate degree: 29


Housing units in structures:
- One, detached: 3,436
- One, attached: 96
- Two: 109
- 3 or 4: 268
- 5 to 9: 234
- 10 to 19: 24
- 20 to 49: 21
- 50 or more: 221
- Mobile homes: 63
Housing units lacking complete kitchen facilities in 2022: 8.6%
House/condo owner moved in on average 10 years ago
Renter moved in on average 2 years ago

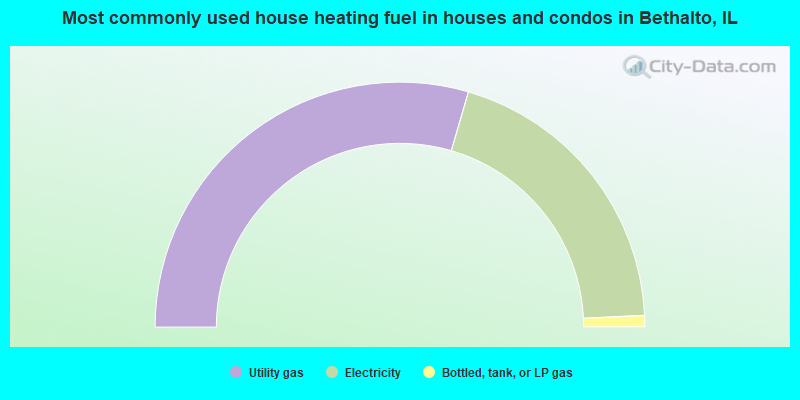
- 59.1%Utility gas
- 39.5%Electricity
- 1.5%Bottled, tank, or LP gas
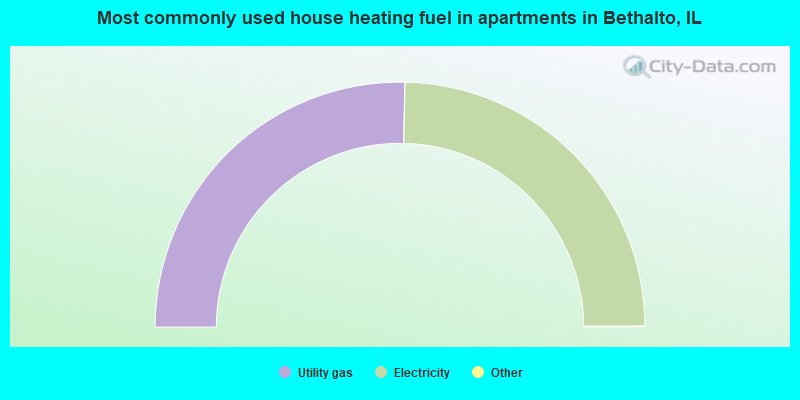
- 50.7%Utility gas
- 49.3%Electricity
Private vs. public school enrollment:
| Here: | 11.5% |
| Illinois: | 13.3% |
| Here: | 3.9% |
| Illinois: | 9.9% |
| Here: | 4.8% |
| Illinois: | 27.4% |


