Bladenboro, NC (North Carolina) Houses and Residents
| Bladenboro: | $101,656 |
| North Carolina: | $280,600 |
Mean price in 2022:
Detached houses: $118,023
Here: $118,023 State: $375,326 Mobile homes: $66,746
Here: $66,746 State: $124,933
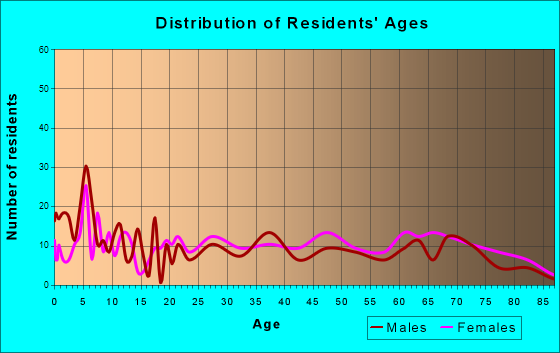
Total population: 1,733 (Urban population: 0, Rural population: 1,700 (24 farm, 1,676 nonfarm))
Houses: 947 (780 occupied: 333 owner occupied, 458 renter occupied)
| % of renters here: | 58% |
| State: | 33% |
Housing density: 435 houses/condos per square mile
Median price asked for vacant for-sale houses and condos in 2022: $771,616.
Median contract rent in 2022: $492 (lower quartile is $371, upper quartile is $628)
Median rent asked for vacant for-rent units in 2022: $1,416
Median gross rent in Bladenboro, NC in 2022: $735
Housing units in Bladenboro with a mortgage: 95 (4 second mortgage, 0 home equity loan, 0 both second mortgage and home equity loan)
Houses without a mortgage: 0
Median household income for houses/condos with a mortgage: $86,017
Median monthly housing costs: $626
Compare current foreclosures near Bladenboro, NC:
| Photo | Address | Area | Beds / Baths | Price | Details |
|---|---|---|---|---|---|

|
#1
Guyton Rd
Bladenboro, NC 28320
|
1,624 sq. feet
|
3 baths - beds |
show details | |

|
#2
Paul Brisson Rd
Bladenboro, NC 28320
|
1,448 sq. feet
|
2 baths - beds |
show details | |

|
#3
Pleasant Grove Church Rd
Bladenboro, NC 28320
|
- sq. feet
|
- baths - beds |
show details | |

|
#4
Nc 242 Hwy S
Bladenboro, NC 28320
|
- sq. feet
|
- baths - beds |
show details | |

|
#5
Nc Hwy 211 East
Lumberton, NC 28358
|
- sq. feet
|
2 baths 3 beds |
$139,900
|
show details |

|
#6
Fowler Rd
Lumberton, NC 28358
|
1,582 sq. feet
|
2 baths 3 beds |
show details | |

|
#7
Marion Rd
Lumberton, NC 28358
|
1,090 sq. feet
|
1 baths 3 beds |
show details | |

|
#8
Kings Cross Rd
Lumberton, NC 28360
|
1,992 sq. feet
|
2 baths 4 beds |
show details | |

|
#9
Kings Cross Rd
Lumberton, NC 28360
|
1,926 sq. feet
|
3 baths 4 beds |
show details | |

|
#10
Pinedale Blvd
Lumberton, NC 28358
|
1,164 sq. feet
|
2 baths 2 beds |
show details |
| Photo | Address | Area | Beds / Baths | Price | Details |
|---|---|---|---|---|---|

|
#11
Popes Crossing Rd
Lumberton, NC 28358
|
1,560 sq. feet
|
2 baths 3 beds |
show details | |

|
#12
E 6th St
Lumberton, NC 28358
|
1,275 sq. feet
|
1 baths 3 beds |
show details | |

|
#13
Rosenwald St
Lumberton, NC 28358
|
1,120 sq. feet
|
1 baths 2 beds |
show details | |

|
#14
E 19th St
Lumberton, NC 28358
|
1,269 sq. feet
|
1 baths 2 beds |
show details | |

|
#15
Pleasant Meadow Rd
Lumberton, NC 28358
|
1,848 sq. feet
|
2 baths 3 beds |
show details | |

|
#16
Front St
Lumberton, NC 28358
|
1,260 sq. feet
|
1 baths 2 beds |
show details | |

|
#17
Straightway Dr
Fairmont, NC 28340
|
1,944 sq. feet
|
2 baths 3 beds |
show details | |

|
#18
Oakridge Blvd
Lumberton, NC 28358
|
2,461 sq. feet
|
2 baths 3 beds |
show details | |

|
#19
Dallas Rd
Lumberton, NC 28358
|
1,728 sq. feet
|
2 baths 3 beds |
show details | |

|
#20
7th Street Rd
Lumberton, NC 28358
|
2,853 sq. feet
|
2 baths 4 beds |
show details |
| Photo | Address | Area | Beds / Baths | Price | Details |
|---|---|---|---|---|---|

|
#21
W 31st St
Lumberton, NC 28358
|
1,581 sq. feet
|
2 baths 3 beds |
show details | |

|
#22
Tar Heel Rd
Lumberton, NC 28358
|
1,707 sq. feet
|
2 baths 2 beds |
show details | |

|
#23
Saddletree Rd
Lumberton, NC 28360
|
1,102 sq. feet
|
1 baths 3 beds |
show details | |

|
#24
Progressive Farm Rd
Fairmont, NC 28340
|
1,950 sq. feet
|
3 baths 5 beds |
show details | |

|
#25
Russ Rd
Lumberton, NC 28358
|
1,042 sq. feet
|
1 baths 3 beds |
show details | |

|
#26
Boone Rd
Lumberton, NC 28360
|
1,053 sq. feet
|
1 baths 3 beds |
show details | |

|
#27
Beulah Church Rd
Lumberton, NC 28358
|
1,410 sq. feet
|
1 baths 3 beds |
show details | |

|
#28
Pinewood Dr
Whiteville, NC 28472
|
1,075 sq. feet
|
- baths - beds |
show details | |

|
#29
Andrew Jackson Rd SW
Chadbourn, NC 28431
|
1,395 sq. feet
|
- baths - beds |
show details | |

|
#30
E 2nd Ave
Chadbourn, NC 28431
|
1,192 sq. feet
|
- baths - beds |
show details |
| Photo | Address | Area | Beds / Baths | Price | Details |
|---|---|---|---|---|---|

|
#31
Dowd Dairy Rd
White Oak, NC 28399
|
1,792 sq. feet
|
- baths - beds |
show details | |

|
#32
Stanley St
Whiteville, NC 28472
|
- sq. feet
|
- baths - beds |
show details | |

|
#33
Grist Rd
Chadbourn, NC 28431
|
- sq. feet
|
- baths - beds |
show details | |

|
#34
Bowman Rd
Lumberton, NC 28358
|
- sq. feet
|
- baths - beds |
show details | |

|
#35
Waynes Way
Whiteville, NC 28472
|
- sq. feet
|
- baths - beds |
show details | |

|
#36
N Fayetteville Rd
Lumberton, NC 28360
|
- sq. feet
|
- baths - beds |
show details | |

|
#37
Cy Williams Blvd # A
Lumberton, NC 28360
|
- sq. feet
|
- baths - beds |
show details | |

|
#38
Honey Hill Dr
Hallsboro, NC 28442
|
1,404 sq. feet
|
- baths - beds |
show details | |

|
#39
Nc Highway 211 W
Lumberton, NC 28360
|
- sq. feet
|
- baths - beds |
show details | |

|
#40
Sandy Hill Dr
Whiteville, NC 28472
|
- sq. feet
|
- baths - beds |
show details |
| Photo | Address | Area | Beds / Baths | Price | Details |
|---|---|---|---|---|---|

|
#41
Summersett Ext Rd
Whiteville, NC 28472
|
1,344 sq. feet
|
- baths - beds |
show details | |

|
#42
Old Pine Log Rd
Chadbourn, NC 28431
|
- sq. feet
|
- baths - beds |
show details | |

|
#43
Freedom Blvd
Whiteville, NC 28472
|
- sq. feet
|
- baths - beds |
show details | |

|
#44
Hallsboro Rd N
Whiteville, NC 28472
|
- sq. feet
|
- baths - beds |
show details | |

|
#45
N Fayetteville Rd
Lumberton, NC 28360
|
- sq. feet
|
- baths - beds |
show details | |

|
#46
Chadbourn Hwy
Chadbourn, NC 28431
|
- sq. feet
|
- baths - beds |
show details | |

|
#47
Greenville Rd
Lumberton, NC 28358
|
- sq. feet
|
- baths - beds |
show details | |

|
#48
Whitehall Rd
Whiteville, NC 28472
|
- sq. feet
|
- baths - beds |
show details | |

|
#49
E Clay St
Whiteville, NC 28472
|
1,228 sq. feet
|
- baths - beds |
show details | |

|
Check over 1 million property listings on Foreclosure.com!
|
browse all offers | |||

Latest news about housing in Bladenboro, NC collected exclusively by city-data.com from local newspapers, TV, and radio stations

 | Moving South- Recommendation for Best County to Live in: Columbus, Brunswick, or Bladen (7 replies) |
| The Triangle in 30 Years (79 replies) |
| Deep South-ish areas of North Carolina (82 replies) |
| Best scenic route from Raleigh to Myrtle Beach (27 replies) |
| Newcomer's Guide to NC Town and County Names & Locations (38 replies) |
| What's up with crime in NC? (my experiences at least) (25 replies) |
Median year apartment built: 1974
Household type by relationship:
Households: 2,539- Male householders: 285 (111 living alone), Female householders: 487 (131 living alone)
311 spouses (311 opposite-sex spouses), 11 unmarried partners, (11 opposite-sex unmarried partners), 1,143 children (1,093 natural, 9 adopted, 40 stepchildren), 52 grandchildren, 177 brothers or sisters, 0 parents, 0 foster children, 32 other relatives, 37 non-relatives
Size of family households: 209 2-persons, 95 3-persons, 125 4-persons, 85 5-persons, 15 6-persons, 4 7-or-more-persons.
Size of nonfamily households: 247 1-person, 5 2-persons.
328 married couples with children.
314 single-parent households (0 men, 314 women).
78.3% of residents of Bladenboro speak English at home.
20.7% of residents speak Spanish at home (66% speak English very well, 13% speak English well, 21% speak English not well).
Foreign born population: 179 (7.1%)
(0.0% of them are naturalized citizens)
| Here: | 7.0 |
| State: | 6.4 |
| Here: | 5.1 |
| State: | 4.4 |

- Bedrooms in owner-occupied houses and condos in Bladenboro, North Carolina
- 0no bedroom
- 71 bedroom
- 662 bedrooms
- 2373 bedrooms
- 194 bedrooms
- 45+ bedrooms

- Bedrooms in renter-occupied apartments in Bladenboro, North Carolina
- 0no bedroom
- 361 bedroom
- 1142 bedrooms
- 2343 bedrooms
- 04 bedrooms
- 755+ bedrooms

- Cars and other vehicles available in Bladenboro in owner-occupied houses/condos
- 5no vehicle
- 761 vehicle
- 942 vehicles
- 1393 vehicles
- 184 vehicles
- 05+ vehicles

- Cars and other vehicles available in Bladenboro in renter-occupied apartments
- 21no vehicle
- 2081 vehicle
- 1412 vehicles
- 753 vehicles
- 134 vehicles
- 05+ vehicles

- Rooms in owner-occupied houses in Bladenboro, North Carolina
- 01 room
- 02 rooms
- 213 rooms
- 104 rooms
- 625 rooms
- 416 rooms
- 647 rooms
- 778 rooms
- 589+ rooms

- Rooms in renter-occupied apartments in Bladenboro, North Carolina
- 01 room
- 22 rooms
- 233 rooms
- 1394 rooms
- 1025 rooms
- 1026 rooms
- 37 rooms
- 138 rooms
- 759+ rooms


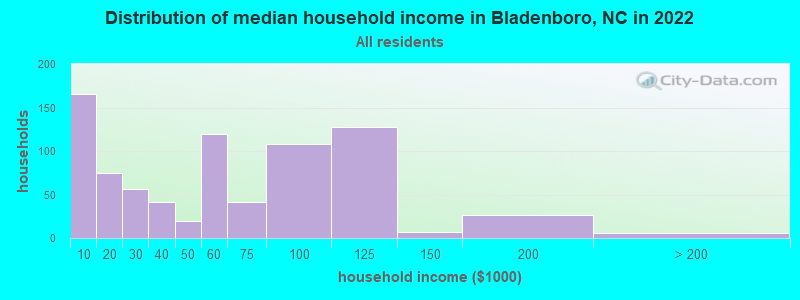
Bladenboro, NC household income distribution

- 165Less than $10,000
- 75$10,000 to $19,999
- 56$20,000 to $29,999
- 41$30,000 to $39,999
- 20$40,000 to $49,999
- 120$50,000 to $59,999
- 41$60,000 to $74,999
- 108$75,000 to $99,999
- 128$100,000 to $124,999
- 7$125,000 to $149,999
- 27$150,000 to $199,999
- 6$200,000 or more
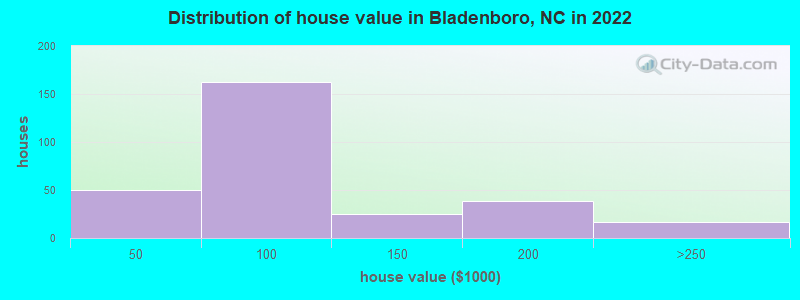
Home value of owner - occupied houses in 2022 in Bladenboro, NC
-
- 1$10,000 to $14,999
- 15$20,000 to $24,999
- 7$25,000 to $29,999
- 16$35,000 to $39,999
- 9$40,000 to $49,999
- 12$50,000 to $59,999
- 26$60,000 to $69,999
- 30$70,000 to $79,999
- 66$80,000 to $89,999
- 16$90,000 to $99,999
- 25$100,000 to $124,999
- 26$150,000 to $174,999
- 12$175,000 to $199,999
- 14$200,000 to $249,999
- 2$300,000 to $399,999
Rent paid by renters in 2022 in Bladenboro, NC
-
- 16Less than $100
- 2$100 to $149
- 6$200 to $249
- 23$250 to $299
- 22$300 to $349
- 69$350 to $399
- 11$400 to $449
- 27$450 to $499
- 25$500 to $549
- 44$550 to $599
- 22$600 to $649
- 25$650 to $699
- 14$1,000 to $1,249
- 104No cash rent


Percentage of workers working in this county: 86.6%
Number of people working at home: 114 (13.9% of all workers)
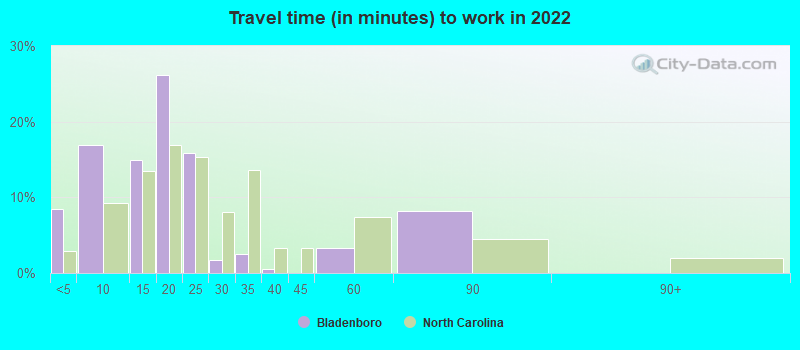
Travel time to work (commute)
- Less than 5 minutes: 35
- 5 to 9 minutes: 130
- 10 to 14 minutes: 68
- 15 to 19 minutes: 68
- 20 to 24 minutes: 200
- 25 to 29 minutes: 8
- 30 to 34 minutes: 114
- 35 to 39 minutes: 2
- 40 to 44 minutes: 0
- 45 to 59 minutes: 61
- 60 to 89 minutes: 4
- 90 or more minutes: 0
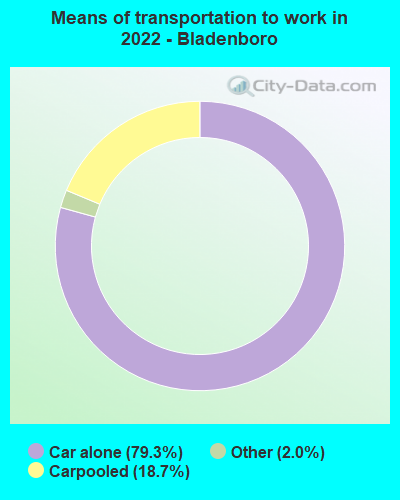
Means of transportation to work:
- Drove a car alone: 660 (72.0%)
- Carpooled: 136 (14.8%)
- Taxi: 20 (2.2%)
- Worked at home: 62 (6.8%)

- Unemployment by race in 2022
- Unemployment rate for White non-Hispanic residents
- 13.6%Males
- 2.1%Females

- Year of entry for the foreign-born population in Bladenboro, North Carolina
- 742010 or later
- 02000 to 2009
- 01990 to 1999
- 21980 to 1989
- 01970 to 1979
- 2Before 1970

First ancestries reported:
- American: 586 (32.4%)
- English: 49 (2.7%)
- Scottish: 25 (1.4%)
- Scotch-Irish: 20 (1.1%)
- German: 14 (0.8%)
- Italian: 12 (0.7%)
- European: 10 (0.6%)
- Canadian: 8 (0.4%)
Most common places of birth for foreign-born residents (%):
| Bladenboro: | 111.7% (200) |
| North Carolina: | 2.6% (22,964) |
Place of birth for U.S.-born residents:
- This state: 1,896
- Other state: 410
- Northeast: 42
- Midwest: 49
- South: 111
- West: 208
92.9% of Bladenboro residents lived in the same house 1 years ago.
Out of people who lived in different houses, 44.2% lived in this county.
Out of people who lived in different counties, 100.0% lived in North Carolina.
| Bladenboro: | 92.9% |
| State average: | 87.3% |
Education attainment for males 25 years and older:
- No schooling: 17
- Nursery to 4th grade: 6
- 5th and 6th grade: 0
- 7th and 8th grade: 7
- 9th grade: 14
- 10th grade: 15
- 11th grade: 2
- 12th grade, no diploma: 0
- High school graduate (or equivalency): 331
- Less than 1 year of college: 22
- Some college more than 1 year, no degree: 19
- Associate degree: 190
- Bachelor's degree: 46
- Master's degree: 31
- Professional school degree: 0
- Doctorate degree: 3

Education attainment for females 25 years and older:
- No schooling: 41
- Nursery to 4th grade: 91
- 5th and 6th grade: 0
- 7th and 8th grade: 9
- 9th grade: 4
- 10th grade: 21
- 11th grade: 14
- 12th grade, no diploma: 6
- High school graduate (or equivalency): 113
- Less than 1 year of college: 91
- Some college more than 1 year, no degree: 157
- Associate degree: 71
- Bachelor's degree: 103
- Master's degree: 12
- Professional school degree: 0
- Doctorate degree: 0

Housing units in structures:
- One, detached: 657
- Two: 39
- 3 or 4: 73
- 5 to 9: 19
- 20 to 49: 2
- 50 or more: 8
- Mobile homes: 147
House/condo owner moved in on average 13 years ago
Renter moved in on average 6 years ago

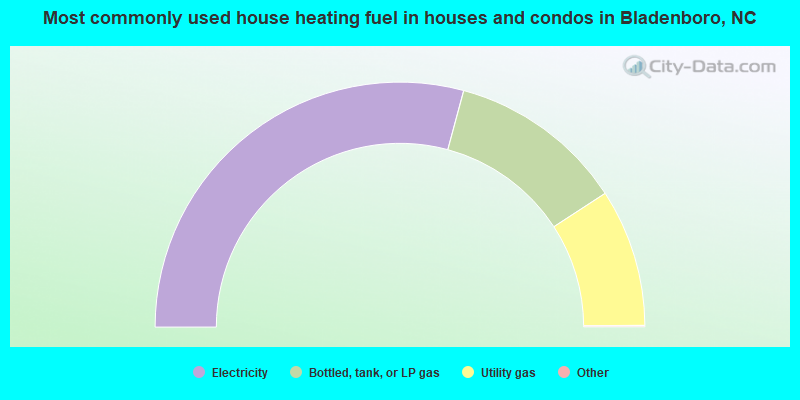
- 58.5%Electricity
- 23.3%Bottled, tank, or LP gas
- 18.2%Utility gas
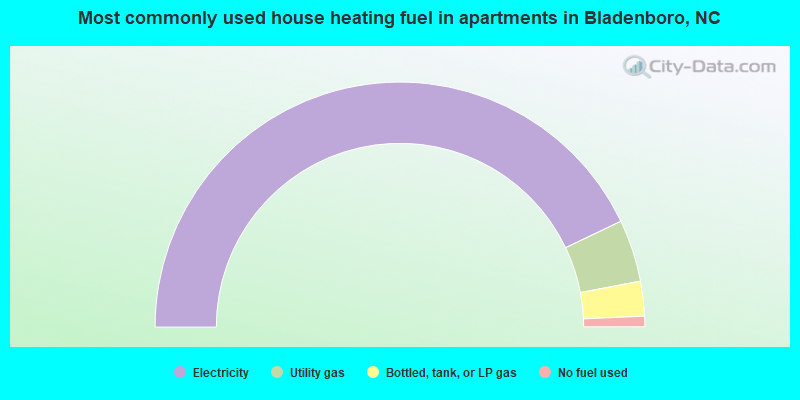
- 85.8%Electricity
- 8.2%Utility gas
- 4.6%Bottled, tank, or LP gas
- 1.4%No fuel used
Private vs. public school enrollment:
| Here: | 1.0% |
| North Carolina: | 13.8% |
| Here: | 3.4% |
| North Carolina: | 11.9% |
| Here: | 0.0% |
| North Carolina: | 19.3% |


