Briar Creek, PA (Pennsylvania) Houses and Residents
| Briar Creek: | $203,498 |
| Pennsylvania: | $245,500 |
Mean price in 2022:
Detached houses: $234,753
Here: $234,753 State: $317,202 Mobile homes: $178,109
Here: $178,109 State: $92,414
Total population: 688 (Urban population: 477 (all inside urban clusters), Rural population: 174 (4 farm, 170 nonfarm))
Houses: 354 (289 occupied: 151 owner occupied, 139 renter occupied)
| % of renters here: | 48% |
| State: | 31% |
Housing density: 222 houses/condos per square mile
Median price asked for vacant for-sale houses and condos in 2022 in this county: $112,898.
Median contract rent in 2022: $562 (lower quartile is $413, upper quartile is $668)
Median rent asked for vacant for-rent units in 2022: $531
Median gross rent in Briar Creek, PA in 2022: $630
Housing units in Briar Creek with a mortgage: 63 (7 second mortgage, 0 home equity loan, 6 both second mortgage and home equity loan)
Houses without a mortgage: 1
Median household income for apartments without a mortgage: $34,773
Median monthly housing costs: $638
Compare current foreclosures near Briar Creek, PA:
| Photo | Address | Area | Beds / Baths | Price | Details |
|---|---|---|---|---|---|

|
#1
W Mount Vernon St
Shenandoah, PA 17976
|
900 sq. feet
|
1 baths 2 beds |
$6,216
|
show details |

|
#2
Virginia Ave
Shenandoah, PA 17976
|
1,311 sq. feet
|
1 baths 3 beds |
$6,313
|
show details |

|
#3
Cherry St
Bloomsburg, PA 17815
|
1,488 sq. feet
|
1 baths 3 beds |
show details | |

|
#4
Main St
Orangeville, PA 17859
|
- sq. feet
|
2 baths 4 beds |
show details | |

|
#5
5th St
Nescopeck, PA 18635
|
- sq. feet
|
1 baths 3 beds |
show details | |

|
#6
W 23rd St
Hazleton, PA 18202
|
- sq. feet
|
1 baths 3 beds |
show details | |

|
#7
Cherry Hill Rd
Shickshinny, PA 18655
|
1,304 sq. feet
|
1 baths 3 beds |
show details | |

|
#8
Martzville Rd
Berwick, PA 18603
|
1,865 sq. feet
|
1 baths 2 beds |
show details | |

|
#9
Florida Ave
Shenandoah, PA 17976
|
1,224 sq. feet
|
1 baths 3 beds |
show details | |

|
#10
Reservoir Rd
Ringtown, PA 17967
|
- sq. feet
|
- baths - beds |
$269,727
|
show details |
| Photo | Address | Area | Beds / Baths | Price | Details |
|---|---|---|---|---|---|

|
#11
W Arlington St
Shenandoah, PA 17976
|
- sq. feet
|
- baths - beds |
$3,382
|
show details |

|
#12
E Coal St
Shenandoah, PA 17976
|
1,140 sq. feet
|
1 baths 3 beds |
show details | |

|
#13
E Coal St
Shenandoah, PA 17976
|
3,502 sq. feet
|
1 baths 3 beds |
show details | |

|
#14
Hedge Row
Bloomsburg, PA 17815
|
1,974 sq. feet
|
2 baths 3 beds |
show details | |

|
#15
Alter St
Hazleton, PA 18201
|
- sq. feet
|
2 baths 3 beds |
show details | |

|
#16
W Oak St
Shenandoah, PA 17976
|
1,806 sq. feet
|
1 baths 5 beds |
show details | |

|
#17
Legion Rd
Bloomsburg, PA 17815
|
2,156 sq. feet
|
- baths - beds |
show details | |

|
#18
Buckhorn Rd
Bloomsburg, PA 17815
|
1,508 sq. feet
|
- baths - beds |
show details | |

|
#19
Dahl Rd
Bloomsburg, PA 17815
|
538 sq. feet
|
- baths - beds |
show details | |

|
#20
Slabtown Rd
Catawissa, PA 17820
|
- sq. feet
|
- baths - beds |
show details |
| Photo | Address | Area | Beds / Baths | Price | Details |
|---|---|---|---|---|---|

|
#21
Boudman Rd
Millville, PA 17846
|
2,928 sq. feet
|
- baths - beds |
show details | |

|
#22
Welliver Dr
Bloomsburg, PA 17815
|
- sq. feet
|
- baths - beds |
show details | |

|
#23
Ray Thomas Ln
Bloomsburg, PA 17815
|
1,472 sq. feet
|
- baths - beds |
show details | |

|
#24
Weston Rd
Sugarloaf, PA 18249
|
- sq. feet
|
- baths - beds |
show details | |

|
#25
Turnberry Ln
Hazleton, PA 18202
|
- sq. feet
|
- baths - beds |
show details | |

|
#26
Pfahler St
Catawissa, PA 17820
|
1,920 sq. feet
|
- baths - beds |
show details | |

|
#27
Mill St
Catawissa, PA 17820
|
1,308 sq. feet
|
- baths - beds |
show details | |

|
#28
Mill St
Catawissa, PA 17820
|
2,002 sq. feet
|
- baths - beds |
show details | |

|
#29
Upper Raven Creek Rd # C
Benton, PA 17814
|
1,680 sq. feet
|
- baths - beds |
show details | |

|
#30
Drinker St
Bloomsburg, PA 17815
|
1,056 sq. feet
|
- baths - beds |
show details |
| Photo | Address | Area | Beds / Baths | Price | Details |
|---|---|---|---|---|---|

|
#31
Fairview Ave
Berwick, PA 18603
|
1,605 sq. feet
|
- baths - beds |
show details | |

|
#32
Market St
Benton, PA 17814
|
2,036 sq. feet
|
- baths - beds |
show details | |

|
#33
Church St
Benton, PA 17814
|
- sq. feet
|
- baths - beds |
show details | |

|
#34
Martin Dr
Catawissa, PA 17820
|
1,776 sq. feet
|
- baths - beds |
show details | |

|
#35
Legion Rd
Bloomsburg, PA 17815
|
2,156 sq. feet
|
- baths - beds |
show details | |

|
#36
Maple Rd
Berwick, PA 18603
|
1,472 sq. feet
|
- baths - beds |
show details | |

|
#37
W Main St
Glen Lyon, PA 18617
|
- sq. feet
|
- baths - beds |
show details | |

|
#38
Locust Ln
Catawissa, PA 17820
|
1,400 sq. feet
|
- baths - beds |
show details | |

|
#39
N Hunter Hwy
Drums, PA 18222
|
- sq. feet
|
- baths - beds |
show details | |

|
#40
Evergreen Ln
Catawissa, PA 17820
|
2,076 sq. feet
|
- baths - beds |
show details |
| Photo | Address | Area | Beds / Baths | Price | Details |
|---|---|---|---|---|---|

|
#41
W Venisa Dr
Hazleton, PA 18202
|
- sq. feet
|
- baths - beds |
show details | |

|
#42
Aristes Highway
Aristes, PA 17920
|
- sq. feet
|
- baths - beds |
show details | |

|
#43
N 3rd St
Hazleton, PA 18202
|
- sq. feet
|
- baths - beds |
show details | |

|
#44
Branch Court
Hazleton, PA 18201
|
- sq. feet
|
- baths - beds |
show details | |

|
#45
W Branch St
Hazleton, PA 18202
|
- sq. feet
|
- baths - beds |
show details | |

|
#46
W 23rd St
Hazleton, PA 18202
|
- sq. feet
|
- baths - beds |
show details | |

|
#47
N 5th St
Hazleton, PA 18202
|
- sq. feet
|
- baths - beds |
show details | |

|
#48
Allen St
Hazleton, PA 18202
|
- sq. feet
|
- baths - beds |
show details | |

|
#49
Lily Lake Rd
Wapwallopen, PA 18660
|
- sq. feet
|
- baths - beds |
show details | |

|
Check over 1 million property listings on Foreclosure.com!
|
browse all offers | |||


 | Reminisce about Nanticoke (77 replies) |

Median year apartment built: 1977
Household type by relationship:
Households: 936- Male householders: 136 (40 living alone), Female householders: 148 (73 living alone)
92 spouses (92 opposite-sex spouses), 37 unmarried partners, (37 opposite-sex unmarried partners), 272 children (233 natural, 26 adopted, 11 stepchildren), 8 grandchildren, 2 brothers or sisters, 5 parents, 0 foster children, 6 other relatives, 196 non-relatives
- In group quarters: 25
Size of family households: 37 2-persons, 21 3-persons, 17 4-persons, 31 5-persons, 26 6-persons, 29 7-or-more-persons.
Size of nonfamily households: 118 1-person, 7 2-persons, 2 3-persons.
99 married couples with children.
107 single-parent households (63 men, 44 women).
96.0% of residents of Briar Creek speak English at home.
2.7% of residents speak Spanish at home (4% speak English very well, 29% speak English well, 42% speak English not well, 25% don't speak English at all).
0.6% of residents speak other Indo-European language at home (100% speak English very well).
0.1% of residents speak Asian or Pacific Island language at home (100% speak English very well).
Foreign born population: 31 (3.3%)
(0.0% of them are naturalized citizens)
| Here: | 5.7 |
| State: | 6.8 |
| Here: | 4.3 |
| State: | 4.3 |

- Bedrooms in owner-occupied houses and condos in Briar Creek, Pennsylvania
- 0no bedroom
- 21 bedroom
- 432 bedrooms
- 913 bedrooms
- 164 bedrooms
- 05+ bedrooms

- Bedrooms in renter-occupied apartments in Briar Creek, Pennsylvania
- 59no bedroom
- 01 bedroom
- 132 bedrooms
- 423 bedrooms
- 74 bedrooms
- 185+ bedrooms

- Cars and other vehicles available in Briar Creek in owner-occupied houses/condos
- 8no vehicle
- 481 vehicle
- 712 vehicles
- 143 vehicles
- 104 vehicles
- 05+ vehicles

- Cars and other vehicles available in Briar Creek in renter-occupied apartments
- 68no vehicle
- 251 vehicle
- 92 vehicles
- 83 vehicles
- 294 vehicles
- 05+ vehicles

- Rooms in owner-occupied houses in Briar Creek, Pennsylvania
- 01 room
- 02 rooms
- 103 rooms
- 204 rooms
- 405 rooms
- 296 rooms
- 297 rooms
- 168 rooms
- 89+ rooms

- Rooms in renter-occupied apartments in Briar Creek, Pennsylvania
- 591 room
- 02 rooms
- 23 rooms
- 114 rooms
- 315 rooms
- 106 rooms
- 137 rooms
- 28 rooms
- 119+ rooms


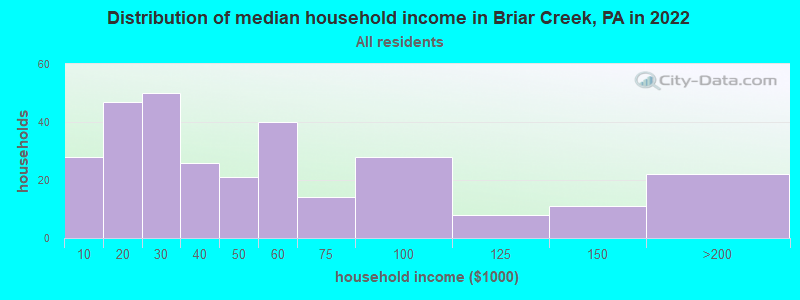
Briar Creek, PA household income distribution

- 28Less than $10,000
- 47$10,000 to $19,999
- 50$20,000 to $29,999
- 26$30,000 to $39,999
- 21$40,000 to $49,999
- 40$50,000 to $59,999
- 14$60,000 to $74,999
- 28$75,000 to $99,999
- 8$100,000 to $124,999
- 11$125,000 to $149,999
- 22$150,000 to $199,999
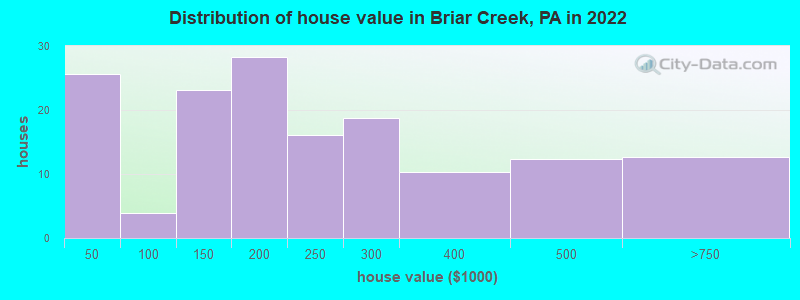
Home value of owner - occupied houses in 2022 in Briar Creek, PA
-
- 20Less than $10,000
- 5$10,000 to $14,999
- 1$70,000 to $79,999
- 2$80,000 to $89,999
- 16$100,000 to $124,999
- 6$125,000 to $149,999
- 11$150,000 to $174,999
- 17$175,000 to $199,999
- 16$200,000 to $249,999
- 18$250,000 to $299,999
- 10$300,000 to $399,999
- 12$400,000 to $499,999
- 12$500,000 to $749,999
Rent paid by renters in 2022 in Briar Creek, PA
-
- 30$300 to $349
- 19$400 to $449
- 14$450 to $499
- 19$550 to $599
- 11$600 to $649
- 21$650 to $699
- 3$700 to $749
- 1$750 to $799
- 2$1,000 to $1,249
- 10$3,500 or more
- 7No cash rent


Percentage of workers working in this county: 75.5%
Number of people working at home: 7 (2.8% of all workers)
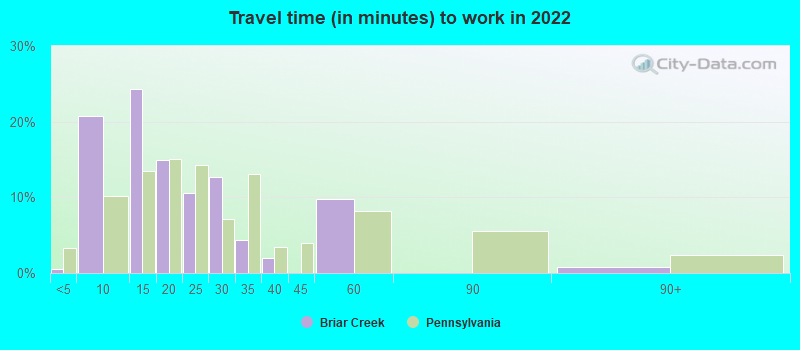
Travel time to work (commute)
- Less than 5 minutes: 6
- 5 to 9 minutes: 38
- 10 to 14 minutes: 54
- 15 to 19 minutes: 36
- 20 to 24 minutes: 54
- 25 to 29 minutes: 0
- 30 to 34 minutes: 5
- 35 to 39 minutes: 3
- 40 to 44 minutes: 2
- 45 to 59 minutes: 15
- 60 to 89 minutes: 2
- 90 or more minutes: 12
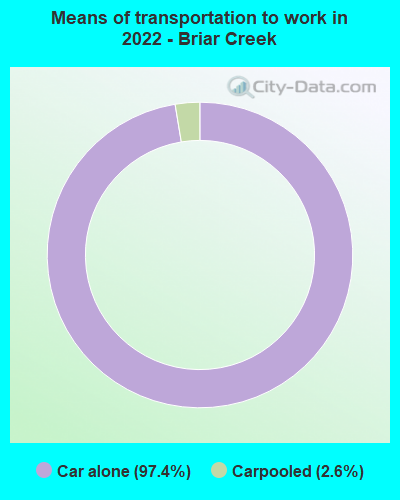
Means of transportation to work:
- Drove a car alone: 289 (90.6%)
- Carpooled: 7 (2.2%)
- Worked at home: 4 (1.3%)

- Unemployment by race in 2022
- Unemployment rate for White non-Hispanic residents
- 3.2%Males
- 44.3%Females
- Unemployment rate for two or more race residents
- 100.0%Females
- Unemployment rate for Hispanic or Latino residents
- 100.0%Females
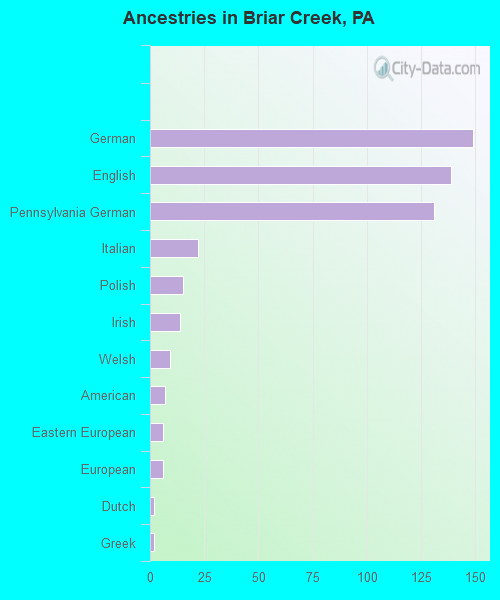
First ancestries reported:
- German: 149 (25.3%)
- English: 139 (23.6%)
- Pennsylvania German: 131 (22.2%)
- Italian: 22 (3.7%)
- Polish: 15 (2.5%)
- Irish: 14 (2.4%)
- Welsh: 9 (1.5%)
- American: 7 (1.2%)
- Eastern European: 6 (1.0%)
- European: 6 (1.0%)
- Dutch: 2 (0.3%)
- Greek: 2 (0.3%)
- French: 1 (0.2%)
- French Canadian: 1 (0.2%)
Most common places of birth for foreign-born residents (%):
| Briar Creek: | 87.1% (27) |
| Pennsylvania: | 5.8% (54,190) |
| Briar Creek: | 3.2% (1) |
| Pennsylvania: | 10.7% (100,596) |
| Briar Creek: | 3.2% (1) |
| Pennsylvania: | 2.2% (21,039) |
Place of birth for U.S.-born residents:
- This state: 832
- Other state: 66
- Northeast: 34
- Midwest: 0
- South: 27
- West: 4
84.8% of Briar Creek residents lived in the same house 1 years ago.
Out of people who lived in different houses, 48.1% lived in this county.
Out of people who lived in different counties, 46.2% lived in Pennsylvania.
| Briar Creek: | 84.8% |
| State average: | 89.3% |
Education attainment for males 25 years and older:
- No schooling: 0
- Nursery to 4th grade: 0
- 5th and 6th grade: 3
- 7th and 8th grade: 1
- 9th grade: 5
- 10th grade: 0
- 11th grade: 27
- 12th grade, no diploma: 0
- High school graduate (or equivalency): 89
- Less than 1 year of college: 7
- Some college more than 1 year, no degree: 34
- Associate degree: 4
- Bachelor's degree: 20
- Master's degree: 3
- Professional school degree: 21
- Doctorate degree: 0

Education attainment for females 25 years and older:
- No schooling: 3
- Nursery to 4th grade: 0
- 5th and 6th grade: 0
- 7th and 8th grade: 0
- 9th grade: 0
- 10th grade: 14
- 11th grade: 13
- 12th grade, no diploma: 2
- High school graduate (or equivalency): 96
- Less than 1 year of college: 58
- Some college more than 1 year, no degree: 53
- Associate degree: 17
- Bachelor's degree: 25
- Master's degree: 8
- Professional school degree: 0
- Doctorate degree: 0


Housing units in structures:
- One, detached: 152
- Two: 2
- 20 to 49: 64
- 50 or more: 39
- Mobile homes: 96
Housing units lacking complete kitchen facilities in 2022: 29.6%
House/condo owner moved in on average 9 years ago
Renter moved in on average 5 years ago

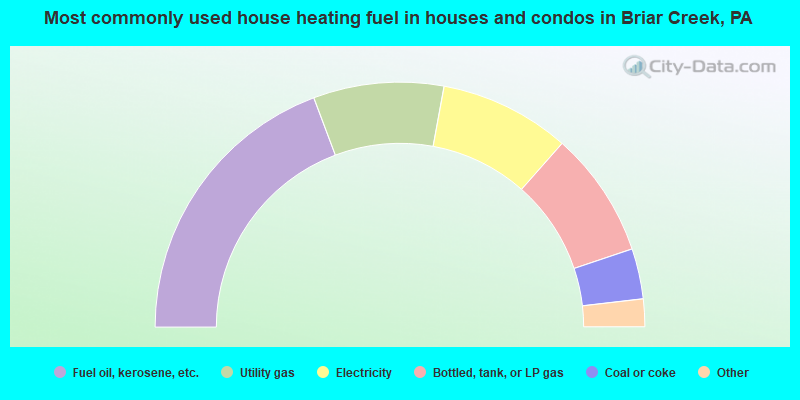
- 38.9%Fuel oil, kerosene, etc.
- 17.4%Utility gas
- 17.4%Electricity
- 16.8%Bottled, tank, or LP gas
- 6.7%Coal or coke
- 2.0%Wood
- 0.7%No fuel used
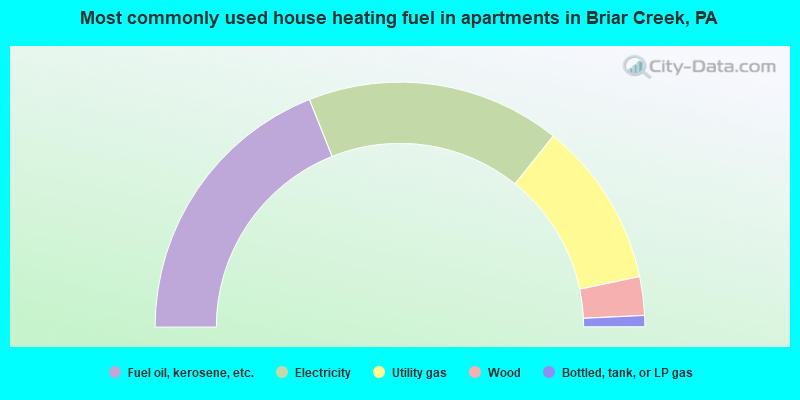
- 38.0%Fuel oil, kerosene, etc.
- 33.6%Electricity
- 21.9%Utility gas
- 5.1%Wood
- 1.5%Bottled, tank, or LP gas
Private vs. public school enrollment:
| Here: | 30.2% |
| Pennsylvania: | 15.7% |
| Here: | 2.4% |
| Pennsylvania: | 13.4% |
| Here: | 0.0% |
| Pennsylvania: | 39.8% |


