Briar, TX (Texas) Houses and Residents
| Briar: | $295,916 |
| Texas: | $275,400 |
Mean price in 2022:
Detached houses: $349,205
Here: $349,205 State: $369,058 Mobile homes: $123,493
Here: $123,493 State: $124,413
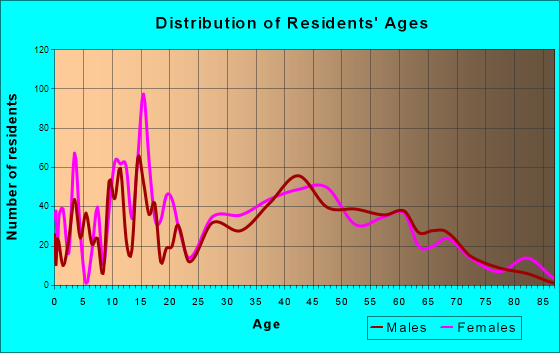
Total population: 5,665 (Urban population: 2,083, Rural population: 3,143 (97 farm, 3,046 nonfarm))
Houses: 2,736 (2,296 occupied: 2,054 owner occupied, 312 renter occupied)
| % of renters here: | 13% |
| State: | 38% |
Housing density: 133 houses/condos per square mile
Median price asked for vacant for-sale houses and condos in 2022: $2,965,734.
Median contract rent in 2022: $760 (lower quartile is $582, upper quartile is $791)
Median rent asked for vacant for-rent units in 2022: $686
Median gross rent in Briar, TX in 2022: $950
Housing units in Briar with a mortgage: 1,119 (8 second mortgage, 0 home equity loan, 9 both second mortgage and home equity loan)
Houses without a mortgage: 0
Median household income for houses/condos with a mortgage: $142,486
Median household income for apartments without a mortgage: $48,624
Median monthly housing costs: $1,129
Compare current foreclosures near Briar, TX:
| Photo | Address | Area | Beds / Baths | Price | Details |
|---|---|---|---|---|---|

|
#1
Squaw Creek Rd
Weatherford, TX 76087
|
3,044 sq. feet
|
3 baths 4 beds |
$551,950
|
show details |

|
#2
Brett Jackson Rd
Fort Worth, TX 76179
|
600 sq. feet
|
1 baths 1 beds |
show details | |

|
#3
Stone Mill Ln
Fort Worth, TX 76179
|
3,250 sq. feet
|
2 baths 4 beds |
show details | |

|
#4
S Melanie Dr
Azle, TX 76020
|
1,316 sq. feet
|
2 baths 3 beds |
show details | |

|
#5
Lionel Way
Fort Worth, TX 76108
|
1,934 sq. feet
|
2 baths 3 beds |
show details | |

|
#6
Middleglen Ct
Haslet, TX 76052
|
3,376 sq. feet
|
2 baths 3 beds |
show details | |

|
#7
Ash Creek Dr W
Azle, TX 76020
|
1,728 sq. feet
|
2 baths 3 beds |
show details | |

|
#8
Maria Dr
Fort Worth, TX 76108
|
1,572 sq. feet
|
2 baths 4 beds |
show details | |

|
#9
Meadowlark Dr
Rhome, TX 76078
|
1,782 sq. feet
|
2 baths 4 beds |
show details | |

|
#10
N Grove St
Fort Worth, TX 76106
|
808 sq. feet
|
1 baths 1 beds |
show details |
| Photo | Address | Area | Beds / Baths | Price | Details |
|---|---|---|---|---|---|

|
#11
Lunayena Road
Rhome, TX 76078
|
- sq. feet
|
2 baths 4 beds |
show details | |

|
#12
Doverglen Dr
Fort Worth, TX 76131
|
- sq. feet
|
2 baths 5 beds |
show details | |

|
#13
Superbloom Ave
Justin, TX 76247
|
3,079 sq. feet
|
3 baths 5 beds |
show details | |

|
#14
Harney Dr
Keller, TX 76244
|
2,027 sq. feet
|
2 baths 4 beds |
show details | |

|
#15
Leather Strap Dr
Haslet, TX 76052
|
3,021 sq. feet
|
2 baths 4 beds |
show details | |

|
#16
Bridal Trl
Fort Worth, TX 76179
|
2,621 sq. feet
|
2 baths 4 beds |
show details | |

|
#17
N Ash Ter
Springtown, TX 76082
|
- sq. feet
|
2 baths 2 beds |
show details | |

|
#18
Ramada Trl
Justin, TX 76247
|
2,609 sq. feet
|
2 baths 4 beds |
show details | |

|
#19
Bridle Ave
Fort Worth, TX 76108
|
1,372 sq. feet
|
1 baths 3 beds |
show details | |

|
#20
Lake Country Dr
Fort Worth, TX 76179
|
4,820 sq. feet
|
3 baths 4 beds |
show details |
| Photo | Address | Area | Beds / Baths | Price | Details |
|---|---|---|---|---|---|

|
#21
Haverly Court
Keller, TX 76244
|
3,279 sq. feet
|
3 baths 4 beds |
show details | |

|
#22
Gill St
Fort Worth, TX 76131
|
1,120 sq. feet
|
1 baths 3 beds |
show details | |

|
#23
Troxell Blvd
Rhome, TX 76078
|
1,664 sq. feet
|
2 baths 3 beds |
show details | |

|
#24
Frances Ann Ct
Haslet, TX 76052
|
2,632 sq. feet
|
2 baths 3 beds |
show details | |

|
#25
Apalachee Trl
Fort Worth, TX 76179
|
2,564 sq. feet
|
2 baths 3 beds |
show details | |

|
#26
Cactus Flower Dr
Fort Worth, TX 76131
|
2,071 sq. feet
|
2 baths 4 beds |
show details | |

|
#27
Big Horn Way
Fort Worth, TX 76137
|
3,237 sq. feet
|
3 baths 5 beds |
show details | |

|
#28
Chris Dr
Keller, TX 76244
|
3,001 sq. feet
|
2 baths 4 beds |
show details | |

|
#29
Mary K Ln
Fort Worth, TX 76108
|
1,224 sq. feet
|
2 baths 3 beds |
show details | |

|
#30
Mary K Ln # K
Fort Worth, TX 76108
|
1,224 sq. feet
|
1 baths 3 beds |
show details |
| Photo | Address | Area | Beds / Baths | Price | Details |
|---|---|---|---|---|---|

|
#31
Cooper Creek Street
Fort Worth, TX 76179
|
3,335 sq. feet
|
3 baths 5 beds |
show details | |

|
#32
Chestnut Ln
Fort Worth, TX 76179
|
- sq. feet
|
3 baths 4 beds |
show details | |

|
#33
Dax Dr
Fort Worth, TX 76135
|
1,994 sq. feet
|
2 baths 3 beds |
show details | |

|
#34
W N Woody Rd
Azle, TX 76020
|
1,872 sq. feet
|
2 baths 4 beds |
show details | |

|
#35
Norris Valley Dr
Fort Worth, TX 76135
|
1,032 sq. feet
|
2 baths 3 beds |
show details | |

|
#36
Roky Ct
Fort Worth, TX 76114
|
2,322 sq. feet
|
4 baths 4 beds |
show details | |

|
#37
Beach Dr
Azle, TX 76020
|
1,843 sq. feet
|
2 baths 4 beds |
show details | |

|
#38
Arbor Lake Rd
Rhome, TX 76078
|
- sq. feet
|
2 baths 4 beds |
show details | |

|
#39
Darlington Trl
Fort Worth, TX 76131
|
3,152 sq. feet
|
3 baths 4 beds |
show details | |

|
#40
Glassenberry St
Keller, TX 76244
|
2,894 sq. feet
|
2 baths 4 beds |
show details |
| Photo | Address | Area | Beds / Baths | Price | Details |
|---|---|---|---|---|---|

|
#41
Saddle Rd
Fort Worth, TX 76108
|
1,773 sq. feet
|
2 baths 3 beds |
show details | |

|
#42
Miranda Dr
Fort Worth, TX 76131
|
2,353 sq. feet
|
2 baths 3 beds |
show details | |

|
#43
Blue Bell Dr
Fort Worth, TX 76108
|
3,315 sq. feet
|
2 baths 3 beds |
show details | |

|
#44
Star Fish St
Keller, TX 76244
|
1,947 sq. feet
|
2 baths 3 beds |
show details | |

|
#45
Meredith Ln
Keller, TX 76244
|
2,506 sq. feet
|
2 baths 3 beds |
show details | |

|
#46
Rockway St
Fort Worth, TX 76108
|
900 sq. feet
|
1 baths 2 beds |
show details | |

|
#47
Mount Pheasant Ct
Fort Worth, TX 76108
|
2,266 sq. feet
|
2 baths 3 beds |
show details | |

|
#48
Georgetown Pl
Keller, TX 76244
|
2,899 sq. feet
|
2 baths 4 beds |
show details | |

|
#49
Fandor St
Fort Worth, TX 76108
|
1,365 sq. feet
|
2 baths 3 beds |
show details | |

|
Check over 1 million property listings on Foreclosure.com!
|
browse all offers | |||

Latest news about housing in Briar, TX collected exclusively by city-data.com from local newspapers, TV, and radio stations

 | Safe condos/townhouses in the Texas Medical Center Area? (49 replies) |
| Best Inner Loop Apartments with Good Schools (19 replies) |
| Looking for advice on Briar Forest area (18 replies) |
| Looking at homes in Willow Bend (1 reply) |
| Looking for input on apartments (4 replies) |
| When does a house become old? (19 replies) |
Median year apartment built: 1980
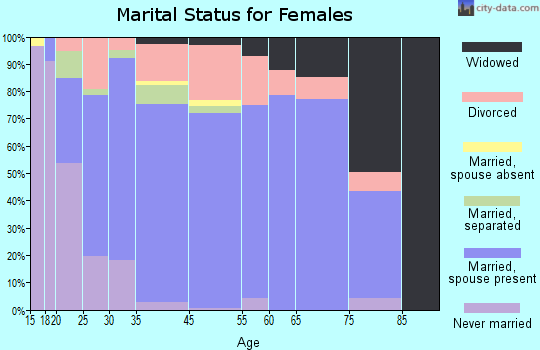
Household type by relationship:
Households: 6,656- Male householders: 926 (164 living alone), Female householders: 1,468 (321 living alone)
1,428 spouses (1,416 opposite-sex spouses), 164 unmarried partners, (164 opposite-sex unmarried partners), 1,946 children (1,889 natural, 39 adopted, 17 stepchildren), 453 grandchildren, 0 brothers or sisters, 118 parents, 0 foster children, 85 other relatives, 64 non-relatives
Size of family households: 725 2-persons, 349 3-persons, 540 4-persons, 66 5-persons, 49 6-persons, 18 7-or-more-persons.
Size of nonfamily households: 502 1-person, 64 2-persons.
670 married couples with children.
345 single-parent households (132 men, 213 women).
89.0% of residents of Briar speak English at home.
10.2% of residents speak Spanish at home (31% speak English very well, 19% speak English well, 20% speak English not well, 30% don't speak English at all).
0.5% of residents speak other Indo-European language at home (100% speak English very well).
0.2% of residents speak Asian or Pacific Island language at home (100% speak English very well).
Foreign born population: 488 (7.3%)
(28.7% of them are naturalized citizens)
| Here: | 6.4 |
| State: | 6.3 |
| Here: | 4.9 |
| State: | 4.0 |

- Bedrooms in owner-occupied houses and condos in Briar, Texas
- 51no bedroom
- 371 bedroom
- 2172 bedrooms
- 1,2223 bedrooms
- 4864 bedrooms
- 425+ bedrooms

- Bedrooms in renter-occupied apartments in Briar, Texas
- 0no bedroom
- 491 bedroom
- 632 bedrooms
- 2013 bedrooms
- 04 bedrooms
- 05+ bedrooms

- Cars and other vehicles available in Briar in owner-occupied houses/condos
- 56no vehicle
- 3851 vehicle
- 9302 vehicles
- 4893 vehicles
- 1114 vehicles
- 825+ vehicles

- Cars and other vehicles available in Briar in renter-occupied apartments
- 46no vehicle
- 1381 vehicle
- 892 vehicles
- 143 vehicles
- 134 vehicles
- 135+ vehicles

- Rooms in owner-occupied houses in Briar, Texas
- 511 room
- 372 rooms
- 03 rooms
- 694 rooms
- 2435 rooms
- 7516 rooms
- 4317 rooms
- 2638 rooms
- 2109+ rooms

- Rooms in renter-occupied apartments in Briar, Texas
- 01 room
- 02 rooms
- 493 rooms
- 254 rooms
- 1455 rooms
- 696 rooms
- 07 rooms
- 08 rooms
- 259+ rooms


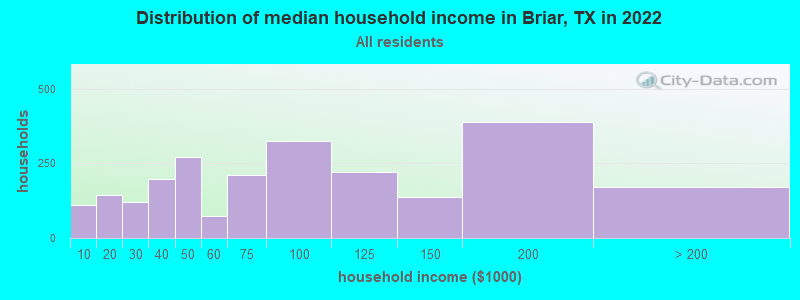
Briar, TX household income distribution

- 112Less than $10,000
- 144$10,000 to $19,999
- 122$20,000 to $29,999
- 197$30,000 to $39,999
- 270$40,000 to $49,999
- 73$50,000 to $59,999
- 211$60,000 to $74,999
- 324$75,000 to $99,999
- 221$100,000 to $124,999
- 137$125,000 to $149,999
- 388$150,000 to $199,999
- 170$200,000 or more
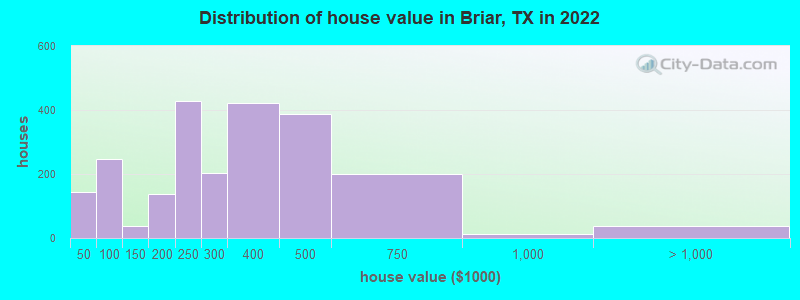
Home value of owner - occupied houses in 2022 in Briar, TX
-
- 71Less than $10,000
- 3$10,000 to $14,999
- 43$20,000 to $24,999
- 24$25,000 to $29,999
- 14$50,000 to $59,999
- 29$70,000 to $79,999
- 139$80,000 to $89,999
- 62$90,000 to $99,999
- 11$100,000 to $124,999
- 25$125,000 to $149,999
- 87$150,000 to $174,999
- 48$175,000 to $199,999
- 428$200,000 to $249,999
- 202$250,000 to $299,999
- 421$300,000 to $399,999
- 385$400,000 to $499,999
- 200$500,000 to $749,999
- 13$750,000 to $999,999
- 9$1,000,000 to $1,499,999
- 26$2,000,000 or more
Rent paid by renters in 2022 in Briar, TX
-
- 10$450 to $499
- 42$500 to $549
- 23$550 to $599
- 60$650 to $699
- 20$700 to $749
- 7$750 to $799
- 12$800 to $899
- 43$1,000 to $1,249
- 75No cash rent


Percentage of workers working in this county: 57.1%
Number of people working at home: 415 (13.0% of all workers)
Travel time to work (commute)
- Less than 5 minutes: 13
- 5 to 9 minutes: 58
- 10 to 14 minutes: 319
- 15 to 19 minutes: 117
- 20 to 24 minutes: 109
- 25 to 29 minutes: 29
- 30 to 34 minutes: 447
- 35 to 39 minutes: 207
- 40 to 44 minutes: 207
- 45 to 59 minutes: 623
- 60 to 89 minutes: 426
- 90 or more minutes: 53
Means of transportation to work:
- Drove a car alone: 2,106 (81.3%)
- Carpooled: 385 (14.9%)
- Bus or trolley bus: 13 (0.5%)
- Walked: 19 (0.7%)
- Other means: 16 (0.6%)
- Worked at home: 51 (2.0%)

- Unemployment by race in 2022
- Unemployment rate for White non-Hispanic residents
- 1.4%Males
- 1.9%Females
- Unemployment rate for American Indian and Alaska Native residents
- 100.0%Females
- Unemployment rate for Asian residents
- 100.0%Females

- Year of entry for the foreign-born population in Briar, Texas
- 2152010 or later
- 1362000 to 2009
- 241990 to 1999
- 131980 to 1989
- 131970 to 1979
- 21Before 1970

First ancestries reported:
- English: 826 (26.8%)
- American: 348 (11.3%)
- Irish: 304 (9.8%)
- German: 252 (8.2%)
- Hungarian: 162 (5.2%)
- European: 98 (3.2%)
- French: 80 (2.6%)
- Italian: 47 (1.5%)
- Czech: 36 (1.2%)
- Dutch: 22 (0.7%)
- Scottish: 22 (0.7%)
- French Canadian: 19 (0.6%)
- Scotch-Irish: 11 (0.4%)
- Celtic: 8 (0.3%)
- British: 6 (0.2%)
Most common places of birth for foreign-born residents (%):
| Briar: | 58.1% (259) |
| Texas: | 48.4% (2,411,723) |
| Briar: | 45.3% (202) |
| Texas: | 3.0% (147,182) |
| Briar: | 1.6% (7) |
| Texas: | 0.8% (37,989) |
Place of birth for U.S.-born residents:
- This state: 3,660
- Other state: 2,348
- Northeast: 431
- Midwest: 877
- South: 287
- West: 825
87.8% of Briar residents lived in the same house 1 years ago.
Out of people who lived in different houses, 13.8% lived in this county.
Out of people who lived in different counties, 100.0% lived in Texas.
| Briar: | 87.8% |
| State average: | 85.7% |
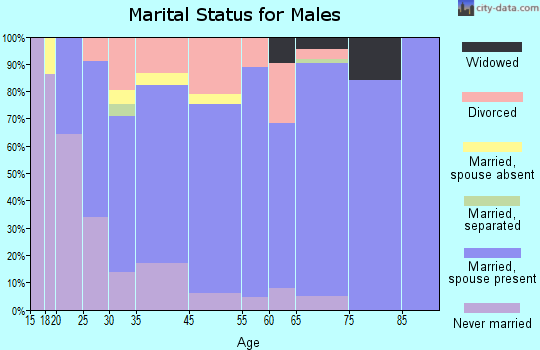
Education attainment for males 25 years and older:
- No schooling: 79
- Nursery to 4th grade: 0
- 5th and 6th grade: 17
- 7th and 8th grade: 51
- 9th grade: 53
- 10th grade: 32
- 11th grade: 0
- 12th grade, no diploma: 0
- High school graduate (or equivalency): 813
- Less than 1 year of college: 254
- Some college more than 1 year, no degree: 224
- Associate degree: 73
- Bachelor's degree: 369
- Master's degree: 90
- Professional school degree: 0
- Doctorate degree: 0

Education attainment for females 25 years and older:
- No schooling: 74
- Nursery to 4th grade: 0
- 5th and 6th grade: 38
- 7th and 8th grade: 0
- 9th grade: 32
- 10th grade: 27
- 11th grade: 0
- 12th grade, no diploma: 46
- High school graduate (or equivalency): 1,188
- Less than 1 year of college: 171
- Some college more than 1 year, no degree: 355
- Associate degree: 134
- Bachelor's degree: 344
- Master's degree: 164
- Professional school degree: 15
- Doctorate degree: 0

Housing units in structures:
- One, detached: 2,012
- One, attached: 18
- Two: 12
- Mobile homes: 711
- Boats, RVs, vans, etc.: 24
Median worth of mobile homes: $166,497
House/condo owner moved in on average 7 years ago
Renter moved in on average 6 years ago

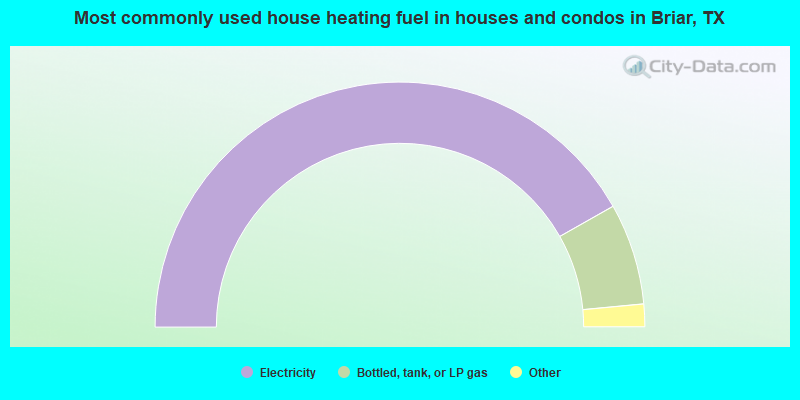
- 83.6%Electricity
- 13.4%Bottled, tank, or LP gas
- 1.0%Wood
- 0.7%No fuel used
- 0.6%Utility gas
- 0.6%Other fuel
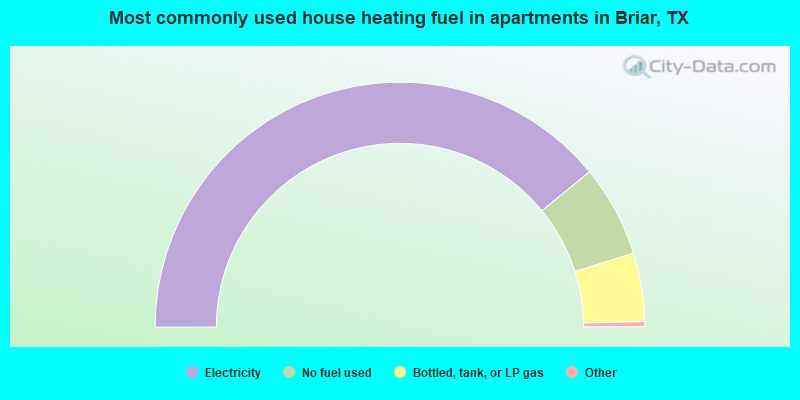
- 78.7%Electricity
- 12.2%No fuel used
- 9.1%Bottled, tank, or LP gas
Private vs. public school enrollment:
| Here: | 2.4% |
| Texas: | 8.8% |
| Here: | 0.0% |
| Texas: | 8.0% |
| Here: | 38.0% |
| Texas: | 16.2% |


