Bridgewater, MA (Massachusetts) Houses and Residents
Estimated median house or condo value in 2022: $458,727 (it was $147,300 in 2000 )
Bridgewater:
$458,727Massachusetts:
$534,700
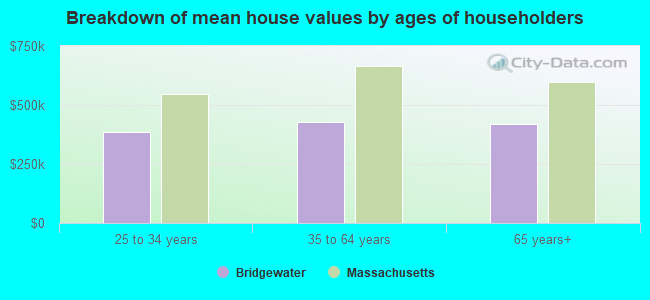
Lower value quartile - upper value quartile: $389,385 - $620,840Mean price in 2022: Detached houses: $527,232 Here:
$527,232State:
$651,570
Townhouses or other attached units: $309,953 Here:
$309,953State:
$617,749
In 2-unit structures: $352,439 Here:
$352,439State:
$594,808
In 3-to-4-unit structures: $384,002 Here:
$384,002State:
$601,912
In 5-or-more-unit structures: $180,716 Here:
$180,716State:
$555,768
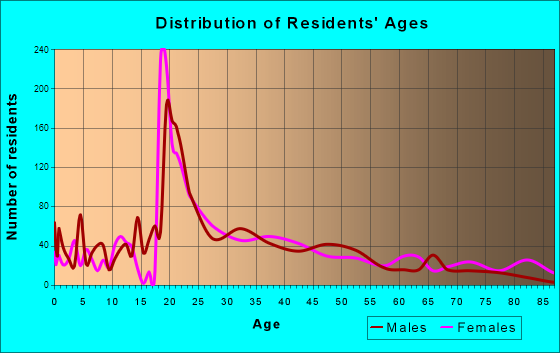
Total population: 7,841 (Urban population: 6,602, Rural population: 0)
Houses: 2,932 (2,676 occupied: 911 owner occupied, 1,812 renter occupied )
% of renters here:
67%State:
38%
Housing density: 1,333 houses/condos per square mile
Median price asked for vacant for-sale houses and condos in 2022: $930,159.
Median contract rent in 2022: $1,617 (lower quartile is $1,234, upper quartile is over $2,000)
Median rent asked for vacant for-rent units in 2022: $6,226
Median gross rent in Bridgewater, MA in 2022: $1,838
Housing units in Bridgewater with a mortgage: 464 (13 second mortgage, 8 home equity loan, 0 both second mortgage and home equity loan )Houses without a mortgage: 402
Median household income for houses/condos with a mortgage: $136,940
Median household income for apartments without a mortgage: $90,535
Median monthly housing costs: $1,785
Data:
Median house or condo value ($)
Median house or condo value ($ change since 2000)
Median house or condo value ($) - White
Median house or condo value ($) - Black or African American
Median house or condo value ($) - Asian
Median house or condo value ($) - Hispanic or Latino
Median house or condo value ($) - American Indian and Alaska Native
Median house or condo value ($) - Multirace
Median house or condo value ($) - Other Race
Median price asked for mobile homes ($)
Household density (households per square mile)
Mean house or condo value by units in structure - 1, detached ($)
Mean house or condo value by units in structure - 1, attached ($)
Mean house or condo value by units in structure - 2 ($)
Mean house or condo value by units in structure by units in structure - 3 or 4 ($)
Mean house or condo value by units in structure - 5 or more ($)
Mean house or condo value by units in structure - Boat, RV, van, etc. ($)
Mean house or condo value by units in structure - Mobile home ($)
Median contract rent ($)
Median contract rent - Lower quartile ($)
Median contract rent - Upper quartile ($)
Median gross rent ($)
Urban houses (%)
Rural houses (%)
Houses occupied (%)
Houses occupied (% change since 2000)
Houses owner occupied (%)
Houses owner occupied (% change since 2000)
Houses renter occupied (%)
Houses renter occupied (% change since 2000)
Vacant housing units - For rent (%)
Vacant housing units - For rent (% change since 2000)
Vacant housing units - For sale only (%)
Vacant housing units - For sale only (% change since 2000)
Vacant housing units - Rented or sold, not occupied (%)
Vacant housing units - Rented or sold, not occupied (% change since 2000)
Vacant housing units - For seasonal, recreational, or occasional use (%)
Vacant housing units - For seasonal, recreational, or occasional use (% change since 2000)
Vacant housing units - For migrant workers (%)
Vacant housing units - For migrant workers (% change since 2000)
Vacant housing units - Other vacant (%)
Vacant housing units - Other vacant (% change since 2000)
Median monthly housing costs ($)
Median household income for houses/condos with a mortgage ($)
Median household income for houses/condos without a mortgage ($)
Median household income ($)
Median household income ($) - White
Median household income ($) - Black or African American
Median household income ($) - Asian
Median household income ($) - Hispanic or Latino
Median household income ($) - American Indian and Alaska Native
Median household income ($) - Multirace
Median household income ($) - Other Race
Mortgage status - with mortgage (%)
Mortgage status - with second mortgage (%)
Mortgage status - with home equity loan (%)
Mortgage status - with both second mortgage and home equity loan (%)
Mortgage status - without a mortgage (%)
Median year house/condo built
Median year apartment built
Household type by relationship - Male householder living alone (%)
Household type by relationship - Male householder not living alone (%)
Household type by relationship - Female householder living alone (%)
Household type by relationship - Female householder not living alone (%)
Household type by relationship - Opposite-Sex spouse (%)
Household type by relationship - Same-Sex spouse (%)
Household type by relationship - Opposite-Sex unmarried partner (%)
Household type by relationship - Same-Sex unmarried partner (%)
Household type by relationship - In group quarters (%)
Size of family households - 2-person household (%)
Size of family households - 3-person household (%)
Size of family households - 4-person household (%)
Size of family households - 5-person household (%)
Size of family households - 6-person household (%)
Size of family households - 7-or-more-person household (%)
Size of nonfamily households - 1-person household (%)
Size of nonfamily households - 2-person household (%)
Size of nonfamily households - 3-person household (%)
Size of nonfamily households - 4-person household (%)
Size of nonfamily households - 5-person household (%)
Size of nonfamily households - 6-person household (%)
Size of nonfamily households - 7-or-moreperson household (%)
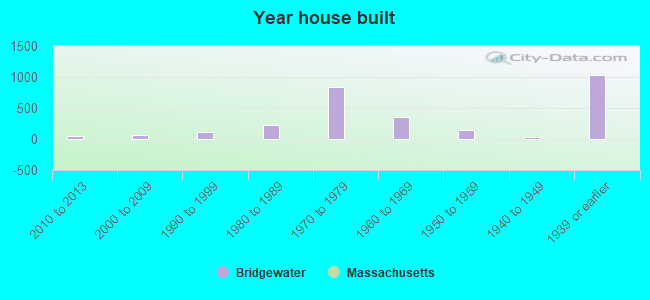
Year house built - Built 2010 or later (%)
Year house built - Built 2000 to 2009 (%)
Year house built - Built 1990 to 1999 (%)
Year house built - Built 1980 to 1989 (%)
Year house built - Built 1970 to 1979 (%)
Year house built - Built 1960 to 1969 (%)
Year house built - Built 1950 to 1959 (%)
Year house built - Built 1940 to 1949 (%)
Year house built - Built 1939 or earlier (%)
Median number of rooms in houses and condos
Median number of rooms in apartments
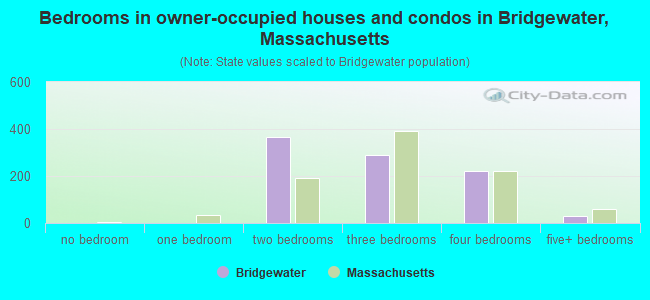
Median number of bedrooms in owner occupied houses
Mean number of bedrooms in owner occupied houses
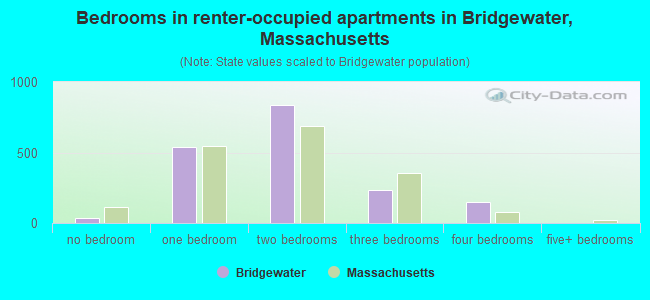
Median number of bedrooms in renter occupied houses
Mean number of bedrooms in renter occupied houses
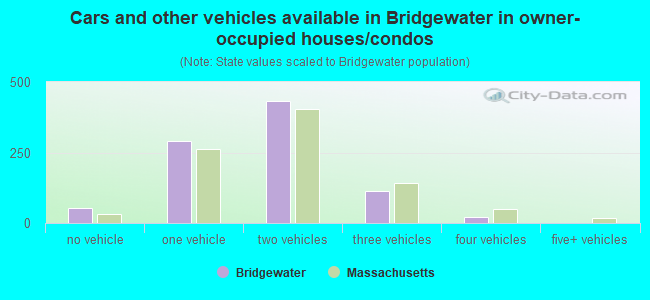
Median number of vehichles in owner occupied houses
Mean number of vehichles in owner occupied houses
Median number of vehichles in renter occupied houses
Mean number of vehichles in renter occupied houses
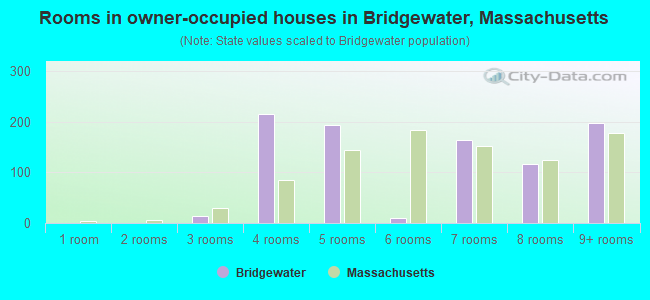
Rooms in owner-occupied houses - 1 room (%)
Rooms in owner-occupied houses - 2 rooms (%)
Rooms in owner-occupied houses - 3 rooms (%)
Rooms in owner-occupied houses - 4 rooms (%)
Rooms in owner-occupied houses - 5 rooms (%)
Rooms in owner-occupied houses - 6 rooms (%)
Rooms in owner-occupied houses - 7 rooms (%)
Rooms in owner-occupied houses - 8 rooms (%)
Rooms in owner-occupied houses - 9+ rooms (%)
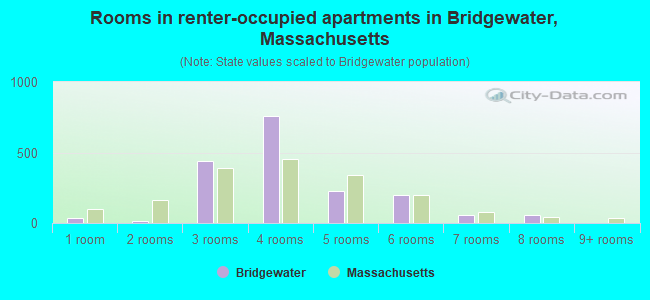
Rooms in renter-occupied houses - 1 room (%)
Rooms in renter-occupied houses - 2 rooms (%)
Rooms in renter-occupied houses - 3 rooms (%)
Rooms in renter-occupied houses - 4 rooms (%)
Rooms in renter-occupied houses - 5 rooms (%)
Rooms in renter-occupied houses - 6 rooms (%)
Rooms in renter-occupied houses - 7 rooms (%)
Rooms in renter-occupied houses - 8 rooms (%)
Rooms in renter-occupied houses - 9+ rooms (%)
Bedrooms in owner-occupied houses - no bedrooms (%)
Bedrooms in owner-occupied houses - 1 bedroom (%)
Bedrooms in owner-occupied houses - 2 bedrooms (%)
Bedrooms in owner-occupied houses - 3 bedrooms (%)
Bedrooms in owner-occupied houses - 4 bedrooms (%)
Bedrooms in owner-occupied houses - 5+ bedrooms (%)
Bedrooms in renter-occupied houses - no bedrooms (%)
Bedrooms in renter-occupied houses - 1 bedroom (%)
Bedrooms in renter-occupied houses - 2 bedrooms (%)
Bedrooms in renter-occupied houses - 3 bedrooms (%)
Bedrooms in renter-occupied houses - 4 bedrooms (%)
Bedrooms in renter-occupied houses - 5+ bedrooms (%)
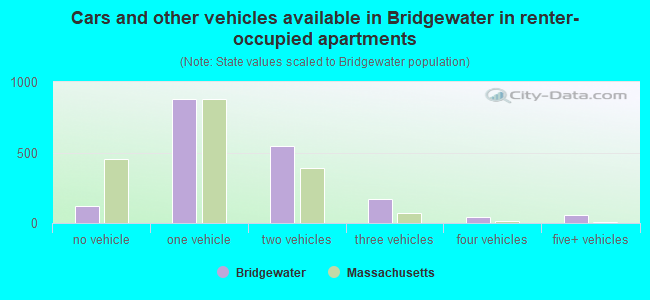
Vehicles available in owner-occupied houses - no vehicle available (%)
Vehicles available in owner-occupied houses - 1 vehicle available(%)
Vehicles available in owner-occupied houses - 2 Vehicles available (%)
Vehicles available in owner-occupied houses - 3 Vehicles available (%)
Vehicles available in owner-occupied houses - 4 Vehicles available (%)
Vehicles available in owner-occupied houses - 5+ Vehicles available (%)
Vehicles available in renter-occupied houses - no vehicle available (%)
Vehicles available in renter-occupied houses - 1 vehicle available (%)
Vehicles available in renter-occupied houses - 2 Vehicles available (%)
Vehicles available in renter-occupied houses - 3 Vehicles available (%)
Vehicles available in renter-occupied houses - 4 Vehicles available (%)
Vehicles available in renter-occupied houses - 5+ Vehicles available (%)
Housing units in structures - 1, detached (%)
Housing units in structures - 1, attached (%)
Housing units in structures - 2 (%)
Housing units in structures - 3 or 4 (%)
Housing units in structures - 5 to 9 (%)
Housing units in structures - 10 to 19 (%)
Housing units in structures - 20 to 49 (%)
Housing units in structures - 50 or more (%)
Housing units in structures - Mobile home (%)
Housing units in structures - Boat, RV, van, etc. (%)
Housing units in structures - Owners - 1, detached (%)
Housing units in structures - Owners - 1, attached (%)
Housing units in structures - Owners - 2 (%)
Housing units in structures - Owners - 3 or 4 (%)
Housing units in structures - Owners - 5 to 9 (%)
Housing units in structures - Owners - 10 to 19 (%)
Housing units in structures - Owners - 20 to 49 (%)
Housing units in structures - Owners - 50 or more (%)
Housing units in structures - Owners - Mobile home (%)
Housing units in structures - Owners - Boat, RV, van, etc. (%)
Housing units in structures - Renters - 1, detached (%)
Housing units in structures - Renters - 1, attached (%)
Housing units in structures - Renters - 2 (%)
Housing units in structures - Renters - 3 or 4 (%)
Housing units in structures - Renters - 5 to 9 (%)
Housing units in structures - Renters - 10 to 19 (%)
Housing units in structures - Renters - 20 to 49 (%)
Housing units in structures - Renters - 50 or more (%)
Housing units in structures - Renters - Mobile home (%)
Housing units in structures - Renters - Boat, RV, van, etc. (%)
House/condo owner moved in on average (years ago)
Renter moved in on average (years ago)
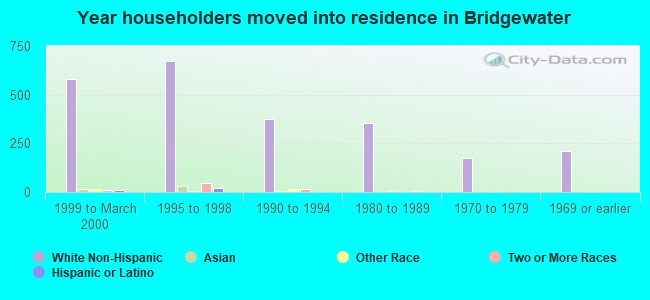
Year householder moved into unit - Moved in 1999 to March 2000 (%)
Year householder moved into unit - Moved in 1999 to March 2000 (%) - White
Year householder moved into unit - Moved in 1999 to March 2000 (%) - Black or African American
Year householder moved into unit - Moved in 1999 to March 2000 (%) - Asian
Year householder moved into unit - Moved in 1999 to March 2000 (%) - Hispanic or Latino
Year householder moved into unit - Moved in 1999 to March 2000 (%) - American Indian and Alaska Native
Year householder moved into unit - Moved in 1999 to March 2000 (%) - Multirace
Year householder moved into unit - Moved in 1999 to March 2000 (%) - Other Race
Year householder moved into unit - Moved in 1995 to 1998 (%)
Year householder moved into unit - Moved in 1995 to 1998 (%) - White
Year householder moved into unit - Moved in 1995 to 1998 (%) - Black or African American
Year householder moved into unit - Moved in 1995 to 1998 (%) - Asian
Year householder moved into unit - Moved in 1995 to 1998 (%) - Hispanic or Latino
Year householder moved into unit - Moved in 1995 to 1998 (%) - American Indian and Alaska Native
Year householder moved into unit - Moved in 1995 to 1998 (%) - Multirace
Year householder moved into unit - Moved in 1995 to 1998 (%) - Other Race
Year householder moved into unit - Moved in 1990 to 1994 (%)
Year householder moved into unit - Moved in 1990 to 1994 (%) - White
Year householder moved into unit - Moved in 1990 to 1994 (%) - Black or African American
Year householder moved into unit - Moved in 1990 to 1994 (%) - Asian
Year householder moved into unit - Moved in 1990 to 1994 (%) - Hispanic or Latino
Year householder moved into unit - Moved in 1990 to 1994 (%) - American Indian and Alaska Native
Year householder moved into unit - Moved in 1990 to 1994 (%) - Multirace
Year householder moved into unit - Moved in 1990 to 1994 (%) - Other Race
Year householder moved into unit - Moved in 1980 to 1989 (%)
Year householder moved into unit - Moved in 1980 to 1989 (%) - White
Year householder moved into unit - Moved in 1980 to 1989 (%) - Black or African American
Year householder moved into unit - Moved in 1980 to 1989 (%) - Asian
Year householder moved into unit - Moved in 1980 to 1989 (%) - Hispanic or Latino
Year householder moved into unit - Moved in 1980 to 1989 (%) - American Indian and Alaska Native
Year householder moved into unit - Moved in 1980 to 1989 (%) - Multirace
Year householder moved into unit - Moved in 1980 to 1989 (%) - Other Race
Year householder moved into unit - Moved in 1970 to 1979 (%)
Year householder moved into unit - Moved in 1970 to 1979 (%) - White
Year householder moved into unit - Moved in 1970 to 1979 (%) - Black or African American
Year householder moved into unit - Moved in 1970 to 1979 (%) - Asian
Year householder moved into unit - Moved in 1970 to 1979 (%) - Hispanic or Latino
Year householder moved into unit - Moved in 1970 to 1979 (%) - American Indian and Alaska Native
Year householder moved into unit - Moved in 1970 to 1979 (%) - Multirace
Year householder moved into unit - Moved in 1970 to 1979 (%) - Other Race
Year householder moved into unit - Moved in 1969 or earlier (%)
Year householder moved into unit - Moved in 1969 or earlier (%) - White
Year householder moved into unit - Moved in 1969 or earlier (%) - Black or African American
Year householder moved into unit - Moved in 1969 or earlier (%) - Asian
Year householder moved into unit - Moved in 1969 or earlier (%) - Hispanic or Latino
Year householder moved into unit - Moved in 1969 or earlier (%) - American Indian and Alaska Native
Year householder moved into unit - Moved in 1969 or earlier (%) - Multirace
Year householder moved into unit - Moved in 1969 or earlier (%) - Other Race
Housing units lacking complete plumbing facilities (%)
Housing units lacking complete kitchen facilities (%)
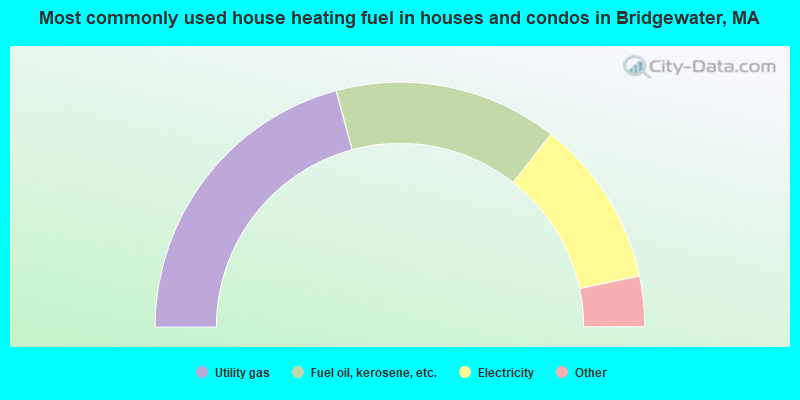
House heating fuel used in houses and condos - Utility gas (%)
House heating fuel used in houses and condos - Bottled, tank, or LP gas (%)
House heating fuel used in houses and condos - Electricity (%)
House heating fuel used in houses and condos - Fuel oil, kerosene, etc. (%)
House heating fuel used in houses and condos - Coal or coke (%)
House heating fuel used in houses and condos - Wood (%)
House heating fuel used in houses and condos - Solar energy (%)
House heating fuel used in houses and condos - Other fuel (%)
House heating fuel used in houses and condos - No fuel used (%)
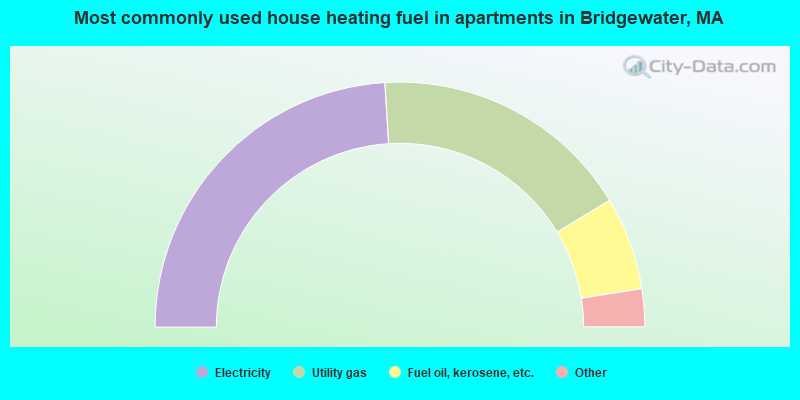
House heating fuel used in apartments - Utility gas (%)
House heating fuel used in apartments - Bottled, tank, or LP gas (%)
House heating fuel used in apartments - Electricity (%)
House heating fuel used in apartments - Fuel oil, kerosene, etc. (%)
House heating fuel used in apartments - Coal or coke (%)
House heating fuel used in apartments - Wood (%)
House heating fuel used in apartments - Solar energy (%)
House heating fuel used in apartments - Other fuel (%)
House heating fuel used in apartments - No fuel used (%)
Latest news about housing in Bridgewater, MA collected exclusively by city-data.com from local newspapers, TV, and radio stations
Median year house/condo built: 1955Median year apartment built: 1976Household type by relationship:
Households: 9,363
In family households: 3,806 (684 male householders , 539 female householders )
744 spouses , 1,413 children (1,341 natural , 57 adopted , 14 stepchildren ), 105 grandchildren , 24 brothers or sisters , 111 parents , 0 foster children , 74 other relatives , 108 non-relatives In nonfamily households: 2,465 (844 male householders (605 living alone )), 505 female householders (307 living alone )), 1,114 nonrelatives In group quarters: 3,091
Size of family households: 534 2-persons , 300 3-persons , 322 4-persons , 72 5-persons , 7 6-persons , 9 7-or-more-persons .
Size of nonfamily households: 1,014 1-person , 216 2-persons , 108 3-persons , 181 4-persons , 4 5-persons , 53 6-persons .
437 married couples with children. single-parent households (472 men , 138 women ).
87.4% of residents of Bridgewater speak English at home. of residents speak Spanish at home (74% speak English very well , 26% speak English well ).of residents speak other Indo-European language at home (78% speak English very well , 16% speak English well , 6% speak English not well ).of residents speak Asian or Pacific Island language at home (48% speak English very well , 22% speak English well , 30% speak English not well ).of residents speak other language at home (100% speak English very well ).
Foreign born population: 488 (5.1%)of them are naturalized citizens )
Median number of rooms in houses and condos:
Median number of rooms in apartments
Bridgewater, MA household income distribution 178 Less than $10,000151 $10,000 to $19,999162 $20,000 to $29,999147 $30,000 to $39,999243 $40,000 to $49,999112 $50,000 to $59,999256 $60,000 to $74,999320 $75,000 to $99,999332 $100,000 to $124,999149 $125,000 to $149,999143 $150,000 to $199,999290 $200,000 or more
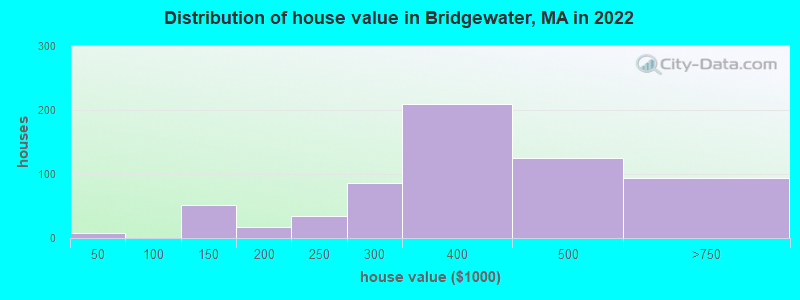
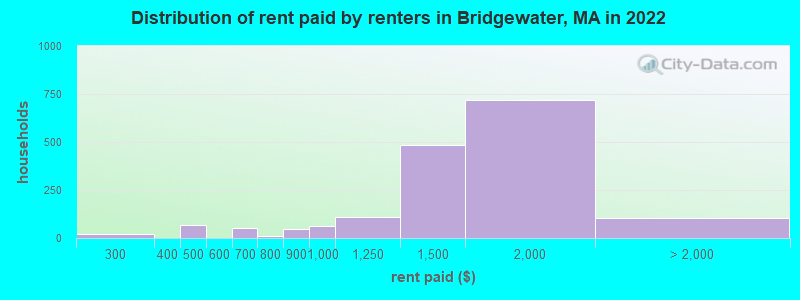
Home value of owner - occupied houses in 2022 in Bridgewater, MA 7 Less than $10,0009 $100,000 to $124,99942 $125,000 to $149,9993 $150,000 to $174,99912 $175,000 to $199,99934 $200,000 to $249,99985 $250,000 to $299,999209 $300,000 to $399,999124 $400,000 to $499,99992 $500,000 to $749,999Rent paid by renters in 2022 in Bridgewater, MA 8 $200 to $24911 $250 to $29936 $400 to $44931 $450 to $49918 $600 to $64934 $650 to $6991 $700 to $7499 $750 to $79947 $800 to $89959 $900 to $999111 $1,000 to $1,249484 $1,250 to $1,499716 $1,500 to $1,99986 $2,000 to $2,49916 No cash rent
Percentage of workers working in this county: 68.3%Number of people working at home: 481 (9.5% of all workers )
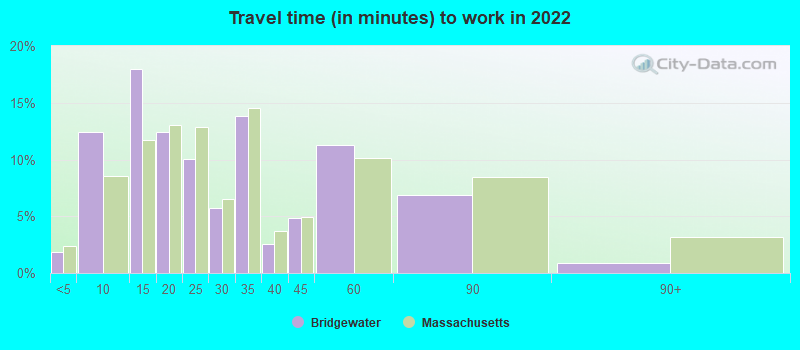
Travel time to work (commute)
Less than 5 minutes: 1305 to 9 minutes: 44810 to 14 minutes: 87915 to 19 minutes: 31720 to 24 minutes: 63325 to 29 minutes: 32730 to 34 minutes: 45335 to 39 minutes: 8040 to 44 minutes: 14445 to 59 minutes: 50860 to 89 minutes: 28590 or more minutes: 135
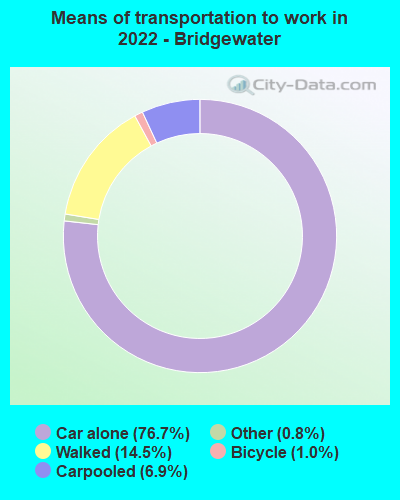
Means of transportation to work:
Drove a car alone: 3,146 (67.7%)Carpooled: 284 (6.1%)Taxi: 47 (1.0%)Bicycle: 41 (0.9%)Walked: 598 (12.9%)Worked at home: 474 (10.2%)
Unemployment by race in 2022
Unemployment rate for White non-Hispanic residents 10.6% Males5.9% FemalesUnemployment rate for Black residents 7.8% Males3.8% FemalesUnemployment rate for Asian residents 5.4% MalesUnemployment rate for two or more race residents 41.8% Males8.2% Females
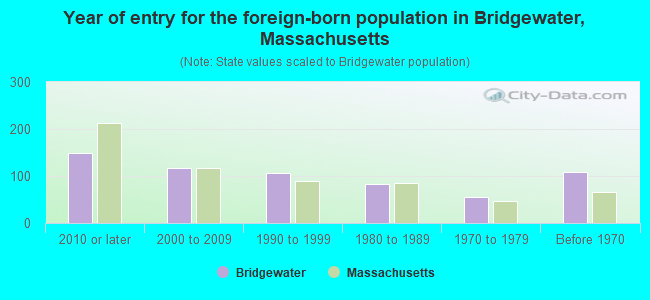
Year of entry for the foreign-born population in Bridgewater, Massachusetts
148 2010 or later 116 2000 to 2009 106 1990 to 1999 82 1980 to 1989 56 1970 to 1979 109 Before 1970
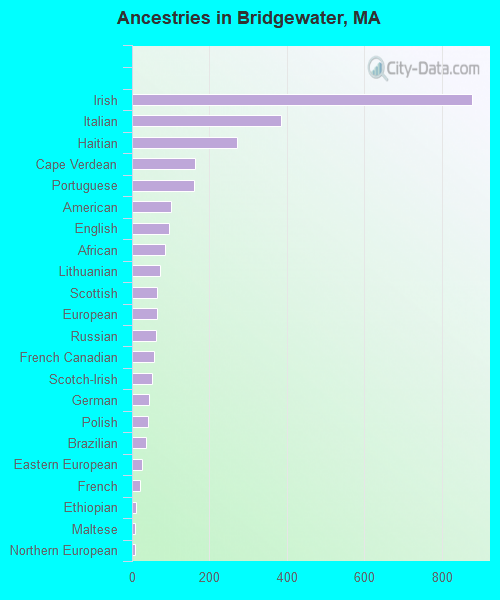
First ancestries reported:
Irish: 878 (23.3%)
Italian: 386 (10.2%)
Haitian: 271 (7.2%)
Cape Verdean: 163 (4.3%)
Portuguese: 159 (4.2%)
American: 100 (2.7%)
English: 96 (2.5%)
African: 84 (2.2%)
Lithuanian: 73 (1.9%)
Scottish: 65 (1.7%)
European: 64 (1.7%)
Russian: 61 (1.6%)
French Canadian: 58 (1.5%)
Scotch-Irish: 51 (1.4%)
German: 44 (1.2%)
Polish: 41 (1.1%)
Brazilian: 35 (0.9%)
Eastern European: 27 (0.7%)
French: 21 (0.6%)
Ethiopian: 10 (0.3%)
Maltese: 9 (0.2%)
Northern European: 9 (0.2%)
Armenian: 4 (0.1%)
Lebanese: 3 (0.08%)
Greek: 3 (0.08%) Most common places of birth for foreign-born residents (%): Haiti Bridgewater:
31.2% (134)Massachusetts:
100.0% (-1)
China, excluding Hong Kong and Taiwan Bridgewater:
16.5% (71)Massachusetts:
100.0% (-1)
Other Western Africa Bridgewater:
7.2% (31)Massachusetts:
100.0% (-1)
United Kingdom, excluding England and Scotland Bridgewater:
5.8% (25)Massachusetts:
100.0% (-1)
Kenya Bridgewater:
5.6% (24)Massachusetts:
100.0% (-1)
Guatemala Bridgewater:
4.9% (21)Massachusetts:
100.0% (-1)
Cabo Verde Bridgewater:
4.7% (20)Massachusetts:
100.0% (-1)
Australia Bridgewater:
4.2% (18)Massachusetts:
100.0% (-1)
Philippines Bridgewater:
3.7% (16)Massachusetts:
100.0% (-1)
Portugal Bridgewater:
3.7% (16)Massachusetts:
100.0% (-1)
Ethiopia Bridgewater:
1.9% (8)Massachusetts:
100.0% (-1)
France Bridgewater:
1.6% (7)Massachusetts:
100.0% (-1)
Thailand Bridgewater:
1.6% (7)Massachusetts:
100.0% (-1)
Vietnam Bridgewater:
1.6% (7)Massachusetts:
100.0% (-1)
Africa, n.e.c. Bridgewater:
1.6% (7)Massachusetts:
100.0% (-1)
Place of birth for U.S.-born residents:
This state: 7,485Other state: 1,337Northeast: 652Midwest: 200South: 291West: 188 73.1% of Bridgewater residents lived in the same house 1 years ago.
Out of people who lived in different houses, 32.4% lived in this county.
Out of people who lived in different counties, 83.9% lived in Massachusetts.
Bridgewater:
73.1%State average:
87.7%
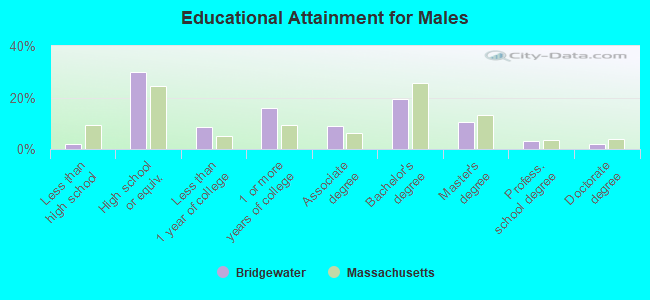
Education attainment for males 25 years and older:
No schooling: 0Nursery to 4th grade: 05th and 6th grade: 07th and 8th grade: 09th grade: 3610th grade: 011th grade: 012th grade, no diploma: 0High school graduate (or equivalency): 538Less than 1 year of college: 152Some college more than 1 year, no degree: 284Associate degree: 160Bachelor's degree: 349Master's degree: 186Professional school degree: 53Doctorate degree: 35
Education attainment for females 25 years and older:
No schooling: 65Nursery to 4th grade: 05th and 6th grade: 37th and 8th grade: 29th grade: 1410th grade: 1711th grade: 1612th grade, no diploma: 0High school graduate (or equivalency): 332Less than 1 year of college: 135Some college more than 1 year, no degree: 158Associate degree: 249Bachelor's degree: 631Master's degree: 218Professional school degree: 41Doctorate degree: 124
Housing units in structures:
One, detached: 663One, attached: 120Two: 4313 or 4: 4595 to 9: 25010 to 19: 78120 to 49: 22450 or more: 15Housing units lacking complete plumbing facilities in 2022: 1.5%Housing units lacking complete kitchen facilities in 2022: 2.0%House/condo owner moved in on average 13 years ago
Renter moved in on average 1 years ago
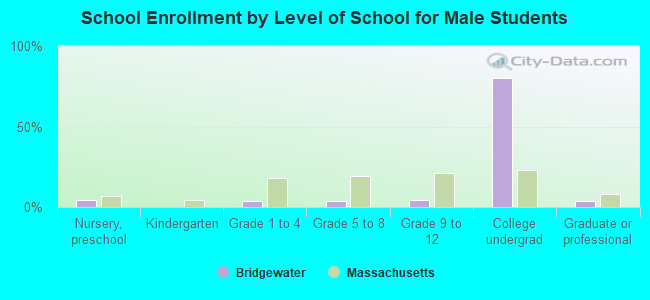
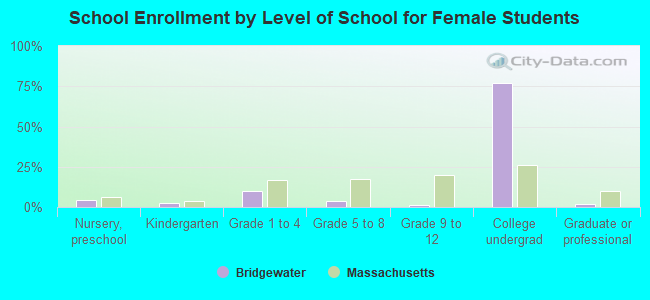
Private vs. public school enrollment:
Students in private schools in grades 1 to 8 (elementary and middle school): 0 Here:
0.0%Massachusetts:
10.3%
Students in private schools in grades 9 to 12 (high school): 34 Here:
26.8%Massachusetts:
12.3%
Students in private undergraduate colleges: 159 Here:
4.3%Massachusetts:
51.2%