Brighton, IL (Illinois) Houses and Residents
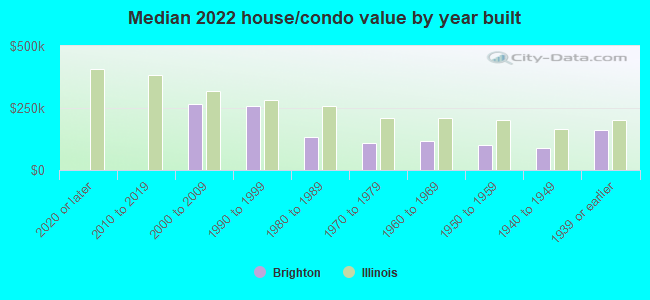
| Brighton: | $127,852 |
| Illinois: | $251,600 |
Total population: 2,217 (Urban population: 0, Rural population: 2,201 (all nonfarm))
Houses: 973 (835 occupied: 704 owner occupied, 142 renter occupied)
| % of renters here: | 17% |
| State: | 33% |
Housing density: 604 houses/condos per square mile
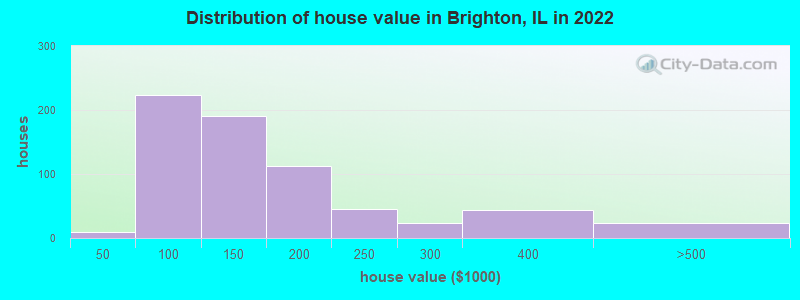
Median price asked for vacant for-sale houses and condos in 2022: $194,142.
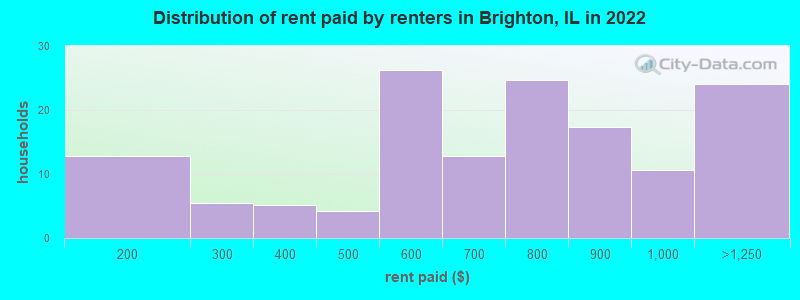
Median contract rent in 2022: $708 (lower quartile is $512, upper quartile is $898)
Median rent asked for vacant for-rent units in 2022: $1,874
Median gross rent in Brighton, IL in 2022: $893
Housing units in Brighton with a mortgage: 430 (27 second mortgage, 0 home equity loan, 28 both second mortgage and home equity loan)
Houses without a mortgage: 29
Median household income for houses/condos with a mortgage: $94,374
Median household income for apartments without a mortgage: $60,185
Median monthly housing costs: $982
Compare current foreclosures near Brighton, IL:
| Photo | Address | Area | Beds / Baths | Price | Details |
|---|---|---|---|---|---|

|
#1
Catfish Ct
Brighton, IL 62012
|
1,029 sq. feet
|
2 baths 3 beds |
show details | |

|
#2
Oak Bridge Rd
Brighton, IL 62012
|
- sq. feet
|
1 baths 2 beds |
show details | |

|
#3
Grange Hall Rd
Brighton, IL 62012
|
1,872 sq. feet
|
- baths - beds |
show details | |

|
#4
Walnut Dr
Cottage Hills, IL 62018
|
657 sq. feet
|
1 baths 2 beds |
$35,000
|
show details |

|
#5
Old Jamestown Rd
Florissant, MO 63034
|
1,440 sq. feet
|
2 baths 3 beds |
$112,300
|
show details |

|
#6
Hillcrest Ave
Alton, IL 62002
|
1,283 sq. feet
|
1 baths 2 beds |
$133,000
|
show details |

|
#7
Bender Ave
East Alton, IL 62024
|
1,400 sq. feet
|
2 baths 2 beds |
$179,000
|
show details |

|
#8
Grand Ave
Wood River, IL 62095
|
1,320 sq. feet
|
1 baths 4 beds |
$157,000
|
show details |

|
#9
Velma Ave
South Roxana, IL 62087
|
1,008 sq. feet
|
1 baths 3 beds |
$39,900
|
show details |

|
#10
Chelsea Ln
Brighton, IL 62012
|
- sq. feet
|
- baths - beds |
show details |
| Photo | Address | Area | Beds / Baths | Price | Details |
|---|---|---|---|---|---|

|
#11
South St
Brighton, IL 62012
|
- sq. feet
|
- baths - beds |
show details | |

|
#12
Button Ct
Brighton, IL 62012
|
- sq. feet
|
- baths - beds |
show details | |

|
#13
Cove Dr
Brighton, IL 62012
|
- sq. feet
|
- baths - beds |
show details | |

|
#14
Conrad Rd
Brighton, IL 62012
|
- sq. feet
|
- baths - beds |
show details | |

|
#15
Schmidt Rd
Brighton, IL 62012
|
- sq. feet
|
- baths - beds |
show details | |

|
#16
Irish Ln
Brighton, IL 62012
|
- sq. feet
|
- baths - beds |
show details | |

|
#17
Snedeker St
Jerseyville, IL 62052
|
- sq. feet
|
1 baths 2 beds |
$29,999
|
show details |

|
#18
Misty Crossing Ct
Florissant, MO 63034
|
1,550 sq. feet
|
2 baths 3 beds |
show details | |

|
#19
Ashbrook St
Bethalto, IL 62010
|
1,100 sq. feet
|
1 baths 3 beds |
show details | |

|
#20
N Rodgers Ave
Alton, IL 62002
|
- sq. feet
|
2 baths 3 beds |
show details |
| Photo | Address | Area | Beds / Baths | Price | Details |
|---|---|---|---|---|---|

|
#21
Mayfield Ave
Alton, IL 62002
|
824 sq. feet
|
1 baths 2 beds |
show details | |

|
#22
Valley View Dr
Bethalto, IL 62010
|
828 sq. feet
|
1 baths 4 beds |
show details | |

|
#23
Virginia Ave
Cottage Hills, IL 62018
|
760 sq. feet
|
1 baths 3 beds |
show details | |

|
#24
Rock Springs Dr
Alton, IL 62002
|
1,190 sq. feet
|
2 baths 2 beds |
show details | |

|
#25
Renken Rd
Dorsey, IL 62021
|
1,520 sq. feet
|
1 baths 5 beds |
show details | |

|
#26
Alby St
Alton, IL 62002
|
2,244 sq. feet
|
2 baths 3 beds |
show details | |

|
#27
Bowman Ave
East Alton, IL 62024
|
891 sq. feet
|
1 baths 2 beds |
show details | |

|
#28
Easton St
Alton, IL 62002
|
840 sq. feet
|
1 baths 2 beds |
show details | |

|
#29
Silver Fox Dr
Florissant, MO 63034
|
1,044 sq. feet
|
1 baths 3 beds |
show details | |

|
#30
Victory Dr
East Alton, IL 62024
|
768 sq. feet
|
1 baths 2 beds |
show details |
| Photo | Address | Area | Beds / Baths | Price | Details |
|---|---|---|---|---|---|

|
#31
Rhondell Ln
East Alton, IL 62024
|
2,000 sq. feet
|
1 baths 3 beds |
show details | |

|
#32
Zimmerman Rd
Dorsey, IL 62021
|
896 sq. feet
|
1 baths 2 beds |
show details | |

|
#33
W Penning Ave
Wood River, IL 62095
|
1,200 sq. feet
|
2 baths 3 beds |
show details | |

|
#34
N 2nd St
Wood River, IL 62095
|
1,115 sq. feet
|
2 baths 3 beds |
show details | |

|
#35
Mimosa Dr
Wood River, IL 62095
|
1,040 sq. feet
|
2 baths 3 beds |
show details | |

|
#36
W 2nd St
Hartford, IL 62048
|
734 sq. feet
|
1 baths 2 beds |
show details | |

|
#37
Mcdow Dr
Jerseyville, IL 62052
|
1,462 sq. feet
|
2 baths 3 beds |
show details | |

|
#38
Irwin St
East Alton, IL 62024
|
1,216 sq. feet
|
2 baths 3 beds |
show details | |

|
#39
Englewood Dr
Godfrey, IL 62035
|
1,271 sq. feet
|
2 baths 4 beds |
show details | |

|
#40
Seiler Rd
Alton, IL 62002
|
984 sq. feet
|
1 baths 4 beds |
show details |
| Photo | Address | Area | Beds / Baths | Price | Details |
|---|---|---|---|---|---|

|
#41
Redbird Ln
Godfrey, IL 62035
|
936 sq. feet
|
1 baths 3 beds |
show details | |

|
#42
Old Straube Ln
Alton, IL 62002
|
960 sq. feet
|
2 baths 3 beds |
show details | |

|
#43
Hirondelle Ln
Florissant, MO 63034
|
1,794 sq. feet
|
2 baths 3 beds |
show details | |

|
#44
Verwood Dr
Florissant, MO 63033
|
1,307 sq. feet
|
2 baths 3 beds |
show details | |

|
#45
Hampden Pl
Florissant, MO 63034
|
2,101 sq. feet
|
2 baths 3 beds |
show details | |

|
#46
Hampden Pl
Florissant, MO 63034
|
1,552 sq. feet
|
2 baths 3 beds |
show details | |

|
#47
Covington Gardens Dr
Saint Louis, MO 63138
|
1,336 sq. feet
|
2 baths 3 beds |
show details | |

|
#48
Hampden Pl
Florissant, MO 63034
|
1,214 sq. feet
|
2 baths 3 beds |
show details | |

|
#49
Silas Creek Dr
Florissant, MO 63034
|
2,294 sq. feet
|
3 baths 3 beds |
show details | |

|
Check over 1 million property listings on Foreclosure.com!
|
browse all offers | |||

Latest news about housing in Brighton, IL collected exclusively by city-data.com from local newspapers, TV, and radio stations


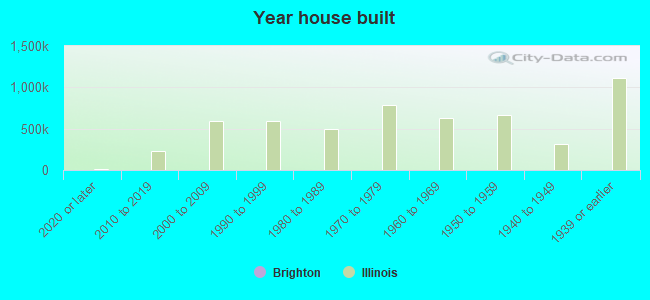
Median year apartment built: 1979
Household type by relationship:
Households: 2,406- Male householders: 482 (117 living alone), Female householders: 338 (52 living alone)
495 spouses (495 opposite-sex spouses), 17 unmarried partners, (17 opposite-sex unmarried partners), 834 children (808 natural, 8 adopted, 16 stepchildren), 69 grandchildren, 18 brothers or sisters, 18 parents, 0 foster children, 6 other relatives, 64 non-relatives
- In group quarters: 61
Size of family households: 290 2-persons, 106 3-persons, 156 4-persons, 65 5-persons, 21 6-persons.
Size of nonfamily households: 178 1-person, 21 2-persons.
462 married couples with children.
181 single-parent households (29 men, 152 women).
99.3% of residents of Brighton speak English at home.
Foreign born population: 20 (0.8%)
(45.0% of them are naturalized citizens)
| Here: | 6.4 |
| State: | 6.4 |
| Here: | 4.2 |
| State: | 4.1 |
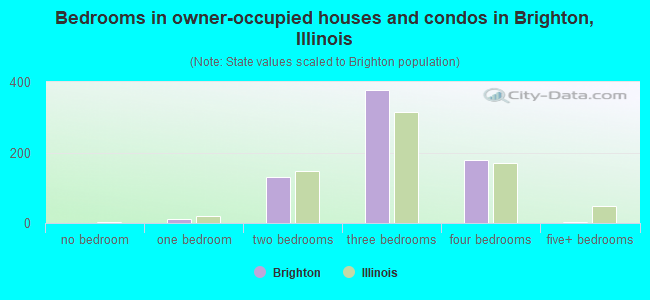
- Bedrooms in owner-occupied houses and condos in Brighton, Illinois
- 0no bedroom
- 121 bedroom
- 1312 bedrooms
- 3773 bedrooms
- 1804 bedrooms
- 45+ bedrooms
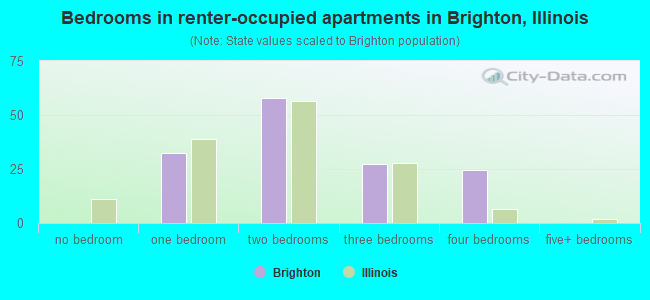
- Bedrooms in renter-occupied apartments in Brighton, Illinois
- 0no bedroom
- 331 bedroom
- 582 bedrooms
- 273 bedrooms
- 244 bedrooms
- 05+ bedrooms
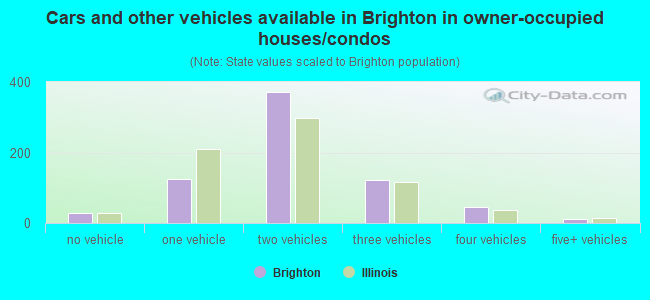
- Cars and other vehicles available in Brighton in owner-occupied houses/condos
- 28no vehicle
- 1251 vehicle
- 3712 vehicles
- 1233 vehicles
- 454 vehicles
- 115+ vehicles
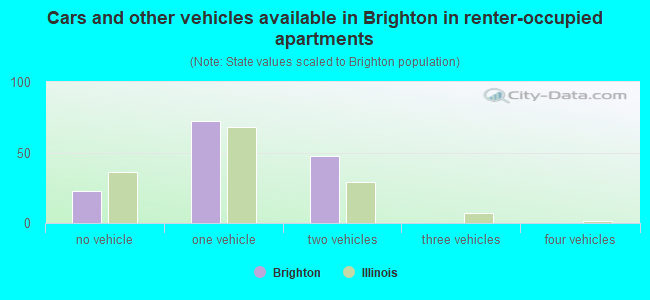
- Cars and other vehicles available in Brighton in renter-occupied apartments
- 22no vehicle
- 721 vehicle
- 482 vehicles
- 03 vehicles
- 04 vehicles
- 05+ vehicles
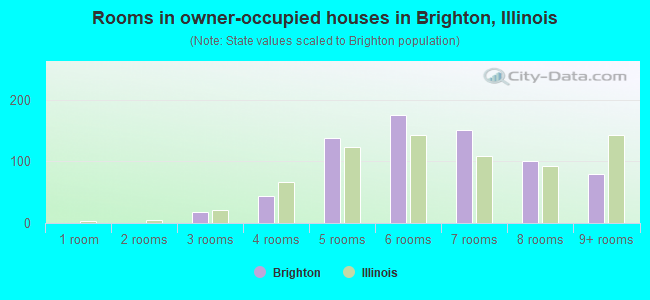
- Rooms in owner-occupied houses in Brighton, Illinois
- 01 room
- 02 rooms
- 183 rooms
- 434 rooms
- 1385 rooms
- 1756 rooms
- 1507 rooms
- 1008 rooms
- 809+ rooms
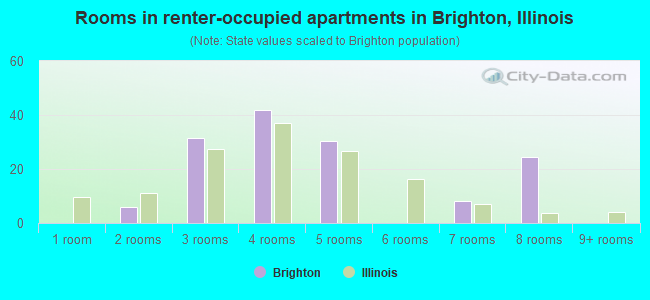
- Rooms in renter-occupied apartments in Brighton, Illinois
- 01 room
- 62 rooms
- 323 rooms
- 424 rooms
- 315 rooms
- 06 rooms
- 87 rooms
- 248 rooms
- 09+ rooms
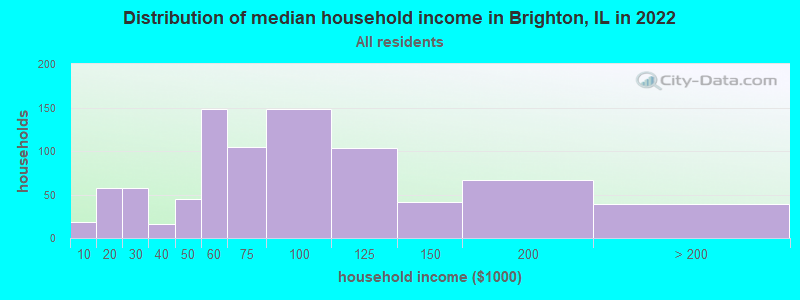
Brighton, IL household income distribution

- 18Less than $10,000
- 57$10,000 to $19,999
- 58$20,000 to $29,999
- 16$30,000 to $39,999
- 45$40,000 to $49,999
- 148$50,000 to $59,999
- 105$60,000 to $74,999
- 148$75,000 to $99,999
- 104$100,000 to $124,999
- 41$125,000 to $149,999
- 67$150,000 to $199,999
- 39$200,000 or more
Home value of owner - occupied houses in 2022 in Brighton, IL
-
- 8$15,000 to $19,999
- 27$50,000 to $59,999
- 39$60,000 to $69,999
- 10$70,000 to $79,999
- 83$80,000 to $89,999
- 62$90,000 to $99,999
- 110$100,000 to $124,999
- 78$125,000 to $149,999
- 96$150,000 to $174,999
- 16$175,000 to $199,999
- 45$200,000 to $249,999
- 23$250,000 to $299,999
- 44$300,000 to $399,999
- 23$400,000 to $499,999
Rent paid by renters in 2022 in Brighton, IL
-
- 8$100 to $149
- 4$150 to $199
- 5$250 to $299
- 5$300 to $349
- 4$450 to $499
- 22$500 to $549
- 4$550 to $599
- 7$600 to $649
- 5$650 to $699
- 18$700 to $749
- 6$750 to $799
- 17$800 to $899
- 10$900 to $999
- 24$1,000 to $1,249
Percentage of workers working in this county: 17.5%
Number of people working at home: 68 (6.1% of all workers)
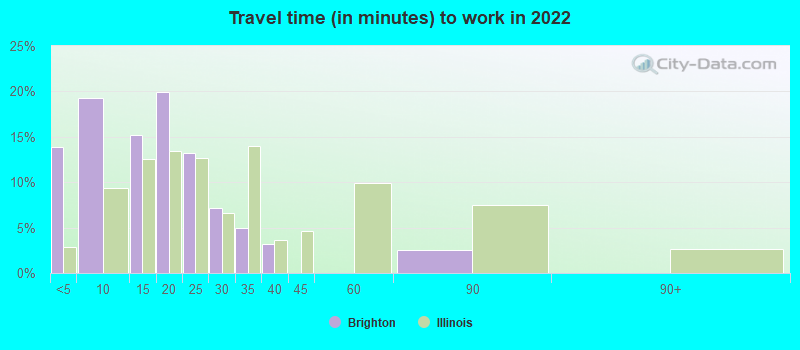
Travel time to work (commute)
- Less than 5 minutes: 36
- 5 to 9 minutes: 71
- 10 to 14 minutes: 104
- 15 to 19 minutes: 193
- 20 to 24 minutes: 222
- 25 to 29 minutes: 57
- 30 to 34 minutes: 139
- 35 to 39 minutes: 24
- 40 to 44 minutes: 45
- 45 to 59 minutes: 66
- 60 to 89 minutes: 48
- 90 or more minutes: 10
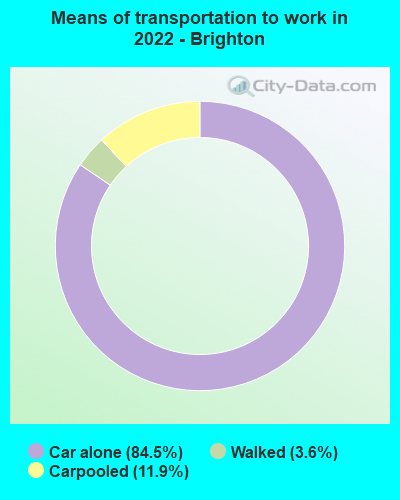
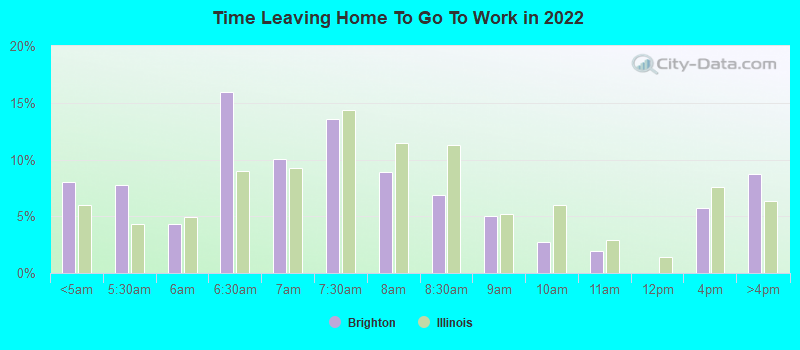
Means of transportation to work:
- Drove a car alone: 311 (76.2%)
- Carpooled: 44 (10.8%)
- Walked: 12 (2.9%)
- Worked at home: 35 (8.6%)
- Unemployment by race in 2022
- Unemployment rate for White non-Hispanic residents
- 2.9%Males
- 0.8%Females
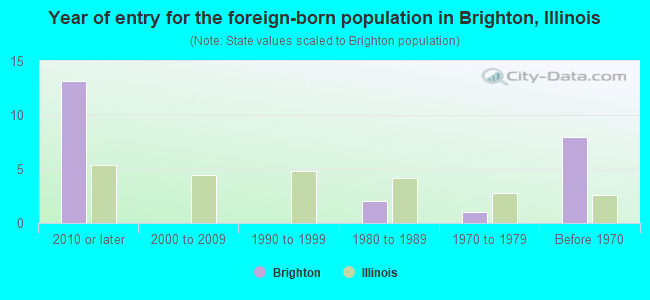
- Year of entry for the foreign-born population in Brighton, Illinois
- 132010 or later
- 02000 to 2009
- 01990 to 1999
- 21980 to 1989
- 11970 to 1979
- 8Before 1970
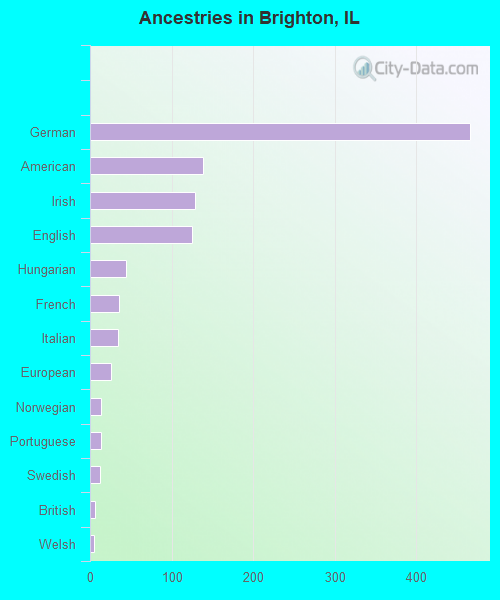
First ancestries reported:
- German: 466 (41.9%)
- American: 138 (12.4%)
- Irish: 129 (11.6%)
- English: 125 (11.3%)
- Hungarian: 44 (4.0%)
- French: 35 (3.2%)
- Italian: 34 (3.1%)
- European: 26 (2.3%)
- Norwegian: 14 (1.3%)
- Portuguese: 13 (1.2%)
- Swedish: 12 (1.1%)
- British: 6 (0.5%)
- Welsh: 5 (0.5%)
- Scottish: 3 (0.3%)
Most common places of birth for foreign-born residents (%):
| Brighton: | 60.0% (12) |
| Illinois: | 0.0% (541) |
| Brighton: | 50.0% (10) |
| Illinois: | 34.7% (626,958) |
| Brighton: | 35.0% (7) |
| Illinois: | 0.0% (27) |
Place of birth for U.S.-born residents:
- This state: 1,928
- Other state: 448
- Northeast: 53
- Midwest: 325
- South: 32
- West: 40
92.1% of Brighton residents lived in the same house 1 years ago.
Out of people who lived in different houses, 27.1% lived in this county.
Out of people who lived in different counties, 57.7% lived in Illinois.
| Brighton: | 92.1% |
| State average: | 88.3% |
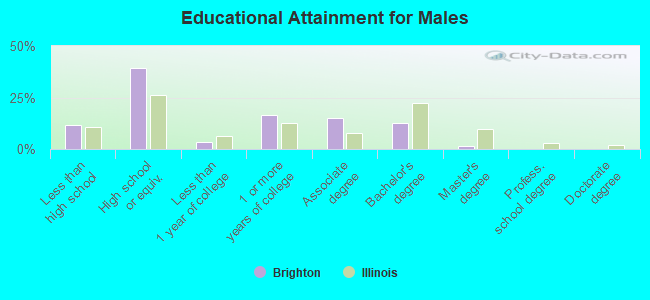
Education attainment for males 25 years and older:
- No schooling: 0
- Nursery to 4th grade: 0
- 5th and 6th grade: 10
- 7th and 8th grade: 16
- 9th grade: 16
- 10th grade: 34
- 11th grade: 15
- 12th grade, no diploma: 7
- High school graduate (or equivalency): 323
- Less than 1 year of college: 28
- Some college more than 1 year, no degree: 136
- Associate degree: 123
- Bachelor's degree: 104
- Master's degree: 12
- Professional school degree: 0
- Doctorate degree: 0
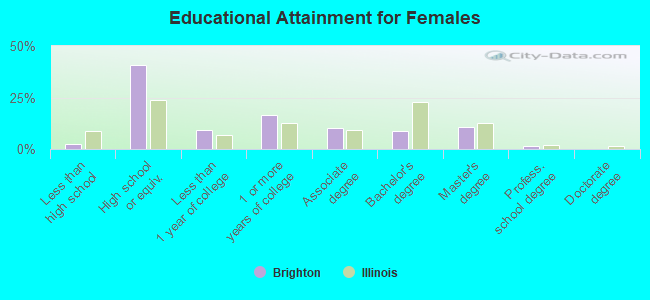
Education attainment for females 25 years and older:
- No schooling: 0
- Nursery to 4th grade: 0
- 5th and 6th grade: 0
- 7th and 8th grade: 5
- 9th grade: 5
- 10th grade: 7
- 11th grade: 0
- 12th grade, no diploma: 0
- High school graduate (or equivalency): 295
- Less than 1 year of college: 68
- Some college more than 1 year, no degree: 121
- Associate degree: 75
- Bachelor's degree: 63
- Master's degree: 76
- Professional school degree: 12
- Doctorate degree: 0
Housing units in structures:
- One, detached: 872
- One, attached: 11
- Two: 14
- 3 or 4: 21
- 5 to 9: 18
- 10 to 19: 13
- Mobile homes: 24
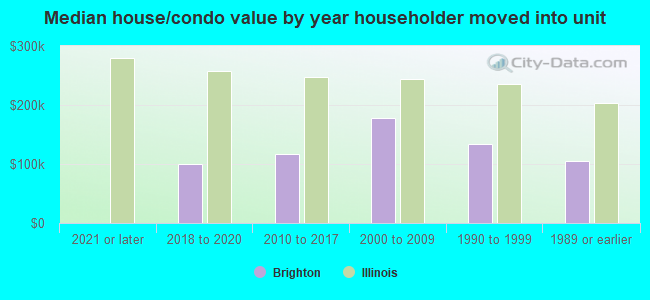
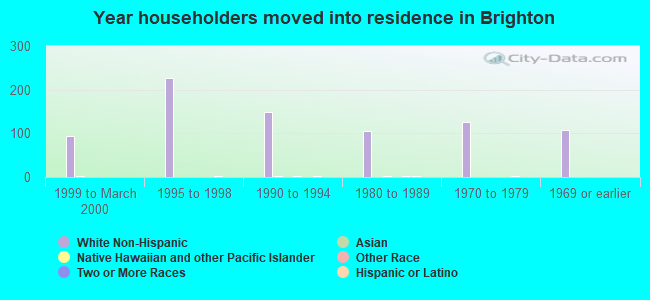
House/condo owner moved in on average 9 years ago
Renter moved in on average 2 years ago
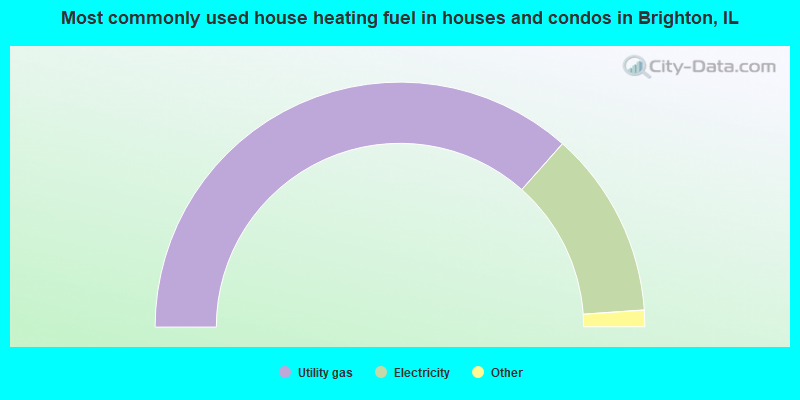
- 73.1%Utility gas
- 24.7%Electricity
- 1.3%Bottled, tank, or LP gas
- 0.9%Fuel oil, kerosene, etc.
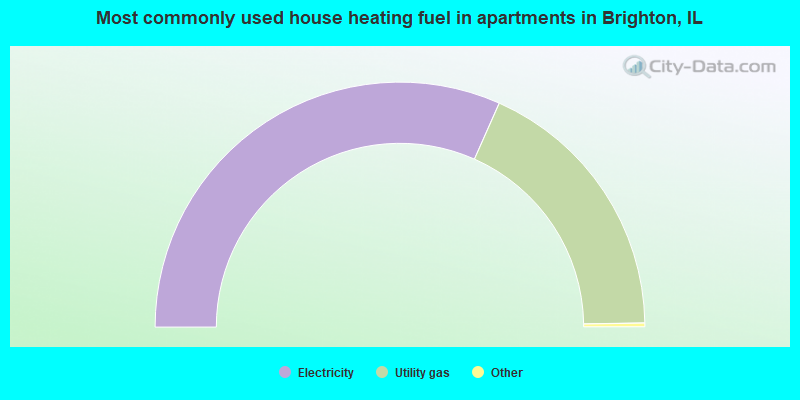
- 63.6%Electricity
- 36.4%Utility gas
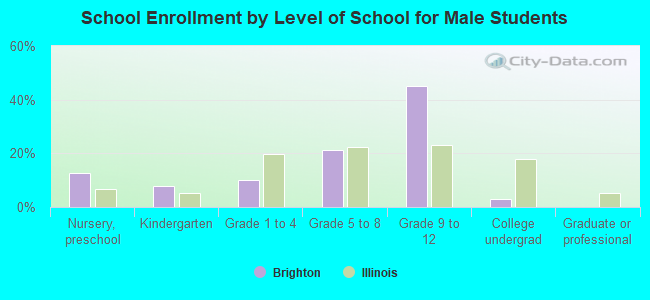
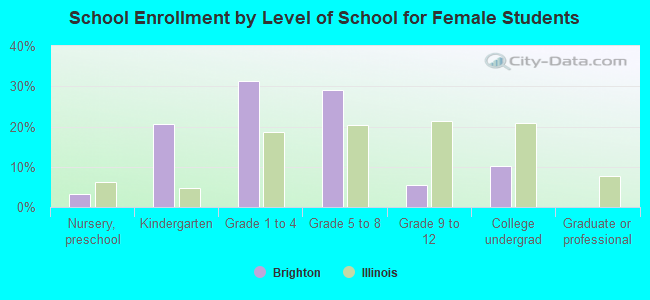
Private vs. public school enrollment:
| Here: | 0.0% |
| Illinois: | 13.3% |
| Here: | 5.8% |
| Illinois: | 9.9% |
| Here: | 16.7% |
| Illinois: | 27.4% |