Bristol, IN (Indiana) Houses and Residents
| Bristol: | $199,187 |
| Indiana: | $208,700 |
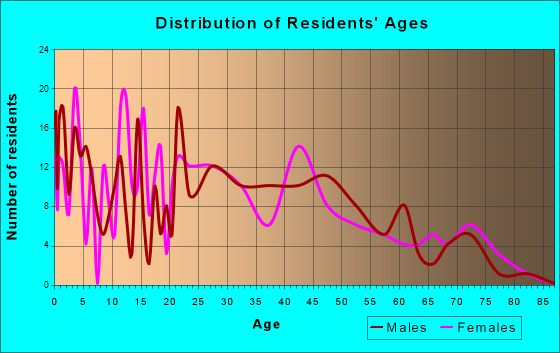
Total population: 1,650 (Urban population: 1,128, Rural population: 254 (4 farm, 250 nonfarm))
Houses: 877 (642 occupied: 486 owner occupied, 174 renter occupied)
| % of renters here: | 26% |
| State: | 29% |
Housing density: 368 houses/condos per square mile
Median price asked for vacant for-sale houses and condos in 2022: $539,287.
Median contract rent in 2022: $839 (lower quartile is $739, upper quartile is $972)
Median rent asked for vacant for-rent units in 2022: $852
Median gross rent in Bristol, IN in 2022: $1,009
Housing units in Bristol with a mortgage: 319 (41 second mortgage, 2 home equity loan, 40 both second mortgage and home equity loan)
Houses without a mortgage: 14
Median household income for houses/condos with a mortgage: $83,455
Median household income for apartments without a mortgage: $58,231
Median monthly housing costs: $997
Compare current foreclosures near Bristol, IN:
| Photo | Address | Area | Beds / Baths | Price | Details |
|---|---|---|---|---|---|

|
#1
Stanford Dr
Bristol, IN 46507
|
1,488 sq. feet
|
1 baths 4 beds |
show details | |

|
#2
Turnberry Ave
Bristol, IN 46507
|
1,272 sq. feet
|
1 baths 4 beds |
show details | |

|
#3
Swan St
Bristol, IN 46507
|
1,120 sq. feet
|
1 baths 3 beds |
show details | |

|
#4
Monterey Dr
Bristol, IN 46507
|
2,404 sq. feet
|
1 baths 4 beds |
show details | |

|
#5
W Michigan St
Bristol, IN 46507
|
- sq. feet
|
- baths - beds |
show details | |

|
#6
W Vistula St Apt 1111
Bristol, IN 46507
|
- sq. feet
|
- baths - beds |
show details | |

|
#7
E Vistula St # 2
Bristol, IN 46507
|
- sq. feet
|
- baths - beds |
show details | |

|
#8
W Hawthorn St
Bristol, IN 46507
|
- sq. feet
|
- baths - beds |
show details | |

|
#9
County Road 27 Lot 15
Bristol, IN 46507
|
- sq. feet
|
- baths - beds |
show details | |

|
#10
Mallard Dr
Bristol, IN 46507
|
- sq. feet
|
- baths - beds |
show details |
| Photo | Address | Area | Beds / Baths | Price | Details |
|---|---|---|---|---|---|

|
#11
Wigwam Ct
Bristol, IN 46507
|
- sq. feet
|
- baths - beds |
show details | |

|
#12
Ash Rd
Osceola, IN 46561
|
1,288 sq. feet
|
2 baths 3 beds |
show details | |

|
#13
Ireland Rd
Osceola, IN 46561
|
4,176 sq. feet
|
5 baths 14 beds |
show details | |

|
#14
Norman Ct
Elkhart, IN 46516
|
1,580 sq. feet
|
1 baths 4 beds |
show details | |

|
#15
Pembrook Ln
Elkhart, IN 46517
|
2,106 sq. feet
|
1 baths 3 beds |
show details | |

|
#16
Green Valley Pkwy
Elkhart, IN 46517
|
1,056 sq. feet
|
2 baths 2 beds |
show details | |

|
#17
Grove St
Constantine, MI 49042
|
1,064 sq. feet
|
1 baths 2 beds |
show details | |

|
#18
Janet St
Granger, IN 46530
|
768 sq. feet
|
1 baths 2 beds |
show details | |

|
#19
W Lexington Ave
Elkhart, IN 46514
|
1,630 sq. feet
|
2 baths 3 beds |
show details | |

|
#20
Quaker St
Constantine, MI 49042
|
1,196 sq. feet
|
2 baths 3 beds |
show details |
| Photo | Address | Area | Beds / Baths | Price | Details |
|---|---|---|---|---|---|

|
#21
Bradley St
Elkhart, IN 46514
|
1,636 sq. feet
|
1 baths 3 beds |
show details | |

|
#22
Greenleaf Blvd
Elkhart, IN 46514
|
1,887 sq. feet
|
2 baths 3 beds |
show details | |

|
#23
N 915 W
Shipshewana, IN 46565
|
1,344 sq. feet
|
2 baths 3 beds |
show details | |

|
#24
County Road 38
Wakarusa, IN 46573
|
5,038 sq. feet
|
4 baths 5 beds |
show details | |

|
#25
County Road 2
Elkhart, IN 46514
|
1,474 sq. feet
|
2 baths 3 beds |
show details | |

|
#26
Conrad Rd
Edwardsburg, MI 49112
|
2,500 sq. feet
|
2 baths 3 beds |
show details | |

|
#27
Stonebridge Dr
Elkhart, IN 46514
|
2,389 sq. feet
|
2 baths 4 beds |
show details | |

|
#28
Graham St
Cassopolis, MI 49031
|
1,184 sq. feet
|
1 baths 2 beds |
show details | |

|
#29
County Road 33
Middlebury, IN 46540
|
1,524 sq. feet
|
1 baths 3 beds |
show details | |

|
#30
Ash Rd
Osceola, IN 46561
|
1,303 sq. feet
|
1 baths 3 beds |
show details |
| Photo | Address | Area | Beds / Baths | Price | Details |
|---|---|---|---|---|---|

|
#31
Sunset Ct
Osceola, IN 46561
|
1,836 sq. feet
|
2 baths 3 beds |
show details | |

|
#32
Westwood Dr
Goshen, IN 46526
|
1,292 sq. feet
|
1 baths 3 beds |
show details | |

|
#33
Virginia Dr
Elkhart, IN 46516
|
1,058 sq. feet
|
1 baths 2 beds |
show details | |

|
#34
Hampton Woods Dr
Elkhart, IN 46514
|
2,132 sq. feet
|
1 baths 3 beds |
show details | |

|
#35
Ehman Rd
Mishawaka, IN 46545
|
1,286 sq. feet
|
1 baths 3 beds |
show details | |

|
#36
Morning Mist Trl
Osceola, IN 46561
|
1,728 sq. feet
|
1 baths 3 beds |
show details | |

|
#37
Neely St
Osceola, IN 46561
|
772 sq. feet
|
1 baths 2 beds |
show details | |

|
#38
W Superior St
Osceola, IN 46561
|
932 sq. feet
|
1 baths 2 beds |
show details | |

|
#39
Osceola Ave
Osceola, IN 46561
|
1,228 sq. feet
|
1 baths 3 beds |
show details | |

|
#40
Blackhawk Dr
Goshen, IN 46528
|
1,725 sq. feet
|
1 baths 3 beds |
show details |
| Photo | Address | Area | Beds / Baths | Price | Details |
|---|---|---|---|---|---|

|
#41
Edison Rd
Osceola, IN 46561
|
1,092 sq. feet
|
1 baths 3 beds |
show details | |

|
#42
Rivercrest Dr
Osceola, IN 46561
|
1,080 sq. feet
|
1 baths 3 beds |
show details | |

|
#43
Blue Heron Dr
Goshen, IN 46528
|
3,624 sq. feet
|
2 baths 4 beds |
show details | |

|
#44
Quail Ridge Dr
Elkhart, IN 46514
|
1,148 sq. feet
|
1 baths 3 beds |
show details | |

|
#45
Shepherds Cove Dr
Osceola, IN 46561
|
1,886 sq. feet
|
1 baths 3 beds |
show details | |

|
#46
Buckeye Rd
Mishawaka, IN 46545
|
1,632 sq. feet
|
2 baths 3 beds |
show details | |

|
#47
Arrowhead Cir
Granger, IN 46530
|
2,702 sq. feet
|
2 baths 4 beds |
show details | |

|
#48
Champery Dr
Osceola, IN 46561
|
1,367 sq. feet
|
2 baths 3 beds |
show details | |

|
#49
Ireland Rd
Osceola, IN 46561
|
4,176 sq. feet
|
2 baths 2 beds |
show details | |

|
Check over 1 million property listings on Foreclosure.com!
|
browse all offers | |||

Latest news about housing in Bristol, IN collected exclusively by city-data.com from local newspapers, TV, and radio stations

 | Moving to Elkhart... advice? (12 replies) |
| Looking For Apartment Close to Downtown Indianapolis (10 replies) |
| Rental Property in Bristol, Indiana (0 replies) |
| Mobile Home Questions (7 replies) |
| HAD ENOUGH OF SEARCHING, between two rocks here, please help (14 replies) |
| For all the Indy haters (23 replies) |
Median year apartment built: 1976
Household type by relationship:
Households: 1,862- Male householders: 341 (116 living alone), Female householders: 296 (96 living alone)
278 spouses (274 opposite-sex spouses), 83 unmarried partners, (83 opposite-sex unmarried partners), 692 children (619 natural, 13 adopted, 60 stepchildren), 29 grandchildren, 11 brothers or sisters, 22 parents, 8 foster children, 60 other relatives, 35 non-relatives
- In group quarters: 7
Size of family households: 178 2-persons, 48 3-persons, 105 4-persons, 28 5-persons, 23 6-persons, 6 7-or-more-persons.
Size of nonfamily households: 236 1-person, 26 2-persons, 16 3-persons.
341 married couples with children.
128 single-parent households (83 men, 45 women).
85.2% of residents of Bristol speak English at home.
12.8% of residents speak Spanish at home (43% speak English very well, 46% speak English well, 11% speak English not well).
1.1% of residents speak other Indo-European language at home (100% speak English very well).
0.6% of residents speak Asian or Pacific Island language at home (100% speak English well).
0.5% of residents speak other language at home (100% speak English very well).
Foreign born population: 46 (2.5%)
(32.6% of them are naturalized citizens)
| Here: | 6.5 |
| State: | 6.6 |
| Here: | 4.6 |
| State: | 4.3 |

- Bedrooms in owner-occupied houses and condos in Bristol, Indiana
- 2no bedroom
- 121 bedroom
- 792 bedrooms
- 2693 bedrooms
- 1154 bedrooms
- 85+ bedrooms

- Bedrooms in renter-occupied apartments in Bristol, Indiana
- 0no bedroom
- 151 bedroom
- 922 bedrooms
- 583 bedrooms
- 94 bedrooms
- 05+ bedrooms

- Cars and other vehicles available in Bristol in owner-occupied houses/condos
- 12no vehicle
- 1021 vehicle
- 2062 vehicles
- 1053 vehicles
- 584 vehicles
- 35+ vehicles

- Cars and other vehicles available in Bristol in renter-occupied apartments
- 26no vehicle
- 841 vehicle
- 522 vehicles
- 73 vehicles
- 54 vehicles
- 05+ vehicles

- Rooms in owner-occupied houses in Bristol, Indiana
- 01 room
- 02 rooms
- 73 rooms
- 334 rooms
- 925 rooms
- 1186 rooms
- 687 rooms
- 1038 rooms
- 649+ rooms

- Rooms in renter-occupied apartments in Bristol, Indiana
- 01 room
- 02 rooms
- 63 rooms
- 794 rooms
- 255 rooms
- 496 rooms
- 67 rooms
- 98 rooms
- 09+ rooms


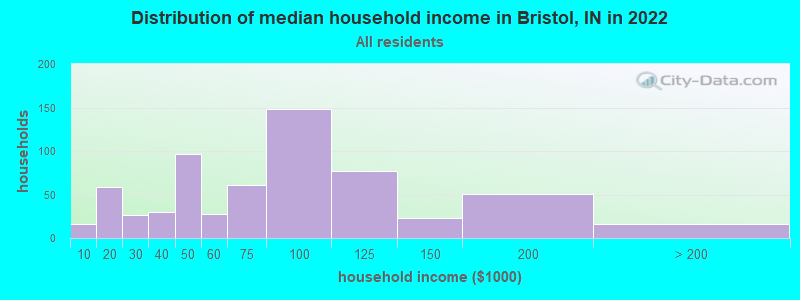
Bristol, IN household income distribution

- 16Less than $10,000
- 59$10,000 to $19,999
- 26$20,000 to $29,999
- 30$30,000 to $39,999
- 97$40,000 to $49,999
- 28$50,000 to $59,999
- 61$60,000 to $74,999
- 148$75,000 to $99,999
- 77$100,000 to $124,999
- 23$125,000 to $149,999
- 51$150,000 to $199,999
- 16$200,000 or more
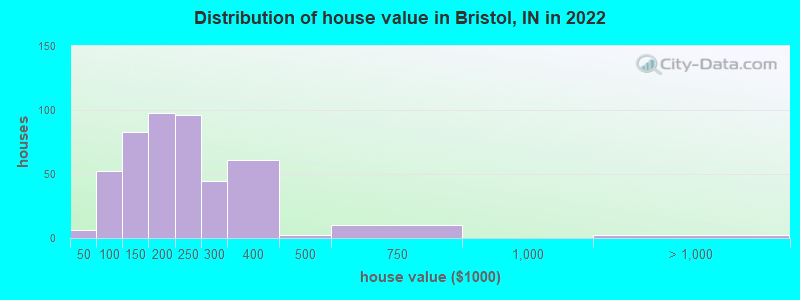
Home value of owner - occupied houses in 2022 in Bristol, IN
-
- 6Less than $10,000
- 29$50,000 to $59,999
- 2$60,000 to $69,999
- 15$80,000 to $89,999
- 5$90,000 to $99,999
- 24$100,000 to $124,999
- 58$125,000 to $149,999
- 65$150,000 to $174,999
- 32$175,000 to $199,999
- 95$200,000 to $249,999
- 44$250,000 to $299,999
- 60$300,000 to $399,999
- 2$400,000 to $499,999
- 9$500,000 to $749,999
- 2$2,000,000 or more
Rent paid by renters in 2022 in Bristol, IN
-
- 5$500 to $549
- 42$650 to $699
- 7$700 to $749
- 16$750 to $799
- 46$800 to $899
- 33$900 to $999
- 11$1,000 to $1,249
- 5No cash rent


Percentage of workers working in this county: 97.7%
Number of people working at home: 31 (3.4% of all workers)
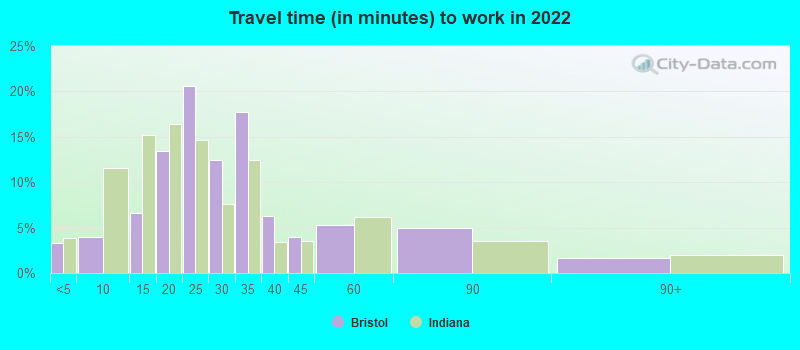
Travel time to work (commute)
- Less than 5 minutes: 43
- 5 to 9 minutes: 60
- 10 to 14 minutes: 64
- 15 to 19 minutes: 289
- 20 to 24 minutes: 111
- 25 to 29 minutes: 132
- 30 to 34 minutes: 109
- 35 to 39 minutes: 7
- 40 to 44 minutes: 6
- 45 to 59 minutes: 10
- 60 to 89 minutes: 15
- 90 or more minutes: 10
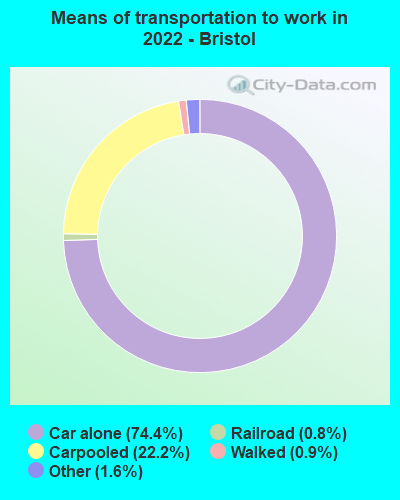
Means of transportation to work:
- Drove a car alone: 2,843 (71.6%)
- Carpooled: 954 (24.0%)
- Bus: 1 (0.0%)
- Light rail, streetcar or trolley: 31 (0.8%)
- Taxi: 80 (2.0%)
- Walked: 39 (1.0%)
- Worked at home: 31 (0.8%)

- Unemployment by race in 2022
- Unemployment rate for White non-Hispanic residents
- 0.8%Females

- Year of entry for the foreign-born population in Bristol, Indiana
- 122010 or later
- 62000 to 2009
- 171990 to 1999
- 281980 to 1989
- 131970 to 1979
- 11Before 1970

First ancestries reported:
- German: 131 (16.5%)
- English: 103 (12.9%)
- American: 71 (8.9%)
- European: 44 (5.5%)
- Irish: 31 (3.9%)
- Pennsylvania German: 12 (1.5%)
- Italian: 11 (1.4%)
- Scotch-Irish: 10 (1.3%)
- Swiss: 7 (0.9%)
- Welsh: 7 (0.9%)
- Scottish: 6 (0.8%)
- Polish: 5 (0.6%)
- Danish: 4 (0.5%)
- Dutch: 4 (0.5%)
- Lithuanian: 4 (0.5%)
- Norwegian: 3 (0.4%)
- Romanian: 3 (0.4%)
- Austrian: 2 (0.3%)
- Finnish: 2 (0.3%)
- Russian: 1 (0.1%)
Most common places of birth for foreign-born residents (%):
| Bristol: | 43.2% (19) |
| Indiana: | 1.6% (5,892) |
| Bristol: | 31.8% (14) |
| Indiana: | 27.0% (101,996) |
| Bristol: | 20.5% (9) |
| Indiana: | 0.9% (3,221) |
| Bristol: | 11.4% (5) |
| Indiana: | 3.1% (11,851) |
| Bristol: | 4.5% (2) |
| Indiana: | 0.1% (287) |
Place of birth for U.S.-born residents:
- This state: 1,215
- Other state: 461
- Northeast: 35
- Midwest: 297
- South: 92
- West: 31
86.1% of Bristol residents lived in the same house 1 years ago.
Out of people who lived in different houses, 29.6% lived in this county.
Out of people who lived in different counties, 57.1% lived in Indiana.
| Bristol: | 86.1% |
| State average: | 87.1% |
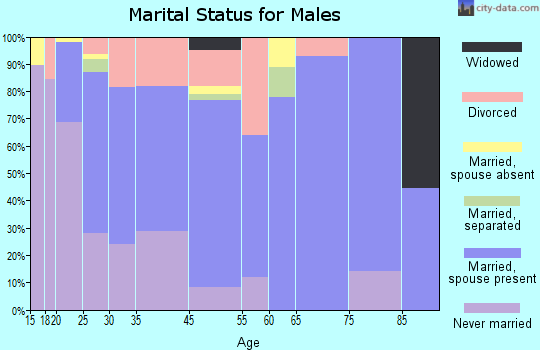
Education attainment for males 25 years and older:
- No schooling: 12
- Nursery to 4th grade: 0
- 5th and 6th grade: 0
- 7th and 8th grade: 6
- 9th grade: 4
- 10th grade: 4
- 11th grade: 4
- 12th grade, no diploma: 25
- High school graduate (or equivalency): 208
- Less than 1 year of college: 34
- Some college more than 1 year, no degree: 41
- Associate degree: 43
- Bachelor's degree: 65
- Master's degree: 40
- Professional school degree: 25
- Doctorate degree: 0

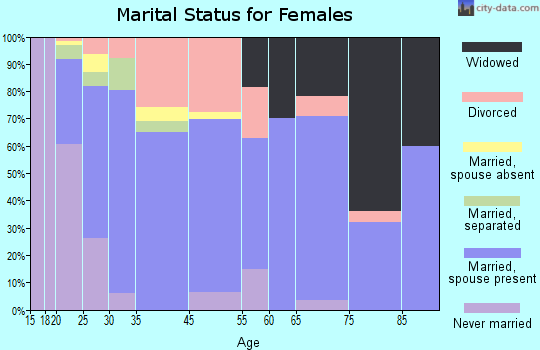
Education attainment for females 25 years and older:
- No schooling: 10
- Nursery to 4th grade: 0
- 5th and 6th grade: 0
- 7th and 8th grade: 18
- 9th grade: 0
- 10th grade: 25
- 11th grade: 28
- 12th grade, no diploma: 17
- High school graduate (or equivalency): 167
- Less than 1 year of college: 56
- Some college more than 1 year, no degree: 101
- Associate degree: 48
- Bachelor's degree: 32
- Master's degree: 54
- Professional school degree: 11
- Doctorate degree: 3

Housing units in structures:
- One, detached: 601
- Two: 20
- 3 or 4: 71
- 5 to 9: 49
- 10 to 19: 35
- 20 to 49: 73
- 50 or more: 4
- Mobile homes: 22
Housing units lacking complete kitchen facilities in 2022: 2.9%
House/condo owner moved in on average 14 years ago
Renter moved in on average 1 years ago

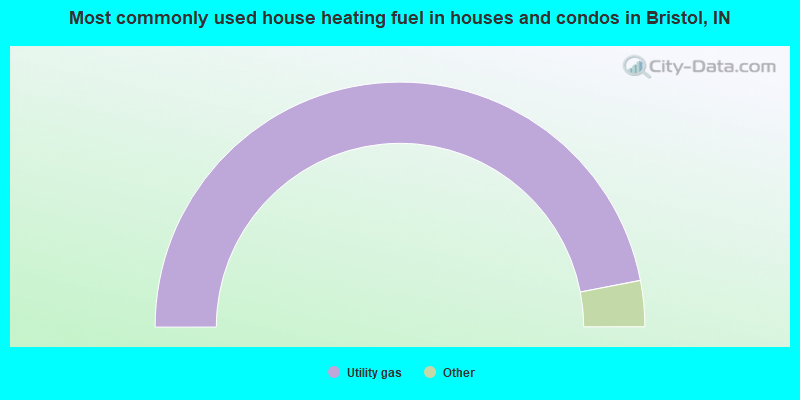
- 94.0%Utility gas
- 3.2%Electricity
- 1.3%Wood
- 1.1%No fuel used
- 0.4%Other fuel
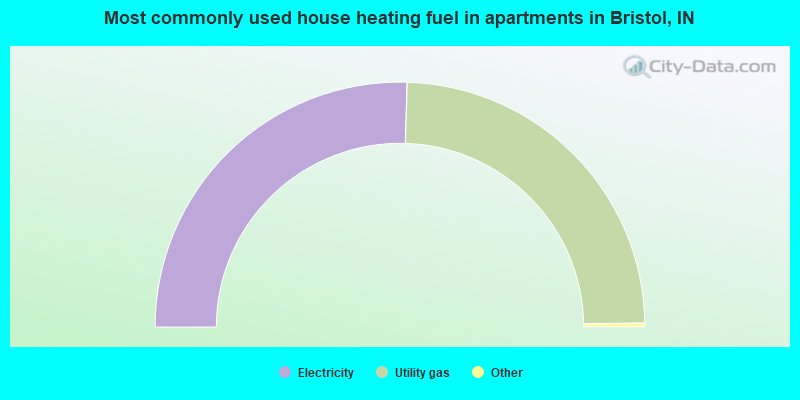
- 51.2%Electricity
- 48.8%Utility gas
Private vs. public school enrollment:
| Here: | 0.5% |
| Indiana: | 14.9% |
| Here: | 2.8% |
| Indiana: | 11.4% |
| Here: | 0.0% |
| Indiana: | 22.3% |


