Bristol, NH (New Hampshire) Houses and Residents
| Bristol: | $230,374 |
| New Hampshire: | $384,700 |
Mean price in 2022:
Detached houses: $263,785
Here: $263,785 State: $491,479 In 3-to-4-unit structures: $162,647
Here: $162,647 State: $575,942 Mobile homes: $69,733
Here: $69,733 State: $124,817
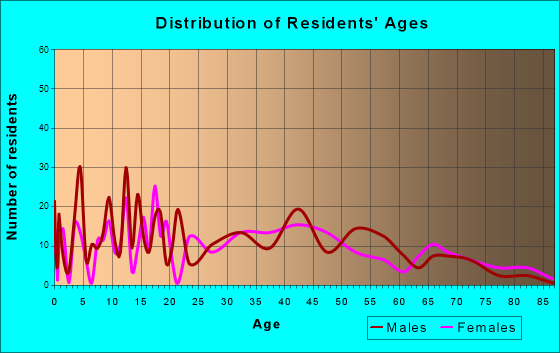
Total population: 1,688 (Urban population: 0, Rural population: 1,713 (all nonfarm))
Houses: 951 (784 occupied: 515 owner occupied, 320 renter occupied)
| % of renters here: | 38% |
| State: | 28% |
Housing density: 201 houses/condos per square mile
Median price asked for vacant for-sale houses and condos in 2022 in this county: $210,911.
Median contract rent in 2022: $941 (lower quartile is $715, upper quartile is $1,058)
Median rent asked for vacant for-rent units in 2022: $3,233
Median gross rent in Bristol, NH in 2022: $1,064
Housing units in Bristol with a mortgage: 272 (11 second mortgage, 0 home equity loan, 12 both second mortgage and home equity loan)
Houses without a mortgage: 4
Median household income for houses/condos with a mortgage: $90,708
Median household income for apartments without a mortgage: $87,256
Median monthly housing costs: $1,001
Compare current foreclosures near Bristol, NH:
| Photo | Address | Area | Beds / Baths | Price | Details |
|---|---|---|---|---|---|

|
#1
Ward Hill Rd
Franklin, NH 03235
|
1,700 sq. feet
|
2 baths 3 beds |
show details | |

|
#2
Flaghole Rd
Franklin, NH 03235
|
1,352 sq. feet
|
2 baths 3 beds |
show details | |

|
#3
Taylor Rd
Sanbornton, NH 03269
|
2,446 sq. feet
|
2 baths 4 beds |
show details | |

|
#4
Adams St
Laconia, NH 03246
|
1,956 sq. feet
|
1 baths 3 beds |
show details | |

|
#5
Pleasant St
Meredith, NH 03253
|
3,096 sq. feet
|
2 baths 4 beds |
show details | |

|
#6
Province St
Laconia, NH 03246
|
818 sq. feet
|
1 baths 2 beds |
show details | |

|
#7
Prospect Hill Rd
Canaan, NH 03741
|
- sq. feet
|
1 baths 3 beds |
show details | |

|
#8
Mechanic St
Laconia, NH 03246
|
2,537 sq. feet
|
2 baths 4 beds |
show details | |

|
#9
Drake Rd
Sanbornton, NH 03269
|
2,376 sq. feet
|
2 baths 3 beds |
show details | |

|
#10
Plymouth St
Meredith, NH 03253
|
2,232 sq. feet
|
2 baths 4 beds |
show details |
| Photo | Address | Area | Beds / Baths | Price | Details |
|---|---|---|---|---|---|

|
#11
Eastman Hill Rd
Sanbornton, NH 03269
|
4,836 sq. feet
|
2 baths 4 beds |
show details | |

|
#12
Strafford St
Laconia, NH 03246
|
1,820 sq. feet
|
2 baths 4 beds |
show details | |

|
#13
Shaw Hill Rd
Sanbornton, NH 03269
|
1,976 sq. feet
|
1 baths 3 beds |
show details | |

|
#14
Brook Rd # 2
Sanbornton, NH 03269
|
2,128 sq. feet
|
2 baths 4 beds |
show details | |

|
#15
Union Ave
Laconia, NH 03246
|
6,055 sq. feet
|
2 baths - beds |
show details | |

|
#16
Union Rd
Belmont, NH 03220
|
1,104 sq. feet
|
- baths - beds |
show details | |

|
#17
Wethersfield Dr
Tilton, NH 03276
|
- sq. feet
|
- baths - beds |
show details | |

|
#18
Endicott St N Unit 420
Laconia, NH 03246
|
- sq. feet
|
- baths - beds |
show details | |

|
#19
Horne Rd
Belmont, NH 03220
|
1,491 sq. feet
|
- baths - beds |
show details | |

|
#20
Bay Hill Rd # 1
Tilton, NH 03276
|
- sq. feet
|
- baths - beds |
show details |
| Photo | Address | Area | Beds / Baths | Price | Details |
|---|---|---|---|---|---|

|
#21
Pine Grove Rd
Belmont, NH 03220
|
1,188 sq. feet
|
- baths - beds |
show details | |

|
#22
Karen Dr
Belmont, NH 03220
|
1,920 sq. feet
|
- baths - beds |
show details | |

|
#23
Durkee St # B
Laconia, NH 03246
|
- sq. feet
|
- baths - beds |
show details | |

|
#24
Hurricane Rd
Belmont, NH 03220
|
1,280 sq. feet
|
- baths - beds |
show details | |

|
#25
Landing Ln # 131
Laconia, NH 03246
|
- sq. feet
|
- baths - beds |
show details | |

|
#26
Academy St Apt 3
Laconia, NH 03246
|
- sq. feet
|
- baths - beds |
show details | |

|
#27
Estates Cir Apt 24
Laconia, NH 03246
|
- sq. feet
|
- baths - beds |
show details | |

|
#28
Sand Hill Rd
Gilford, NH 03249
|
- sq. feet
|
- baths - beds |
show details | |

|
#29
N Main St Apt 33
Laconia, NH 03246
|
- sq. feet
|
- baths - beds |
show details | |

|
#30
Livermore Rd
Campton, NH 03223
|
- sq. feet
|
- baths - beds |
show details |
| Photo | Address | Area | Beds / Baths | Price | Details |
|---|---|---|---|---|---|

|
#31
Bowman Rd
Springfield, NH 03284
|
- sq. feet
|
- baths - beds |
show details | |

|
#32
Winona Rd
New Hampton, NH 03256
|
- sq. feet
|
- baths - beds |
show details | |

|
#33
New Hebron Rd
Plymouth, NH 03264
|
- sq. feet
|
- baths - beds |
show details | |

|
#34
Calef Hill Rd
Tilton, NH 03276
|
- sq. feet
|
- baths - beds |
show details | |

|
#35
River St Apt 1k
Franklin, NH 03235
|
- sq. feet
|
- baths - beds |
show details | |

|
#36
Central St
Franklin, NH 03235
|
- sq. feet
|
- baths - beds |
show details | |

|
#37
Annis Dr Unit 10
Gilford, NH 03249
|
- sq. feet
|
- baths - beds |
show details | |

|
#38
Streeter Woods Rd
Rumney, NH 03266
|
- sq. feet
|
- baths - beds |
show details | |

|
#39
Prospect St Apt 2
Tilton, NH 03276
|
- sq. feet
|
- baths - beds |
show details | |

|
#40
Scribner Rd # 78
Tilton, NH 03276
|
- sq. feet
|
- baths - beds |
show details |
| Photo | Address | Area | Beds / Baths | Price | Details |
|---|---|---|---|---|---|

|
#41
Clark St
Belmont, NH 03220
|
960 sq. feet
|
- baths - beds |
show details | |

|
#42
Merrimac St # 1
Laconia, NH 03246
|
- sq. feet
|
- baths - beds |
show details | |

|
#43
Lynnewood Rd
Laconia, NH 03246
|
- sq. feet
|
- baths - beds |
show details | |

|
#44
Kimball Rd
Gilford, NH 03249
|
- sq. feet
|
- baths - beds |
show details | |

|
#45
Kimball Rd
Gilford, NH 03249
|
- sq. feet
|
- baths - beds |
show details | |

|
#46
Fellows Ln
Salisbury, NH 03268
|
- sq. feet
|
- baths - beds |
show details | |

|
#47
Snow Rd
Hill, NH 03243
|
- sq. feet
|
- baths - beds |
show details | |

|
#48
Peverly Rd
Tilton, NH 03276
|
- sq. feet
|
- baths - beds |
show details | |

|
#49
Hidden Ln
Tilton, NH 03276
|
- sq. feet
|
- baths - beds |
show details | |

|
Check over 1 million property listings on Foreclosure.com!
|
browse all offers | |||

Latest news about housing in Bristol, NH collected exclusively by city-data.com from local newspapers, TV, and radio stations

 | What's it like to live in or near Plymouth? (6 replies) |
| Special Ed in Windham vs Hampstead (37 replies) |
| Thinking about buying a vacation home in NH, any suggestions would appreciated. Thank you!! (15 replies) |
| NH for retirement - Insight Please... (65 replies) |
| Relocating from FL to NH (65 replies) |
| Relocating to rural New England (18 replies) |
Median year apartment built: 1981
Household type by relationship:
Households: 2,101- Male householders: 427 (95 living alone), Female householders: 350 (102 living alone)
304 spouses (304 opposite-sex spouses), 122 unmarried partners, (122 opposite-sex unmarried partners), 697 children (674 natural, 0 adopted, 23 stepchildren), 39 grandchildren, 52 brothers or sisters, 80 parents, 0 foster children, 7 other relatives, 0 non-relatives
- In group quarters: 21
Size of family households: 262 2-persons, 154 3-persons, 111 4-persons, 66 5-persons, 12 6-persons.
Size of nonfamily households: 196 1-person, 39 2-persons.
275 married couples with children.
259 single-parent households (22 men, 237 women).
93.9% of residents of Bristol speak English at home.
0.9% of residents speak other Indo-European language at home (100% speak English very well).
4.3% of residents speak Asian or Pacific Island language at home (84% speak English very well, 9% speak English well, 7% speak English not well).
Foreign born population: 107 (5.1%)
(97.2% of them are naturalized citizens)
| Here: | 6.1 |
| State: | 6.4 |
| Here: | 3.9 |
| State: | 4.0 |

- Bedrooms in owner-occupied houses and condos in Bristol, New Hampshire
- 0no bedroom
- 81 bedroom
- 1462 bedrooms
- 3073 bedrooms
- 34 bedrooms
- 525+ bedrooms

- Bedrooms in renter-occupied apartments in Bristol, New Hampshire
- 30no bedroom
- 681 bedroom
- 1292 bedrooms
- 853 bedrooms
- 84 bedrooms
- 05+ bedrooms

- Cars and other vehicles available in Bristol in owner-occupied houses/condos
- 9no vehicle
- 1661 vehicle
- 1282 vehicles
- 1873 vehicles
- 264 vehicles
- 05+ vehicles
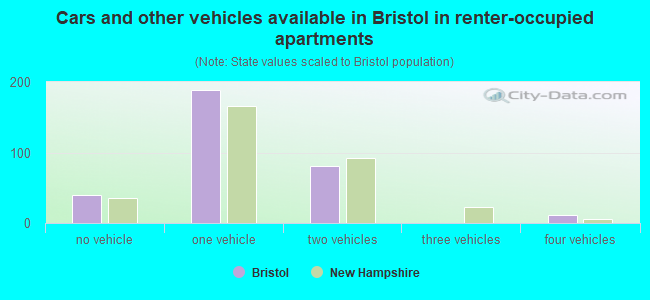
- Cars and other vehicles available in Bristol in renter-occupied apartments
- 40no vehicle
- 1881 vehicle
- 812 vehicles
- 03 vehicles
- 124 vehicles
- 05+ vehicles

- Rooms in owner-occupied houses in Bristol, New Hampshire
- 01 room
- 02 rooms
- 403 rooms
- 284 rooms
- 835 rooms
- 2106 rooms
- 437 rooms
- 188 rooms
- 939+ rooms

- Rooms in renter-occupied apartments in Bristol, New Hampshire
- 301 room
- 112 rooms
- 573 rooms
- 1214 rooms
- 725 rooms
- 196 rooms
- 07 rooms
- 08 rooms
- 109+ rooms


Bristol, NH household income distribution

- 72Less than $10,000
- 45$10,000 to $19,999
- 48$20,000 to $29,999
- 134$30,000 to $39,999
- 83$40,000 to $49,999
- 38$50,000 to $59,999
- 28$60,000 to $74,999
- 235$75,000 to $99,999
- 108$100,000 to $124,999
- 38$125,000 to $149,999
- 11$150,000 to $199,999
- 4$200,000 or more

Home value of owner - occupied houses in 2022 in Bristol, NH
-
- 6Less than $10,000
- 8$20,000 to $24,999
- 4$25,000 to $29,999
- 8$70,000 to $79,999
- 12$80,000 to $89,999
- 12$90,000 to $99,999
- 35$100,000 to $124,999
- 42$125,000 to $149,999
- 44$150,000 to $174,999
- 50$175,000 to $199,999
- 60$200,000 to $249,999
- 71$250,000 to $299,999
- 29$300,000 to $399,999
- 9$400,000 to $499,999

Rent paid by renters in 2022 in Bristol, NH
-
- 7$200 to $249
- 17$250 to $299
- 9$300 to $349
- 22$400 to $449
- 9$450 to $499
- 11$500 to $549
- 7$550 to $599
- 21$700 to $749
- 33$800 to $899
- 75$900 to $999
- 94$1,000 to $1,249
- 21$1,250 to $1,499
- 3$2,000 to $2,499
- 9No cash rent

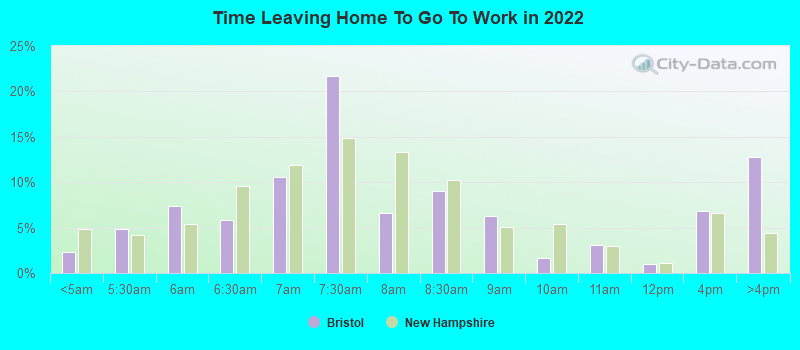
Percentage of workers working in this county: 53.8%
Number of people working at home: 106 (10.2% of all workers)
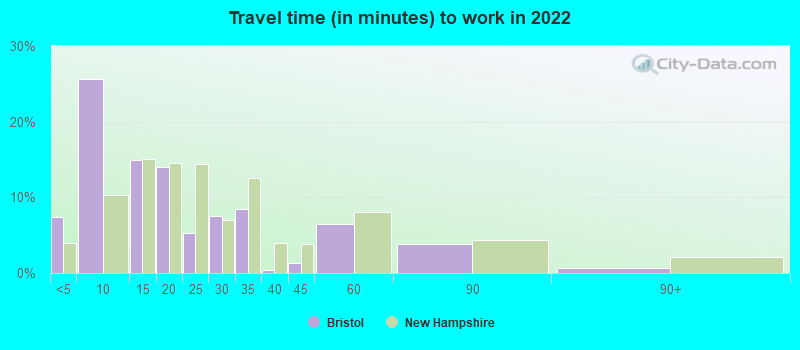
Travel time to work (commute)
- Less than 5 minutes: 105
- 5 to 9 minutes: 59
- 10 to 14 minutes: 94
- 15 to 19 minutes: 76
- 20 to 24 minutes: 42
- 25 to 29 minutes: 40
- 30 to 34 minutes: 213
- 35 to 39 minutes: 47
- 40 to 44 minutes: 0
- 45 to 59 minutes: 140
- 60 to 89 minutes: 20
- 90 or more minutes: 60
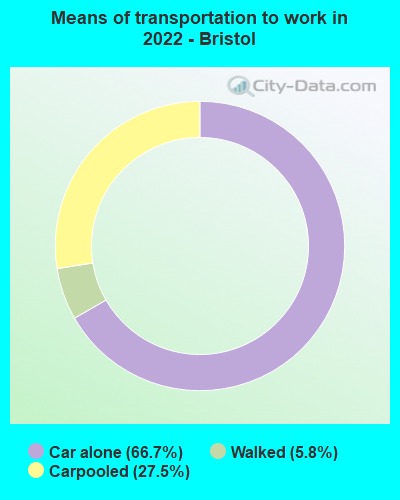
Means of transportation to work:
- Drove a car alone: 936 (59.2%)
- Carpooled: 459 (29.0%)
- Walked: 81 (5.1%)
- Worked at home: 106 (6.7%)
- Unemployment by race in 2022
- Unemployment rate for White non-Hispanic residents
- 6.9%Males

- Year of entry for the foreign-born population in Bristol, New Hampshire
- 112010 or later
- 12000 to 2009
- 661990 to 1999
- 01980 to 1989
- 41970 to 1979
- 13Before 1970
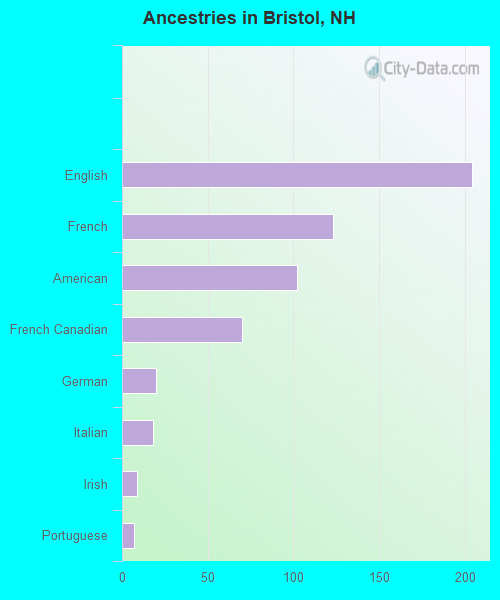
First ancestries reported:
- English: 204 (33.4%)
- French: 123 (20.2%)
- American: 102 (16.7%)
- French Canadian: 70 (11.5%)
- German: 20 (3.3%)
- Italian: 18 (2.9%)
- Irish: 9 (1.5%)
- Portuguese: 7 (1.1%)
Most common places of birth for foreign-born residents (%):
| Bristol: | 58.3% (60) |
| New Hampshire: | 0.6% (512) |
| Bristol: | 29.1% (30) |
| New Hampshire: | 0.5% (419) |
| Bristol: | 7.8% (8) |
| New Hampshire: | 9.1% (7,618) |
Place of birth for U.S.-born residents:
- This state: 1,227
- Other state: 739
- Northeast: 510
- Midwest: 21
- South: 108
- West: 97
75.7% of Bristol residents lived in the same house 1 years ago.
Out of people who lived in different houses, 25.8% lived in this county.
Out of people who lived in different counties, 92.0% lived in New Hampshire.
| Bristol: | 75.7% |
| State average: | 89.8% |
Education attainment for males 25 years and older:
- No schooling: 130
- Nursery to 4th grade: 0
- 5th and 6th grade: 0
- 7th and 8th grade: 5
- 9th grade: 0
- 10th grade: 0
- 11th grade: 16
- 12th grade, no diploma: 0
- High school graduate (or equivalency): 261
- Less than 1 year of college: 115
- Some college more than 1 year, no degree: 31
- Associate degree: 30
- Bachelor's degree: 117
- Master's degree: 11
- Professional school degree: 5
- Doctorate degree: 0

Education attainment for females 25 years and older:
- No schooling: 33
- Nursery to 4th grade: 0
- 5th and 6th grade: 0
- 7th and 8th grade: 0
- 9th grade: 0
- 10th grade: 0
- 11th grade: 5
- 12th grade, no diploma: 0
- High school graduate (or equivalency): 301
- Less than 1 year of college: 88
- Some college more than 1 year, no degree: 129
- Associate degree: 119
- Bachelor's degree: 77
- Master's degree: 16
- Professional school degree: 0
- Doctorate degree: 0

Housing units in structures:
- One, detached: 529
- One, attached: 8
- Two: 99
- 3 or 4: 75
- 5 to 9: 86
- 10 to 19: 26
- 20 to 49: 32
- Mobile homes: 94
Median worth of mobile homes: $87,134
Housing units lacking complete kitchen facilities in 2022: 3.5%
House/condo owner moved in on average 6 years ago
Renter moved in on average 5 years ago


- 77.6%Fuel oil, kerosene, etc.
- 16.1%Wood
- 6.3%Bottled, tank, or LP gas

- 51.2%Fuel oil, kerosene, etc.
- 19.2%Bottled, tank, or LP gas
- 14.1%Electricity
- 12.5%Utility gas
- 3.0%No fuel used
Private vs. public school enrollment:
| Here: | 0.0% |
| New Hampshire: | 11.4% |
| Here: | 0.0% |
| New Hampshire: | 14.0% |
| Here: | 23.3% |
| New Hampshire: | 38.0% |


