Brookline, MA (Massachusetts) Houses and Residents
| Brookline: | $1,256,267 |
| Massachusetts: | $534,700 |
Mean price in 2022:
Detached houses: $2,191,273
Here: $2,191,273 State: $651,570 Townhouses or other attached units: $2,115,513
Here: $2,115,513 State: $617,749 In 2-unit structures: $1,140,717
Here: $1,140,717 State: $594,808 In 3-to-4-unit structures: $1,214,858
Here: $1,214,858 State: $601,912 In 5-or-more-unit structures: $895,633
Here: $895,633 State: $555,768
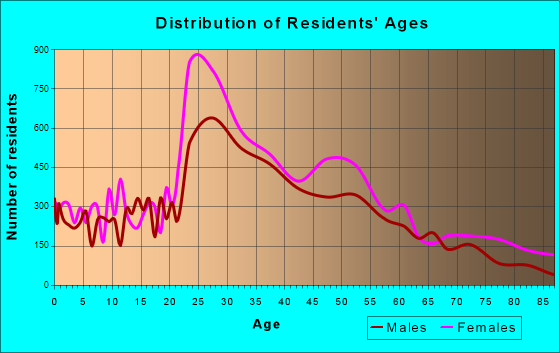
Total population: 58,732 (Urban population: 57,061, Rural population: 0)
Houses: 28,967 (27,326 occupied: 12,602 owner occupied, 14,580 renter occupied)
| % of renters here: | 54% |
| State: | 38% |
Housing density: 4,266 houses/condos per square mile
Median price asked for vacant for-sale houses and condos in 2022: $884,854.
Median contract rent in 2022: over $2,000 (lower quartile is $1,935, upper quartile is over $2,000)
Median rent asked for vacant for-rent units in 2022: $2,261
Median gross rent in Brookline, MA in 2022: over $2,000
Housing units in Brookline with a mortgage: 7,176 (1,350 second mortgage, 130 home equity loan, 1,033 both second mortgage and home equity loan)
Houses without a mortgage: 338
Median household income for houses/condos with a mortgage: $247,407
Median household income for apartments without a mortgage: $169,447
Median monthly housing costs: $2,731
Compare current foreclosures near Brookline, MA:
| Photo | Address | Area | Beds / Baths | Price | Details |
|---|---|---|---|---|---|

|
#1
White Pl
Brookline, MA 02445
|
1,081 sq. feet
|
1 baths 3 beds |
show details | |

|
#2
Parkman St Apt 1
Brookline, MA 02446
|
672 sq. feet
|
1 baths 1 beds |
show details | |

|
#3
Oakland Rd
Brookline, MA 02445
|
2,741 sq. feet
|
2 baths 5 beds |
show details | |

|
#4
Pond Ave Apt 1103
Brookline, MA 02445
|
860 sq. feet
|
1 baths 1 beds |
show details | |

|
#5
Park St Apt 2a
Brookline, MA 02446
|
- sq. feet
|
- baths - beds |
show details | |

|
#6
Claflin Rd # 3
Brookline, MA 02445
|
- sq. feet
|
- baths - beds |
show details | |

|
#7
White Pl
Brookline, MA 02445
|
- sq. feet
|
- baths - beds |
show details | |

|
#8
Amory St Apt 10
Brookline, MA 02446
|
- sq. feet
|
- baths - beds |
show details | |

|
#9
High St Apt 5
Brookline, MA 02445
|
- sq. feet
|
- baths - beds |
show details | |

|
#10
Boyd St
Boston, MA 02124
|
3,970 sq. feet
|
3 baths 9 beds |
$650,000
|
show details |
| Photo | Address | Area | Beds / Baths | Price | Details |
|---|---|---|---|---|---|

|
#11
Tall Oaks Dr Unit 508
South Weymouth, MA 02190
|
1,300 sq. feet
|
2 baths 2 beds |
$285,000
|
show details |

|
#12
Park Ave Apt 614
Hull, MA 02045
|
1,109 sq. feet
|
2 baths 2 beds |
$350,000
|
show details |

|
#13
Porrazzo Rd # 2
Hull, MA 02045
|
1,203 sq. feet
|
2 baths 2 beds |
$329,900
|
show details |

|
#14
Stillman St
Framingham, MA 01702
|
1,122 sq. feet
|
1 baths 2 beds |
$418,000
|
show details |

|
#15
Johnson Rd
North Weymouth, MA 02191
|
748 sq. feet
|
1 baths 2 beds |
$365,000
|
show details |

|
#16
Portland St
Lynn, MA 01902
|
851 sq. feet
|
2 baths 2 beds |
show details | |

|
#17
Church St
Boston, MA 02122
|
3,663 sq. feet
|
3 baths 6 beds |
show details | |

|
#18
Kendrick Ave Apt 307
Quincy, MA 02169
|
1,234 sq. feet
|
2 baths 2 beds |
show details | |

|
#19
Laarhoven Ter
Stoughton, MA 02072
|
1,034 sq. feet
|
1 baths 3 beds |
show details | |

|
#20
Garden St
Milton, MA 02186
|
1,878 sq. feet
|
1 baths 3 beds |
show details |
| Photo | Address | Area | Beds / Baths | Price | Details |
|---|---|---|---|---|---|

|
#21
Lincoln Ave
Saugus, MA 01906
|
1,080 sq. feet
|
1 baths 3 beds |
show details | |

|
#22
Forest St
Boston, MA 02119
|
1,540 sq. feet
|
1 baths 3 beds |
show details | |

|
#23
Forest Park Rd
Woburn, MA 01801
|
1,132 sq. feet
|
1 baths 3 beds |
show details | |

|
#24
Bower St
Medford, MA 02155
|
2,323 sq. feet
|
2 baths 4 beds |
show details | |

|
#25
Vinal St
Revere, MA 02151
|
2,715 sq. feet
|
2 baths 4 beds |
show details | |

|
#26
Victoria Cir
Norwood, MA 02062
|
2,980 sq. feet
|
3 baths 5 beds |
show details | |

|
#27
Margin Street
Lynn, MA 01905
|
1,240 sq. feet
|
2 baths 2 beds |
show details | |

|
#28
Eastern Ave
Malden, MA 02148
|
2,288 sq. feet
|
3 baths 4 beds |
show details | |

|
#29
Webster St
Randolph, MA 02368
|
1,080 sq. feet
|
1 baths 3 beds |
show details | |

|
#30
Washington St
Hyde Park, MA 02136
|
2,980 sq. feet
|
3 baths 5 beds |
show details |
| Photo | Address | Area | Beds / Baths | Price | Details |
|---|---|---|---|---|---|

|
#31
Emily Jeffers Rd # L
Randolph, MA 02368
|
1,350 sq. feet
|
1 baths 3 beds |
show details | |

|
#32
Bainbridge St
Malden, MA 02148
|
1,600 sq. feet
|
1 baths 3 beds |
show details | |

|
#33
Ballou St
Quincy, MA 02169
|
1,758 sq. feet
|
1 baths 3 beds |
show details | |

|
#34
Baker St
West Roxbury, MA 02132
|
2,614 sq. feet
|
3 baths 4 beds |
show details | |

|
#35
Tower Farm Rd
Billerica, MA 01821
|
1,650 sq. feet
|
2 baths 3 beds |
show details | |

|
#36
Tobey Ln
Wakefield, MA 01880
|
3,240 sq. feet
|
2 baths 4 beds |
show details | |

|
#37
Ridgehill Rd
Canton, MA 02021
|
1,196 sq. feet
|
1 baths 3 beds |
show details | |

|
#38
Grv St
Needham, MA 02492
|
6,542 sq. feet
|
4 baths 7 beds |
show details | |

|
#39
Essex St
Swampscott, MA 01907
|
2,029 sq. feet
|
2 baths 3 beds |
show details | |

|
#40
Gilbert Rd
Needham, MA 02492
|
1,778 sq. feet
|
2 baths 3 beds |
show details |
| Photo | Address | Area | Beds / Baths | Price | Details |
|---|---|---|---|---|---|

|
#41
Savin Hill Avenue, Unit 2 190 Savin Hill Avenue Condominium
Boston, MA 02125
|
1,022 sq. feet
|
1 baths 2 beds |
show details | |

|
#42
Iroquois St
Boston, MA 02120
|
2,524 sq. feet
|
1 baths 4 beds |
show details | |

|
#43
Chestnut St
Lynn, MA 01902
|
5,391 sq. feet
|
3 baths 9 beds |
show details | |

|
#44
Congress Pl
Dedham, MA 02026
|
1,966 sq. feet
|
2 baths 4 beds |
show details | |

|
#45
Vernal St
Everett, MA 02149
|
2,601 sq. feet
|
2 baths 5 beds |
show details | |

|
#46
Brahms St
Roslindale, MA 02131
|
1,604 sq. feet
|
1 baths 4 beds |
show details | |

|
#47
Gay St
Quincy, MA 02169
|
1,330 sq. feet
|
1 baths 4 beds |
show details | |

|
#48
Atlantic Street, Unit A 10 A/k/a Unit 10, Marilyn Condominium
Lynn, MA 01902
|
576 sq. feet
|
1 baths 1 beds |
show details | |

|
#49
Cora St
Winthrop, MA 02152
|
1,452 sq. feet
|
1 baths 2 beds |
show details | |

|
Check over 1 million property listings on Foreclosure.com!
|
browse all offers | |||

Latest news about housing in Brookline, MA collected exclusively by city-data.com from local newspapers, TV, and radio stations

 | How Much Massachusetts Households Make Per Year: Census Data (37 replies) |
| Arrmed home invastion in Brookline (19 replies) |
| ISO Boston-area condos with vibrant social scene for intellectual elderly (8 replies) |
| Need Cheap Family Housing Near Brookline (18 replies) |
| 2022 Real Estate Observations (1122 replies) |
| would you purchase a SF home in Newton, Brookline or Condo in Boston? (14 replies) |
Median year apartment built: 1954
Household type by relationship:
Households: 62,994- Male householders: 12,490 (2,660 living alone), Female householders: 14,555 (6,057 living alone)
11,271 spouses (11,097 opposite-sex spouses), 1,657 unmarried partners, (1,537 opposite-sex unmarried partners), 13,705 children (13,288 natural, 323 adopted, 93 stepchildren), 89 grandchildren, 385 brothers or sisters, 445 parents, 5 foster children, 512 other relatives, 6,433 non-relatives
- In group quarters: 1,442
Size of family households: 5,911 2-persons, 2,725 3-persons, 3,006 4-persons, 1,028 5-persons, 263 6-persons, 90 7-or-more-persons.
Size of nonfamily households: 9,100 1-person, 3,106 2-persons, 1,528 3-persons, 425 4-persons, 25 5-persons, 23 6-persons.
10,012 married couples with children.
1,394 single-parent households (262 men, 1,132 women).
66.3% of residents of Brookline speak English at home.
5.5% of residents speak Spanish at home (82% speak English very well, 15% speak English well, 3% speak English not well).
12.4% of residents speak other Indo-European language at home (80% speak English very well, 13% speak English well, 6% speak English not well, 1% don't speak English at all).
11.9% of residents speak Asian or Pacific Island language at home (64% speak English very well, 24% speak English well, 8% speak English not well, 4% don't speak English at all).
4.4% of residents speak other language at home (84% speak English very well, 13% speak English well, 3% speak English not well).
Foreign born population: 18,933 (30.1%)
(43.5% of them are naturalized citizens)
| Here: | 6.4 |
| State: | 6.5 |
| Here: | 3.8 |
| State: | 4.0 |

- Bedrooms in owner-occupied houses and condos in Brookline, Massachusetts
- 79no bedroom
- 1,0511 bedroom
- 3,3052 bedrooms
- 3,6243 bedrooms
- 2,5514 bedrooms
- 1,9925+ bedrooms

- Bedrooms in renter-occupied apartments in Brookline, Massachusetts
- 1,412no bedroom
- 4,6281 bedroom
- 5,0262 bedrooms
- 2,4933 bedrooms
- 8954 bedrooms
- 1275+ bedrooms

- Cars and other vehicles available in Brookline in owner-occupied houses/condos
- 1,321no vehicle
- 6,1911 vehicle
- 4,0892 vehicles
- 8973 vehicles
- 1054 vehicles
- 05+ vehicles

- Cars and other vehicles available in Brookline in renter-occupied apartments
- 6,482no vehicle
- 6,6051 vehicle
- 1,3172 vehicles
- 1103 vehicles
- 104 vehicles
- 575+ vehicles

- Rooms in owner-occupied houses in Brookline, Massachusetts
- 681 room
- 2062 rooms
- 9283 rooms
- 1,6874 rooms
- 1,8245 rooms
- 1,7306 rooms
- 1,7197 rooms
- 1,0618 rooms
- 3,3809+ rooms

- Rooms in renter-occupied apartments in Brookline, Massachusetts
- 1,1891 room
- 1,4172 rooms
- 3,6343 rooms
- 3,4534 rooms
- 2,2385 rooms
- 1,3416 rooms
- 6277 rooms
- 4158 rooms
- 2689+ rooms


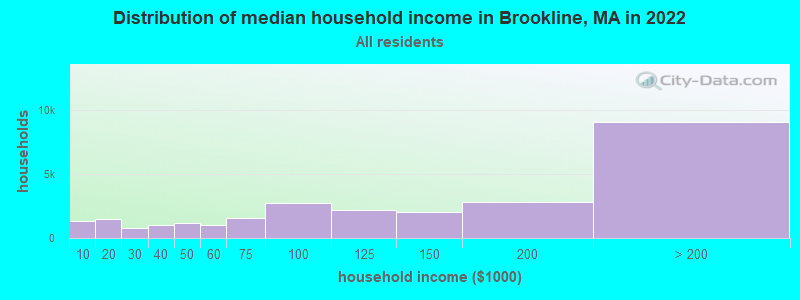
Brookline, MA household income distribution

- 1,298Less than $10,000
- 1,519$10,000 to $19,999
- 782$20,000 to $29,999
- 1,016$30,000 to $39,999
- 1,146$40,000 to $49,999
- 999$50,000 to $59,999
- 1,560$60,000 to $74,999
- 2,736$75,000 to $99,999
- 2,203$100,000 to $124,999
- 2,049$125,000 to $149,999
- 2,840$150,000 to $199,999
- 9,042$200,000 or more
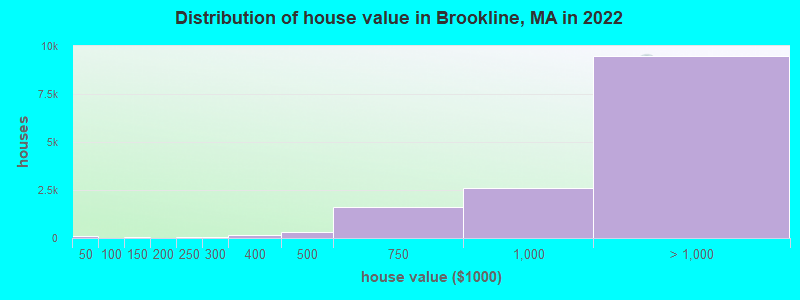
Home value of owner - occupied houses in 2022 in Brookline, MA
-
- 73Less than $10,000
- 34$10,000 to $14,999
- 48$100,000 to $124,999
- 7$150,000 to $174,999
- 56$200,000 to $249,999
- 51$250,000 to $299,999
- 140$300,000 to $399,999
- 294$400,000 to $499,999
- 1,629$500,000 to $749,999
- 2,578$750,000 to $999,999
- 3,851$1,000,000 to $1,499,999
- 1,980$1,500,000 to $1,999,999
- 3,649$2,000,000 or more
Rent paid by renters in 2022 in Brookline, MA
-
- 148Less than $100
- 63$150 to $199
- 178$200 to $249
- 723$250 to $299
- 139$300 to $349
- 58$350 to $399
- 59$400 to $449
- 68$450 to $499
- 113$500 to $549
- 28$550 to $599
- 27$600 to $649
- 12$650 to $699
- 98$700 to $749
- 21$750 to $799
- 148$800 to $899
- 99$900 to $999
- 122$1,000 to $1,249
- 309$1,250 to $1,499
- 1,280$1,500 to $1,999
- 2,908$2,000 to $2,499
- 3,508$2,500 to $2,999
- 2,590$3,000 to $3,499
- 2,385$3,500 or more
- 146No cash rent


Percentage of workers working in this county: 39.2%
Number of people working at home: 10,634 (29.3% of all workers)
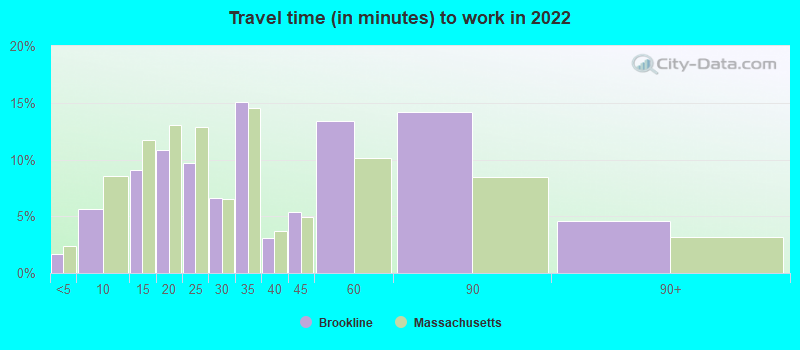
Travel time to work (commute)
- Less than 5 minutes: 227
- 5 to 9 minutes: 1,051
- 10 to 14 minutes: 2,417
- 15 to 19 minutes: 4,239
- 20 to 24 minutes: 3,647
- 25 to 29 minutes: 1,865
- 30 to 34 minutes: 4,990
- 35 to 39 minutes: 1,513
- 40 to 44 minutes: 1,790
- 45 to 59 minutes: 3,022
- 60 to 89 minutes: 1,257
- 90 or more minutes: 268
Means of transportation to work:
- Drove a car alone: 11,558 (40.9%)
- Carpooled: 1,268 (4.5%)
- Bus: 686 (2.4%)
- Subway or elevated rail: 1,879 (6.7%)
- Long-distance train or commuter rail: 231 (0.8%)
- Light rail, streetcar or trolley: 70 (0.2%)
- Taxi: 288 (1.0%)
- Bicycle: 256 (0.9%)
- Walked: 2,009 (7.1%)
- Worked at home: 10,634 (37.6%)

- Unemployment by race in 2022
- Unemployment rate for White non-Hispanic residents
- 3.5%Males
- 2.5%Females
- Unemployment rate for Black residents
- 12.0%Males
- 7.0%Females
- Unemployment rate for Asian residents
- 1.0%Males
- 3.3%Females
- Unemployment rate for other race residents
- 14.1%Males
- 1.3%Females
- Unemployment rate for two or more race residents
- 3.1%Males
- Unemployment rate for Hispanic or Latino residents
- 5.9%Males
- 0.7%Females

- Year of entry for the foreign-born population in Brookline, Massachusetts
- 10,7092010 or later
- 2,5762000 to 2009
- 2,6401990 to 1999
- 3,1541980 to 1989
- 1,8011970 to 1979
- 2,089Before 1970
First ancestries reported:
- Irish: 1,937 (6.0%)
- Israeli: 1,264 (3.9%)
- European: 1,188 (3.7%)
- English: 1,089 (3.4%)
- Russian: 1,078 (3.3%)
- American: 1,001 (3.1%)
- Eastern European: 984 (3.0%)
- Italian: 962 (3.0%)
- German: 722 (2.2%)
- Polish: 582 (1.8%)
- Ukrainian: 390 (1.2%)
- Portuguese: 318 (1.0%)
- Iranian: 266 (0.8%)
- Scottish: 264 (0.8%)
- French: 262 (0.8%)
- Albanian: 252 (0.8%)
- Romanian: 229 (0.7%)
- French Canadian: 208 (0.6%)
- Greek: 190 (0.6%)
- Canadian: 170 (0.5%)
- Dutch: 164 (0.5%)
- Brazilian: 163 (0.5%)
- Ethiopian: 161 (0.5%)
- Danish: 147 (0.5%)
- British: 139 (0.4%)
- Bulgarian: 137 (0.4%)
- Northern European: 128 (0.4%)
- Jordanian: 125 (0.4%)
- Egyptian: 124 (0.4%)
- Scotch-Irish: 110 (0.3%)
- Afghan: 106 (0.3%)
- Swedish: 103 (0.3%)
- Serbian: 101 (0.3%)
- Hungarian: 99 (0.3%)
- Turkish: 92 (0.3%)
- Austrian: 86 (0.3%)
- Arab: 79 (0.2%)
- Syrian: 74 (0.2%)
- Lebanese: 71 (0.2%)
- Armenian: 66 (0.2%)
- Swiss: 66 (0.2%)
- Slavic: 52 (0.2%)
- Belgian: 45 (0.1%)
- Moroccan: 43 (0.1%)
- Norwegian: 37 (0.1%)
- South African: 34 (0.1%)
- Latvian: 28 (0.09%)
- Scandinavian: 25 (0.08%)
- Nigerian: 25 (0.08%)
- Lithuanian: 23 (0.07%)
- Ugandan: 19 (0.06%)
- Cypriot: 17 (0.05%)
- Finnish: 15 (0.05%)
- Haitian: 15 (0.05%)
- Welsh: 14 (0.04%)
- Slovak: 12 (0.04%)
- Pennsylvania German: 11 (0.03%)
- Kenyan: 11 (0.03%)
- Jamaican: 9 (0.03%)
- Czech: 7 (0.02%)
- Sudanese: 7 (0.02%)
- Barbadian: 7 (0.02%)
- Ghanaian: 3 (0.01%)
- Liberian: 3 (0.01%)
Most common places of birth for foreign-born residents (%):
| Brookline: | 14.0% (2,637) |
| Massachusetts: | 8.4% (103,233) |
| Brookline: | 12.8% (2,416) |
| Massachusetts: | 0.5% (6,073) |
| Brookline: | 6.8% (1,281) |
| Massachusetts: | 6.8% (82,934) |
| Brookline: | 5.8% (1,087) |
| Massachusetts: | 1.4% (17,613) |
| Brookline: | 4.9% (917) |
| Massachusetts: | 0.6% (7,301) |
| Brookline: | 3.2% (610) |
| Massachusetts: | 1.5% (18,278) |
| Brookline: | 3.0% (567) |
| Massachusetts: | 2.3% (28,158) |
| Brookline: | 2.7% (511) |
| Massachusetts: | 0.9% (10,808) |
| Brookline: | 2.6% (487) |
| Massachusetts: | 7.6% (92,959) |
| Brookline: | 2.5% (475) |
| Massachusetts: | 2.3% (27,810) |
| Brookline: | 2.2% (412) |
| Massachusetts: | 1.0% (12,709) |
| Brookline: | 2.1% (389) |
| Massachusetts: | 0.7% (8,270) |
| Brookline: | 1.7% (315) |
| Massachusetts: | 0.6% (7,213) |
| Brookline: | 1.7% (311) |
| Massachusetts: | 0.7% (8,536) |
| Brookline: | 1.5% (291) |
| Massachusetts: | 1.0% (12,529) |
| Brookline: | 1.5% (291) |
| Massachusetts: | 1.4% (16,886) |
Place of birth for U.S.-born residents:
- This state: 19,326
- Other state: 24,191
- Northeast: 11,879
- Midwest: 4,008
- South: 5,127
- West: 3,323
77.1% of Brookline residents lived in the same house 1 years ago.
Out of people who lived in different houses, 20.7% lived in this county.
Out of people who lived in different counties, 47.4% lived in Massachusetts.
| Brookline: | 77.1% |
| State average: | 87.7% |
Education attainment for males 25 years and older:
- No schooling: 186
- Nursery to 4th grade: 39
- 5th and 6th grade: 0
- 7th and 8th grade: 99
- 9th grade: 0
- 10th grade: 0
- 11th grade: 86
- 12th grade, no diploma: 125
- High school graduate (or equivalency): 841
- Less than 1 year of college: 255
- Some college more than 1 year, no degree: 526
- Associate degree: 284
- Bachelor's degree: 4,660
- Master's degree: 4,728
- Professional school degree: 3,659
- Doctorate degree: 3,391

Education attainment for females 25 years and older:
- No schooling: 250
- Nursery to 4th grade: 6
- 5th and 6th grade: 29
- 7th and 8th grade: 108
- 9th grade: 24
- 10th grade: 21
- 11th grade: 42
- 12th grade, no diploma: 28
- High school graduate (or equivalency): 1,467
- Less than 1 year of college: 409
- Some college more than 1 year, no degree: 1,029
- Associate degree: 560
- Bachelor's degree: 6,938
- Master's degree: 6,875
- Professional school degree: 2,434
- Doctorate degree: 3,624

Housing units in structures:
- One, detached: 5,178
- One, attached: 1,538
- Two: 2,561
- 3 or 4: 4,517
- 5 to 9: 4,969
- 10 to 19: 1,724
- 20 to 49: 2,965
- 50 or more: 5,501
- Mobile homes: 11
Housing units lacking complete kitchen facilities in 2022: 1.6%
House/condo owner moved in on average 12 years ago
Renter moved in on average 2 years ago

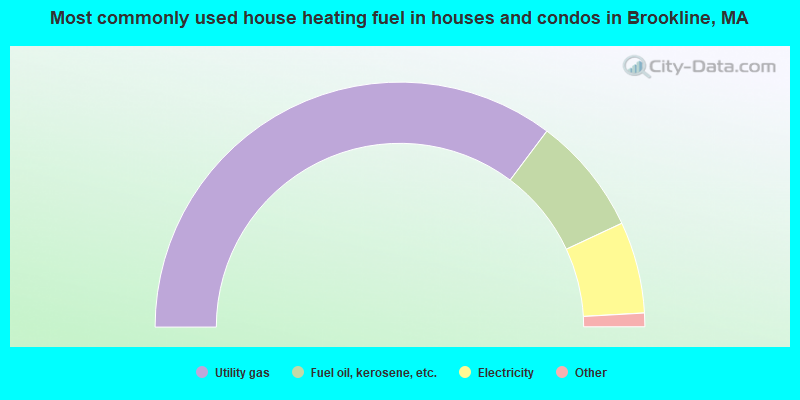
- 70.5%Utility gas
- 15.6%Fuel oil, kerosene, etc.
- 12.1%Electricity
- 1.3%Bottled, tank, or LP gas
- 0.3%Other fuel
- 0.1%No fuel used
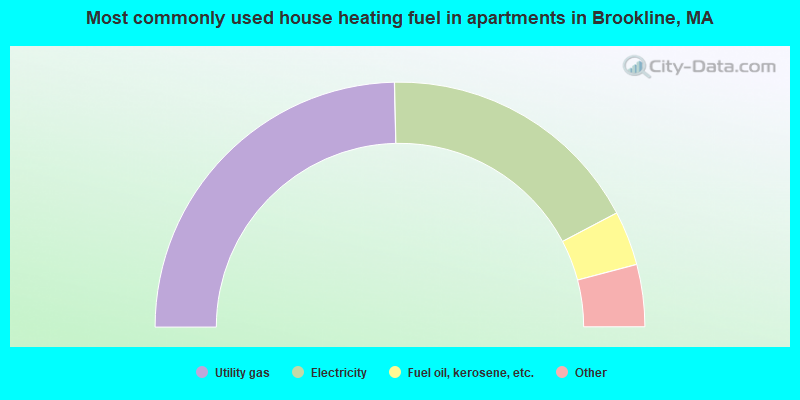
- 49.3%Utility gas
- 35.3%Electricity
- 7.2%Fuel oil, kerosene, etc.
- 3.5%Bottled, tank, or LP gas
- 2.5%Other fuel
- 2.1%No fuel used
- 0.1%Wood
Private vs. public school enrollment:
| Here: | 16.2% |
| Massachusetts: | 10.3% |
| Here: | 19.9% |
| Massachusetts: | 12.3% |
| Here: | 76.0% |
| Massachusetts: | 51.2% |


