Brownsburg, IN (Indiana) Houses and Residents
| Brownsburg: | $282,250 |
| Indiana: | $208,700 |
Mean price in 2022:
Detached houses: $284,091
Here: $284,091 State: $257,916 Townhouses or other attached units: $201,240
Here: $201,240 State: $224,114 In 3-to-4-unit structures: $248,126
Here: $248,126 State: $151,116
Total population: 23,322 (Urban population: 14,045, Rural population: 299 (all nonfarm))
Houses: 11,333 (10,890 occupied: 7,726 owner occupied, 3,113 renter occupied)
| % of renters here: | 29% |
| State: | 29% |
Housing density: 1,548 houses/condos per square mile
Median price asked for vacant for-sale houses and condos in 2022: $549,830.
Median contract rent in 2022: $1,184 (lower quartile is $908, upper quartile is $1,458)
Median rent asked for vacant for-rent units in 2022: $1,950
Median gross rent in Brownsburg, IN in 2022: $1,365
Housing units in Brownsburg with a mortgage: 5,701 (1,057 second mortgage, 24 home equity loan, 1,077 both second mortgage and home equity loan)
Houses without a mortgage: 58
Median household income for houses/condos with a mortgage: $117,643
Median household income for apartments without a mortgage: $73,874
Median monthly housing costs: $1,318
Compare current foreclosures in Brownsburg, IN:
| Photo | Address | Area | Beds / Baths | Price | Details |
|---|---|---|---|---|---|

|
#1
Farmington Trl
Brownsburg, IN 46112
|
3,120 sq. feet
|
3 baths 4 beds |
show details | |

|
#2
Westport Dr
Brownsburg, IN 46112
|
3,628 sq. feet
|
2 baths 4 beds |
show details | |

|
#3
Norman Rd
Brownsburg, IN 46112
|
1,290 sq. feet
|
1 baths 3 beds |
show details | |

|
#4
Daniel Cir
Brownsburg, IN 46112
|
1,920 sq. feet
|
2 baths 4 beds |
show details | |

|
#5
Tracy Ln
Brownsburg, IN 46112
|
2,136 sq. feet
|
2 baths 3 beds |
show details | |

|
#6
Jackson St
Brownsburg, IN 46112
|
1,102 sq. feet
|
1 baths 3 beds |
show details | |

|
#7
E County Road 700 N
Brownsburg, IN 46112
|
1,362 sq. feet
|
2 baths 3 beds |
show details | |

|
#8
Trails End
Brownsburg, IN 46112
|
1,402 sq. feet
|
2 baths 3 beds |
show details | |

|
#9
Allen Dr
Brownsburg, IN 46112
|
1,128 sq. feet
|
1 baths 3 beds |
show details | |

|
#10
S Grant St
Brownsburg, IN 46112
|
1,008 sq. feet
|
1 baths 3 beds |
show details |
| Photo | Address | Area | Beds / Baths | Price | Details |
|---|---|---|---|---|---|

|
#11
Holiday Ln E
Brownsburg, IN 46112
|
1,320 sq. feet
|
2 baths 2 beds |
show details | |

|
#12
Prairie Dr
Brownsburg, IN 46112
|
1,349 sq. feet
|
2 baths 3 beds |
show details | |

|
#13
Wyndham Ln
Brownsburg, IN 46112
|
1,558 sq. feet
|
2 baths 3 beds |
show details | |

|
#14
Crooked Stick Dr
Brownsburg, IN 46112
|
2,108 sq. feet
|
2 baths 3 beds |
show details | |

|
#15
King Fisher Dr
Brownsburg, IN 46112
|
2,232 sq. feet
|
3 baths 3 beds |
show details | |

|
#16
Longview Bnd
Brownsburg, IN 46112
|
2,064 sq. feet
|
2 baths 4 beds |
show details | |

|
#17
Black Lake Ct
Brownsburg, IN 46112
|
2,338 sq. feet
|
2 baths 3 beds |
show details | |

|
#18
E County Road 400 N
Brownsburg, IN 46112
|
4,238 sq. feet
|
2 baths 3 beds |
show details | |

|
#19
Hyde Park Row
Brownsburg, IN 46112
|
1,441 sq. feet
|
2 baths 3 beds |
show details | |

|
#20
Brooks Bnd
Brownsburg, IN 46112
|
1,920 sq. feet
|
2 baths 4 beds |
show details |
| Photo | Address | Area | Beds / Baths | Price | Details |
|---|---|---|---|---|---|

|
#21
Muirfield Dr
Brownsburg, IN 46112
|
1,290 sq. feet
|
2 baths 3 beds |
show details | |

|
#22
Thistle Finch
Brownsburg, IN 46112
|
3,988 sq. feet
|
2 baths - beds |
show details | |

|
#23
Valley Cir
Brownsburg, IN 46112
|
1,885 sq. feet
|
2 baths - beds |
show details | |

|
#24
E County Road 650 N
Brownsburg, IN 46112
|
2,204 sq. feet
|
2 baths - beds |
show details | |

|
#25
Blue Ridge Ln
Brownsburg, IN 46112
|
2,160 sq. feet
|
2 baths - beds |
show details | |

|
#26
Northpoint Dr
Brownsburg, IN 46112
|
3,140 sq. feet
|
2 baths - beds |
show details | |

|
#27
Huntsman Way
Brownsburg, IN 46112
|
4,111 sq. feet
|
4 baths - beds |
show details | |

|
#28
Hamden Rd
Brownsburg, IN 46112
|
1,753 sq. feet
|
2 baths - beds |
show details | |

|
#29
Collisi Pl
Brownsburg, IN 46112
|
- sq. feet
|
- baths - beds |
show details | |

|
#30
Derby Way, Apt 103
Brownsburg, IN 46112
|
- sq. feet
|
- baths - beds |
show details |
| Photo | Address | Area | Beds / Baths | Price | Details |
|---|---|---|---|---|---|

|
#31
E 56th St
Brownsburg, IN 46112
|
- sq. feet
|
- baths - beds |
show details | |

|
#32
N Enderly Ave Apt 5
Brownsburg, IN 46112
|
- sq. feet
|
- baths - beds |
show details | |

|
#33
Rothchild Pl Apt 205
Brownsburg, IN 46112
|
- sq. feet
|
- baths - beds |
show details | |

|
#34
Legacy Park Dr
Brownsburg, IN 46112
|
- sq. feet
|
- baths - beds |
show details | |

|
#35
Windhaven Cir Apt F
Brownsburg, IN 46112
|
- sq. feet
|
- baths - beds |
show details | |

|
#36
Templederry Dr
Brownsburg, IN 46112
|
- sq. feet
|
- baths - beds |
show details | |

|
#37
N County Road 575 E
Brownsburg, IN 46112
|
- sq. feet
|
- baths - beds |
show details | |

|
#38
Lacabreah Dr, Apt 304
Brownsburg, IN 46112
|
- sq. feet
|
- baths - beds |
show details | |

|
#39
E Douglas Dr
Brownsburg, IN 46112
|
- sq. feet
|
- baths - beds |
show details | |

|
#40
Weil Dr
Brownsburg, IN 46112
|
- sq. feet
|
- baths - beds |
show details |
| Photo | Address | Area | Beds / Baths | Price | Details |
|---|---|---|---|---|---|

|
#41
Shadow Dr
Brownsburg, IN 46112
|
- sq. feet
|
- baths - beds |
show details | |

|
#42
Westerfield Ct
Brownsburg, IN 46112
|
- sq. feet
|
- baths - beds |
show details | |

|
#43
Long Branch Dr
Brownsburg, IN 46112
|
- sq. feet
|
- baths - beds |
show details | |

|
#44
Hayward Ave, Apt H
Brownsburg, IN 46112
|
- sq. feet
|
- baths - beds |
show details | |

|
#45
Legacy Park Dr Apt 304
Brownsburg, IN 46112
|
- sq. feet
|
- baths - beds |
show details | |

|
#46
Mansfield Dr
Brownsburg, IN 46112
|
- sq. feet
|
- baths - beds |
show details | |

|
#47
Locust Ln
Brownsburg, IN 46112
|
- sq. feet
|
- baths - beds |
show details | |

|
#48
Flagler Ln
Brownsburg, IN 46112
|
- sq. feet
|
- baths - beds |
show details | |

|
#49
Marden Trl
Brownsburg, IN 46112
|
- sq. feet
|
- baths - beds |
show details | |

|
Check over 1 million property listings on Foreclosure.com!
|
browse all offers | |||

Latest news about housing in Brownsburg, IN collected exclusively by city-data.com from local newspapers, TV, and radio stations

 | Whittington Village in Brownsburg Condos/Ranch Homes Info? (2 replies) |
| Commuting from Louisville to Indy (227 replies) |
| Safe and clean apartments in Indianapolis or near (6 replies) |
| Housing prices by suburb? (14 replies) |
| Burbs within 30-min of the city, new home? (4 replies) |
| Rental Homes on West Side (1 reply) |
Median year apartment built: 2001
Household type by relationship:
Households: 30,532- Male householders: 6,097 (877 living alone), Female householders: 4,802 (1,044 living alone)
6,829 spouses (6,797 opposite-sex spouses), 972 unmarried partners, (927 opposite-sex unmarried partners), 10,290 children (9,528 natural, 382 adopted, 379 stepchildren), 236 grandchildren, 101 brothers or sisters, 284 parents, 0 foster children, 286 other relatives, 330 non-relatives
- In group quarters: 298
Size of family households: 3,409 2-persons, 1,622 3-persons, 1,593 4-persons, 1,201 5-persons, 154 6-persons, 243 7-or-more-persons.
Size of nonfamily households: 2,148 1-person, 432 2-persons, 20 3-persons.
6,925 married couples with children.
1,200 single-parent households (371 men, 829 women).
91.0% of residents of Brownsburg speak English at home.
2.7% of residents speak Spanish at home (52% speak English very well, 12% speak English well, 36% speak English not well).
2.5% of residents speak other Indo-European language at home (60% speak English very well, 13% speak English well, 19% speak English not well, 7% don't speak English at all).
0.8% of residents speak Asian or Pacific Island language at home (78% speak English very well, 3% speak English well, 19% speak English not well).
3.3% of residents speak other language at home (96% speak English very well, 4% speak English well).
Foreign born population: 2,635 (8.6%)
(73.4% of them are naturalized citizens)
| Here: | 7.2 |
| State: | 6.6 |
| Here: | 4.5 |
| State: | 4.3 |
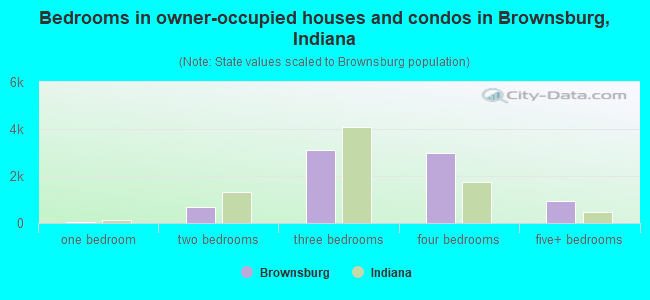
- Bedrooms in owner-occupied houses and condos in Brownsburg, Indiana
- 16no bedroom
- 281 bedroom
- 6772 bedrooms
- 3,0893 bedrooms
- 2,9794 bedrooms
- 9385+ bedrooms
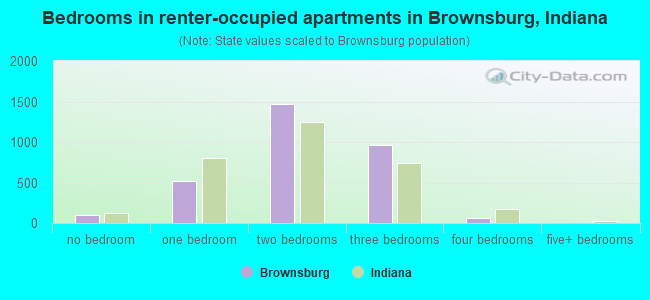
- Bedrooms in renter-occupied apartments in Brownsburg, Indiana
- 96no bedroom
- 5181 bedroom
- 1,4682 bedrooms
- 9693 bedrooms
- 624 bedrooms
- 05+ bedrooms
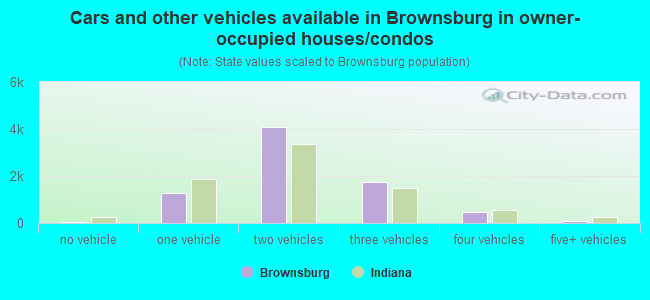
- Cars and other vehicles available in Brownsburg in owner-occupied houses/condos
- 57no vehicle
- 1,2851 vehicle
- 4,1002 vehicles
- 1,7573 vehicles
- 4644 vehicles
- 645+ vehicles
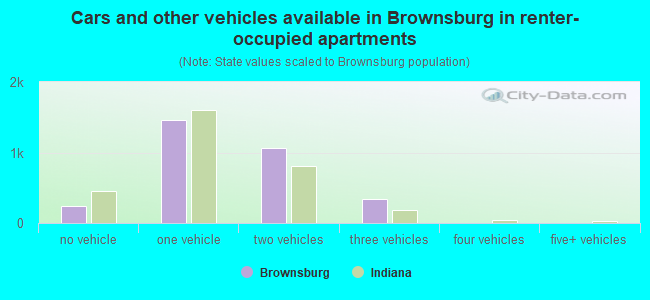
- Cars and other vehicles available in Brownsburg in renter-occupied apartments
- 243no vehicle
- 1,4621 vehicle
- 1,0652 vehicles
- 3433 vehicles
- 04 vehicles
- 05+ vehicles
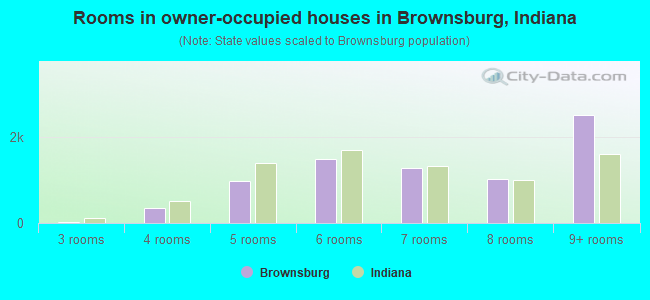
- Rooms in owner-occupied houses in Brownsburg, Indiana
- 161 room
- 02 rooms
- 283 rooms
- 3624 rooms
- 9815 rooms
- 1,5046 rooms
- 1,2847 rooms
- 1,0278 rooms
- 2,5269+ rooms
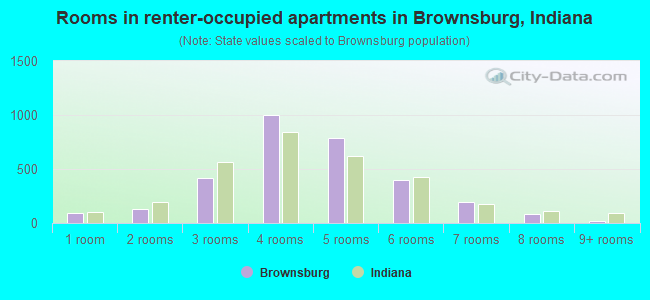
- Rooms in renter-occupied apartments in Brownsburg, Indiana
- 961 room
- 1282 rooms
- 4143 rooms
- 9974 rooms
- 7885 rooms
- 4026 rooms
- 1927 rooms
- 818 rooms
- 149+ rooms
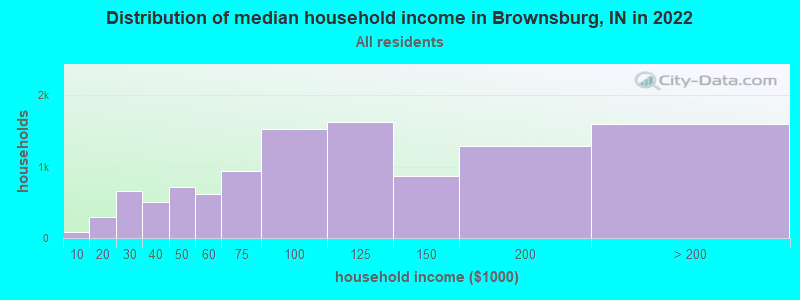
Brownsburg, IN household income distribution

- 89Less than $10,000
- 300$10,000 to $19,999
- 654$20,000 to $29,999
- 505$30,000 to $39,999
- 712$40,000 to $49,999
- 618$50,000 to $59,999
- 938$60,000 to $74,999
- 1,529$75,000 to $99,999
- 1,623$100,000 to $124,999
- 870$125,000 to $149,999
- 1,281$150,000 to $199,999
- 1,602$200,000 or more
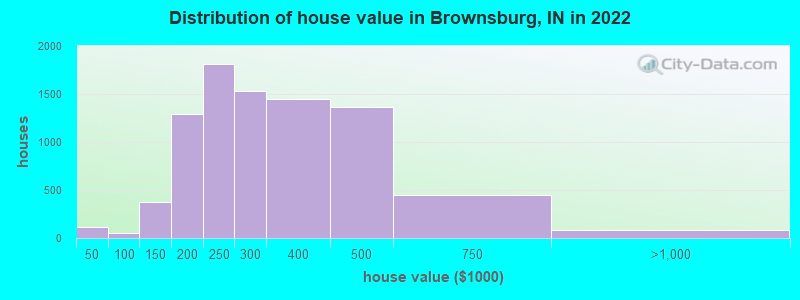
Home value of owner - occupied houses in 2022 in Brownsburg, IN
-
- 8Less than $10,000
- 13$10,000 to $14,999
- 19$15,000 to $19,999
- 18$20,000 to $24,999
- 24$25,000 to $29,999
- 3$35,000 to $39,999
- 21$40,000 to $49,999
- 30$90,000 to $99,999
- 161$100,000 to $124,999
- 213$125,000 to $149,999
- 781$150,000 to $174,999
- 508$175,000 to $199,999
- 1,814$200,000 to $249,999
- 1,528$250,000 to $299,999
- 1,443$300,000 to $399,999
- 1,368$400,000 to $499,999
- 450$500,000 to $749,999
- 79$750,000 to $999,999
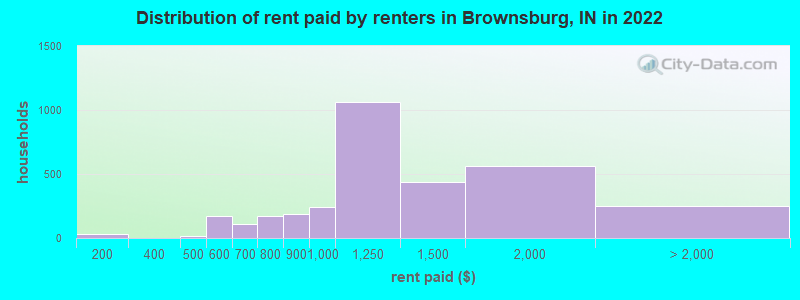
Rent paid by renters in 2022 in Brownsburg, IN
-
- 32$100 to $149
- 13$400 to $449
- 56$500 to $549
- 115$550 to $599
- 69$600 to $649
- 36$650 to $699
- 94$700 to $749
- 77$750 to $799
- 188$800 to $899
- 245$900 to $999
- 1,058$1,000 to $1,249
- 436$1,250 to $1,499
- 559$1,500 to $1,999
- 107$2,000 to $2,499
- 35$2,500 to $2,999
- 109No cash rent
Percentage of workers working in this county: 50.9%
Number of people working at home: 2,459 (15.5% of all workers)
Travel time to work (commute)
- Less than 5 minutes: 513
- 5 to 9 minutes: 1,732
- 10 to 14 minutes: 1,973
- 15 to 19 minutes: 1,490
- 20 to 24 minutes: 1,563
- 25 to 29 minutes: 1,248
- 30 to 34 minutes: 1,990
- 35 to 39 minutes: 746
- 40 to 44 minutes: 603
- 45 to 59 minutes: 1,123
- 60 to 89 minutes: 89
- 90 or more minutes: 165
Means of transportation to work:
- Drove a car alone: 9,583 (69.3%)
- Carpooled: 1,676 (12.1%)
- Taxi: 277 (2.0%)
- Walked: 113 (0.8%)
- Worked at home: 2,459 (17.8%)
- Unemployment by race in 2022
- Unemployment rate for White non-Hispanic residents
- 0.8%Males
- 0.4%Females
- Unemployment rate for Black residents
- 1.6%Males
- Unemployment rate for Asian residents
- 16.5%Females
- Unemployment rate for other race residents
- 5.2%Females
- Unemployment rate for two or more race residents
- 2.0%Males
- 9.2%Females
- Unemployment rate for Hispanic or Latino residents
- 6.0%Males
- 10.8%Females
- Year of entry for the foreign-born population in Brownsburg, Indiana
- 7802010 or later
- 6542000 to 2009
- 4081990 to 1999
- 611980 to 1989
- 71970 to 1979
- 42Before 1970
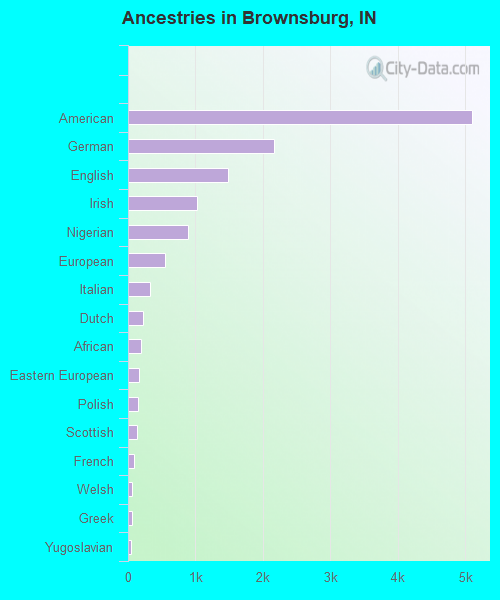
First ancestries reported:
- American: 5,100 (35.4%)
- German: 2,173 (15.1%)
- English: 1,485 (10.3%)
- Irish: 1,023 (7.1%)
- Nigerian: 897 (6.2%)
- European: 542 (3.8%)
- Italian: 321 (2.2%)
- Dutch: 218 (1.5%)
- African: 186 (1.3%)
- Eastern European: 162 (1.1%)
- Polish: 154 (1.1%)
- Scottish: 128 (0.9%)
- French: 84 (0.6%)
- Welsh: 64 (0.4%)
- Greek: 56 (0.4%)
- Yugoslavian: 49 (0.3%)
- Turkish: 42 (0.3%)
- Serbian: 41 (0.3%)
- Belgian: 36 (0.2%)
- British: 34 (0.2%)
- Iranian: 32 (0.2%)
- Norwegian: 32 (0.2%)
- Swiss: 29 (0.2%)
- Ukrainian: 28 (0.2%)
- Danish: 21 (0.1%)
- Russian: 19 (0.1%)
- Scotch-Irish: 17 (0.1%)
- Swedish: 15 (0.1%)
- Slovak: 9 (0.06%)
- Romanian: 8 (0.06%)
- Armenian: 7 (0.05%)
- Slovene: 7 (0.05%)
- Czech: 4 (0.03%)
Most common places of birth for foreign-born residents (%):
| Brownsburg: | 55.0% (1,054) |
| Indiana: | 3.3% (12,337) |
| Brownsburg: | 11.3% (217) |
| Indiana: | 27.0% (101,996) |
| Brownsburg: | 9.6% (183) |
| Indiana: | 0.6% (2,251) |
| Brownsburg: | 4.6% (89) |
| Indiana: | 3.1% (11,851) |
| Brownsburg: | 4.1% (78) |
| Indiana: | 8.5% (32,127) |
| Brownsburg: | 3.6% (69) |
| Indiana: | 2.1% (7,834) |
| Brownsburg: | 3.0% (58) |
| Indiana: | 1.8% (6,718) |
| Brownsburg: | 1.7% (33) |
| Indiana: | 0.4% (1,600) |
| Brownsburg: | 1.7% (32) |
| Indiana: | 0.2% (790) |
| Brownsburg: | 1.7% (32) |
| Indiana: | 0.2% (614) |
| Brownsburg: | 1.7% (32) |
| Indiana: | 0.7% (2,626) |
| Brownsburg: | 1.6% (31) |
| Indiana: | 5.3% (19,877) |
Place of birth for U.S.-born residents:
- This state: 18,885
- Other state: 8,991
- Northeast: 967
- Midwest: 4,243
- South: 3,032
- West: 728
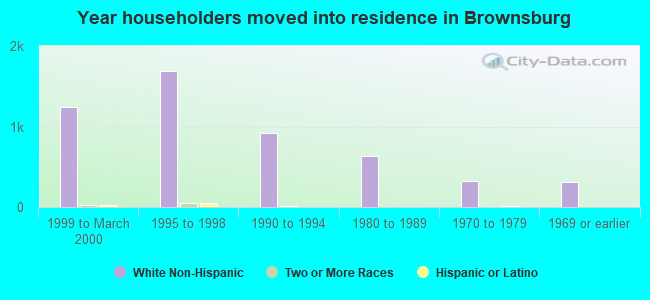
86.9% of Brownsburg residents lived in the same house 1 years ago.
Out of people who lived in different houses, 25.2% lived in this county.
Out of people who lived in different counties, 86.8% lived in Indiana.
| Brownsburg: | 86.9% |
| State average: | 87.1% |
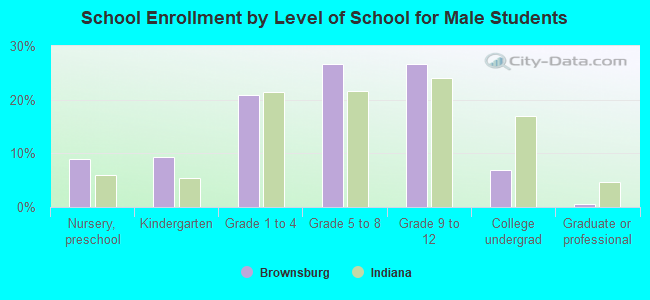
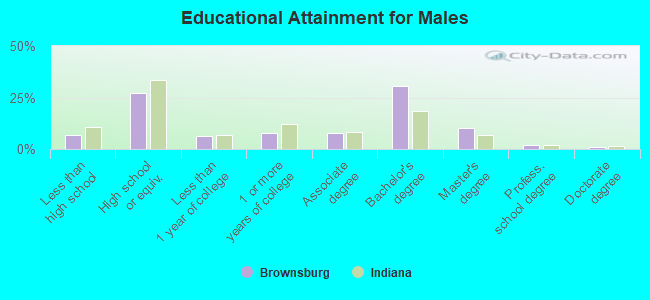
Education attainment for males 25 years and older:
- No schooling: 5
- Nursery to 4th grade: 0
- 5th and 6th grade: 47
- 7th and 8th grade: 129
- 9th grade: 67
- 10th grade: 17
- 11th grade: 260
- 12th grade, no diploma: 113
- High school graduate (or equivalency): 2,524
- Less than 1 year of college: 574
- Some college more than 1 year, no degree: 706
- Associate degree: 725
- Bachelor's degree: 2,856
- Master's degree: 952
- Professional school degree: 191
- Doctorate degree: 100
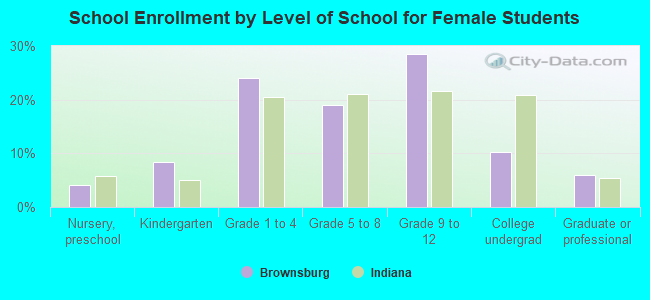
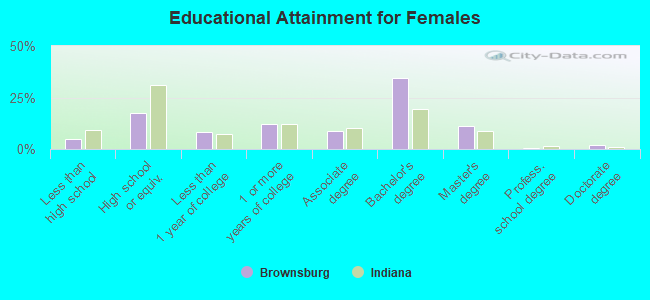
Education attainment for females 25 years and older:
- No schooling: 108
- Nursery to 4th grade: 6
- 5th and 6th grade: 0
- 7th and 8th grade: 17
- 9th grade: 17
- 10th grade: 23
- 11th grade: 98
- 12th grade, no diploma: 231
- High school graduate (or equivalency): 1,749
- Less than 1 year of college: 801
- Some college more than 1 year, no degree: 1,187
- Associate degree: 869
- Bachelor's degree: 3,405
- Master's degree: 1,129
- Professional school degree: 69
- Doctorate degree: 205
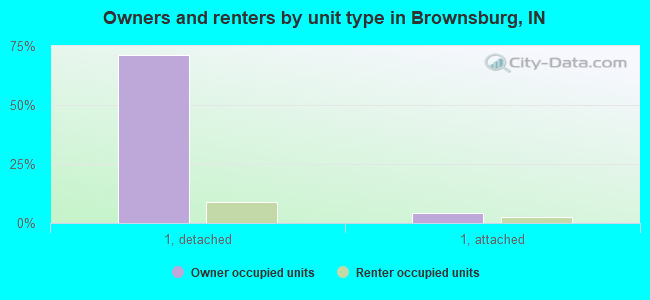
Housing units in structures:
- One, detached: 8,573
- One, attached: 692
- Two: 173
- 3 or 4: 139
- 5 to 9: 975
- 10 to 19: 197
- 20 to 49: 119
- 50 or more: 248
- Mobile homes: 214
Housing units lacking complete kitchen facilities in 2022: 2.8%
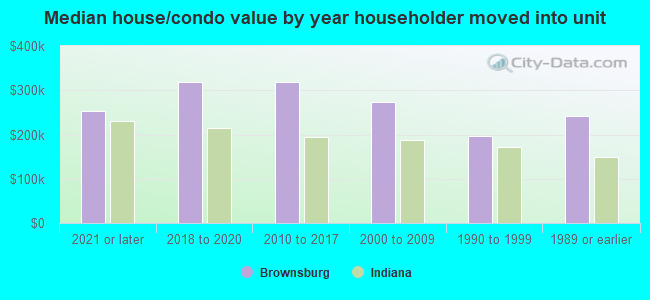
House/condo owner moved in on average 9 years ago
Renter moved in on average 4 years ago
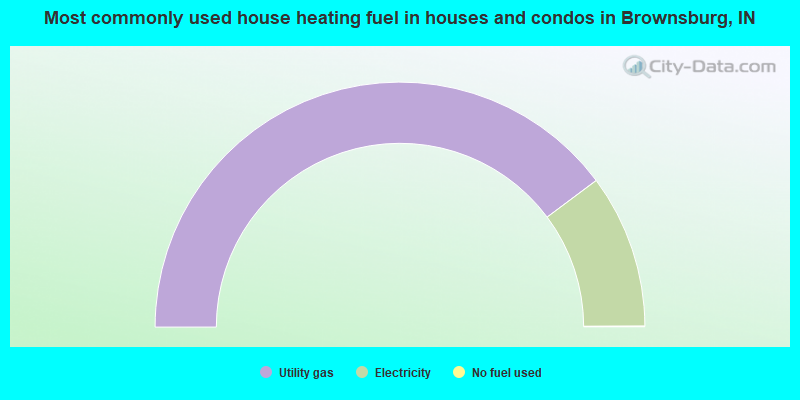
- 79.6%Utility gas
- 20.3%Electricity
- 0.1%No fuel used
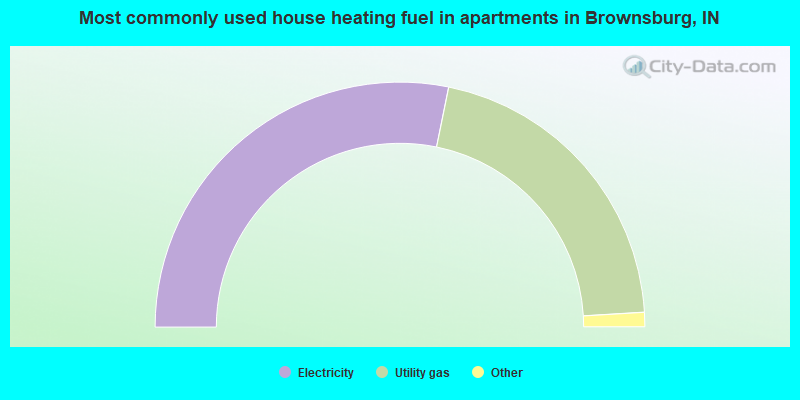
- 56.4%Electricity
- 41.7%Utility gas
- 1.4%Bottled, tank, or LP gas
- 0.5%Other fuel
Private vs. public school enrollment:
| Here: | 16.5% |
| Indiana: | 14.9% |
| Here: | 12.1% |
| Indiana: | 11.4% |
| Here: | 15.3% |
| Indiana: | 22.3% |