Brush Prairie, WA (Washington) Houses and Residents
| Brush Prairie: | $534,515 |
| Washington: | $569,500 |
Mean price in 2022:
Detached houses: $636,309
Here: $636,309 State: $734,307 Mobile homes: $181,293
Here: $181,293 State: $218,362
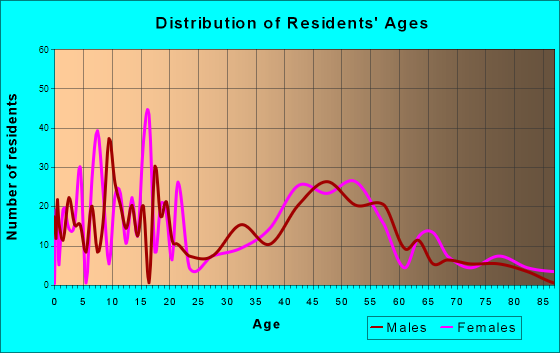
Total population: 2,652 (Urban population: 1,174, Rural population: 1,241 (26 farm, 1,215 nonfarm))
Houses: 1,094 (1,094 occupied: 881 owner occupied, 212 renter occupied)
| % of renters here: | 19% |
| State: | 36% |
Housing density: 140 houses/condos per square mile
Median price asked for vacant for-sale houses and condos in 2022 in this county: $858,483.
Median contract rent in 2022: $1,452 (lower quartile is $1,111, upper quartile is $1,970)
Median rent asked for vacant for-rent units in 2022: $1,999
Median gross rent in Brush Prairie, WA in 2022: $1,544
Housing units in Brush Prairie with a mortgage: 418 (29 second mortgage, 0 home equity loan, 20 both second mortgage and home equity loan)
Houses without a mortgage: 0
Median household income for houses/condos with a mortgage: $142,715
Median household income for apartments without a mortgage: $101,958
Median monthly housing costs: $1,172
Compare current foreclosures near Brush Prairie, WA:
| Photo | Address | Area | Beds / Baths | Price | Details |
|---|---|---|---|---|---|

|
#1
NE 202nd Ave
Brush Prairie, WA 98606
|
2,144 sq. feet
|
4 baths 3 beds |
show details | |

|
#2
NE 139th Loop
Brush Prairie, WA 98606
|
1,622 sq. feet
|
2 baths 3 beds |
show details | |

|
#3
NE 144th St
Brush Prairie, WA 98606
|
- sq. feet
|
- baths - beds |
show details | |

|
#4
SE 116th Ave
Portland, OR 97266
|
1,678 sq. feet
|
1 baths 4 beds |
$485,000
|
show details |

|
#5
North East Brazee St
Portland, OR 97220
|
1,578 sq. feet
|
2 baths 3 beds |
$350,000
|
show details |

|
#6
SW 1st Ave Apt 2125
Portland, OR 97201
|
1,950 sq. feet
|
2 baths 3 beds |
$715,000
|
show details |

|
#7
NE Irving St Apt 208
Portland, OR 97220
|
- sq. feet
|
1 baths 2 beds |
$135,900
|
show details |

|
#8
SE 44th Ave Unit 301
Portland, OR 97215
|
1,280 sq. feet
|
2 baths 2 beds |
show details | |

|
#9
N Rosa Parks Way # 201
Portland, OR 97217
|
561 sq. feet
|
1 baths 2 beds |
show details | |

|
#10
W 15th Ave
La Center, WA 98629
|
1,688 sq. feet
|
2 baths 3 beds |
show details |
| Photo | Address | Area | Beds / Baths | Price | Details |
|---|---|---|---|---|---|

|
#11
Rossiter Ln
Vancouver, WA 98661
|
1,519 sq. feet
|
3 baths 2 beds |
show details | |

|
#12
NE 113th Ave
Portland, OR 97220
|
1,118 sq. feet
|
2 baths 3 beds |
show details | |

|
#13
NE 43rd St
Vancouver, WA 98661
|
1,726 sq. feet
|
2 baths 3 beds |
show details | |

|
#14
SE 214th Ave
Gresham, OR 97030
|
1,294 sq. feet
|
2 baths 3 beds |
show details | |

|
#15
SE Stephens St
Portland, OR 97233
|
2,200 sq. feet
|
1 baths 3 beds |
show details | |

|
#16
N Seward Ave
Portland, OR 97217
|
2,104 sq. feet
|
2 baths 3 beds |
show details | |

|
#17
NE 49th St
Vancouver, WA 98661
|
1,928 sq. feet
|
2 baths 3 beds |
show details | |

|
#18
SE 103rd Ave
Portland, OR 97266
|
1,700 sq. feet
|
2 baths 4 beds |
show details | |

|
#19
SE Yamhill St
Portland, OR 97233
|
- sq. feet
|
2 baths 2 beds |
show details | |

|
#20
NE 32nd St
Vancouver, WA 98682
|
1,094 sq. feet
|
2 baths 3 beds |
show details |
| Photo | Address | Area | Beds / Baths | Price | Details |
|---|---|---|---|---|---|

|
#21
NW 8th St
Battle Ground, WA 98604
|
2,466 sq. feet
|
3 baths 4 beds |
show details | |

|
#22
Ne133rd Ave
Vancouver, WA 98682
|
- sq. feet
|
2 baths 3 beds |
show details | |

|
#23
Cimerron St
Woodland, WA 98674
|
- sq. feet
|
2 baths 3 beds |
show details | |

|
#24
NE Yacolt Mountain Rd
Yacolt, WA 98675
|
1,620 sq. feet
|
2 baths 2 beds |
show details | |

|
#25
Ne82nd Street
Vancouver, WA 98662
|
- sq. feet
|
1 baths 3 beds |
show details | |

|
#26
SE Bush St
Portland, OR 97236
|
2,212 sq. feet
|
1 baths 3 beds |
show details | |

|
#27
N Curtis Ave
Portland, OR 97217
|
1,643 sq. feet
|
2 baths 3 beds |
show details | |

|
#28
SE Lewellyn Ave
Troutdale, OR 97060
|
1,910 sq. feet
|
2 baths 3 beds |
show details | |

|
#29
N 10th St
Saint Helens, OR 97051
|
1,223 sq. feet
|
2 baths 3 beds |
show details | |

|
#30
NE Gabriel Rd
Yacolt, WA 98675
|
1,880 sq. feet
|
2 baths 3 beds |
show details |
| Photo | Address | Area | Beds / Baths | Price | Details |
|---|---|---|---|---|---|

|
#31
SE Franklin St
Portland, OR 97236
|
1,618 sq. feet
|
2 baths 3 beds |
show details | |

|
#32
SE Lee Ln
Portland, OR 97233
|
1,288 sq. feet
|
1 baths 3 beds |
show details | |

|
#33
NE 96th Ave
Vancouver, WA 98662
|
1,270 sq. feet
|
2 baths 3 beds |
show details | |

|
#34
NE 27th Ave
Portland, OR 97211
|
1,190 sq. feet
|
1 baths 4 beds |
show details | |

|
#35
NE 18th St
Gresham, OR 97030
|
943 sq. feet
|
1 baths 3 beds |
show details | |

|
#36
Ave
Washougal, WA 98671
|
2,808 sq. feet
|
3 baths 4 beds |
show details | |

|
#37
NW 10th St
Battle Ground, WA 98604
|
1,410 sq. feet
|
2 baths 3 beds |
show details | |

|
#38
NE 69th St
Vancouver, WA 98662
|
960 sq. feet
|
1 baths 3 beds |
show details | |

|
#39
Norris Rd
Vancouver, WA 98661
|
1,116 sq. feet
|
1 baths 3 beds |
show details | |

|
#40
SE Sunset View Rd
Washougal, WA 98671
|
1,448 sq. feet
|
1 baths 4 beds |
show details |
| Photo | Address | Area | Beds / Baths | Price | Details |
|---|---|---|---|---|---|

|
#41
SE Harrison St
Portland, OR 97233
|
1,782 sq. feet
|
1 baths 2 beds |
show details | |

|
#42
NE 162nd Ave
Portland, OR 97230
|
1,073 sq. feet
|
2 baths 3 beds |
show details | |

|
#43
Fisher Ln
Saint Helens, OR 97051
|
2,350 sq. feet
|
3 baths 4 beds |
show details | |

|
#44
NE 77th Ave
Vancouver, WA 98664
|
1,094 sq. feet
|
2 baths 2 beds |
show details | |

|
#45
SE 130th Ave
Portland, OR 97233
|
1,148 sq. feet
|
2 baths 3 beds |
show details | |

|
#46
NE Klickitat St
Portland, OR 97230
|
1,693 sq. feet
|
1 baths 3 beds |
show details | |

|
#47
E 24th St
Vancouver, WA 98661
|
720 sq. feet
|
1 baths 2 beds |
show details | |

|
#48
NE 94th Ave
Portland, OR 97220
|
1,506 sq. feet
|
2 baths 3 beds |
show details | |

|
#49
Insel Rd
Woodland, WA 98674
|
1,056 sq. feet
|
2 baths 3 beds |
show details | |

|
Check over 1 million property listings on Foreclosure.com!
|
browse all offers | |||


 | Retiring and buying $450k house possible? (37 replies) |
| Is the Vancouver/Camas housing market finally starting to cool a bit? (16 replies) |
| The Waterfront, Downtown, Midtown, Uptown thread (40 replies) |
| This is a very sensitive subject, but ... (76 replies) |
| Potential Move To Camas from SF Bay Area (134 replies) |
| Property Situation in Camas & Washougal (11 replies) |
Median year apartment built: 1965
Household type by relationship:
Households: 2,689- Male householders: 470 (178 living alone), Female householders: 596 (120 living alone)
525 spouses (491 opposite-sex spouses), 85 unmarried partners, (85 opposite-sex unmarried partners), 685 children (669 natural, 16 adopted, 0 stepchildren), 73 grandchildren, 32 brothers or sisters, 18 parents, 13 foster children, 96 other relatives, 72 non-relatives
- In group quarters: 17
Size of family households: 389 2-persons, 87 3-persons, 102 4-persons, 60 5-persons, 27 6-persons, 33 7-or-more-persons.
Size of nonfamily households: 327 1-person, 73 2-persons.
315 married couples with children.
24 single-parent households (8 men, 16 women).
93.0% of residents of Brush Prairie speak English at home.
3.0% of residents speak Spanish at home (77% speak English very well, 23% speak English well).
3.4% of residents speak other Indo-European language at home (66% speak English very well, 15% speak English well, 20% speak English not well).
0.8% of residents speak Asian or Pacific Island language at home (45% speak English very well, 15% speak English well, 40% speak English not well).
Foreign born population: 118 (4.4%)
(71.2% of them are naturalized citizens)
| Here: | 8.0 |
| State: | 6.5 |
| Here: | 5.1 |
| State: | 3.9 |

- Bedrooms in owner-occupied houses and condos in Brush Prairie, Washington
- 0no bedroom
- 01 bedroom
- 1212 bedrooms
- 5443 bedrooms
- 1384 bedrooms
- 795+ bedrooms

- Bedrooms in renter-occupied apartments in Brush Prairie, Washington
- 12no bedroom
- 01 bedroom
- 402 bedrooms
- 1303 bedrooms
- 304 bedrooms
- 05+ bedrooms

- Cars and other vehicles available in Brush Prairie in owner-occupied houses/condos
- 11no vehicle
- 1581 vehicle
- 1532 vehicles
- 3953 vehicles
- 1024 vehicles
- 635+ vehicles

- Cars and other vehicles available in Brush Prairie in renter-occupied apartments
- 0no vehicle
- 551 vehicle
- 1202 vehicles
- 263 vehicles
- 04 vehicles
- 125+ vehicles

- Rooms in owner-occupied houses in Brush Prairie, Washington
- 01 room
- 02 rooms
- 293 rooms
- 234 rooms
- 925 rooms
- 2136 rooms
- 367 rooms
- 798 rooms
- 4099+ rooms

- Rooms in renter-occupied apartments in Brush Prairie, Washington
- 121 room
- 02 rooms
- 123 rooms
- 284 rooms
- 655 rooms
- 06 rooms
- 357 rooms
- 138 rooms
- 489+ rooms


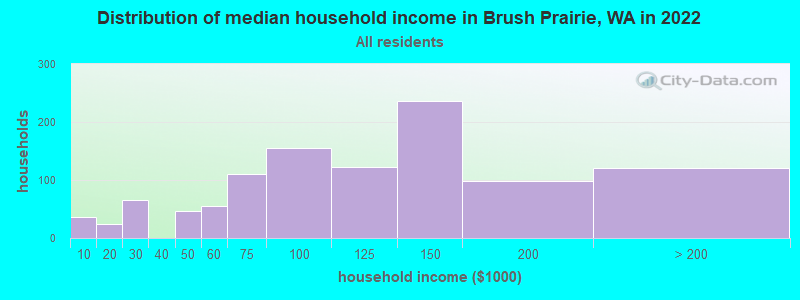
Brush Prairie, WA household income distribution

- 37Less than $10,000
- 25$10,000 to $19,999
- 66$20,000 to $29,999
- 46$40,000 to $49,999
- 56$50,000 to $59,999
- 110$60,000 to $74,999
- 155$75,000 to $99,999
- 123$100,000 to $124,999
- 237$125,000 to $149,999
- 99$150,000 to $199,999
- 120$200,000 or more
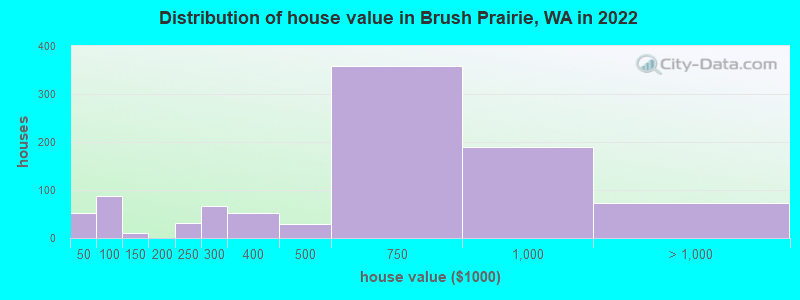
Home value of owner - occupied houses in 2022 in Brush Prairie, WA
-
- 33$20,000 to $24,999
- 18$40,000 to $49,999
- 68$60,000 to $69,999
- 10$100,000 to $124,999
- 30$200,000 to $249,999
- 67$250,000 to $299,999
- 52$300,000 to $399,999
- 30$400,000 to $499,999
- 357$500,000 to $749,999
- 189$750,000 to $999,999
- 72$1,000,000 to $1,499,999
Rent paid by renters in 2022 in Brush Prairie, WA
-
- 20$900 to $999
- 47$1,000 to $1,249
- 4$1,250 to $1,499
- 51$1,500 to $1,999
- 12$2,000 to $2,499
- 32$3,500 or more
- 30No cash rent


Percentage of workers working in this county: 93.5%
Number of people working at home: 458 (34.4% of all workers)
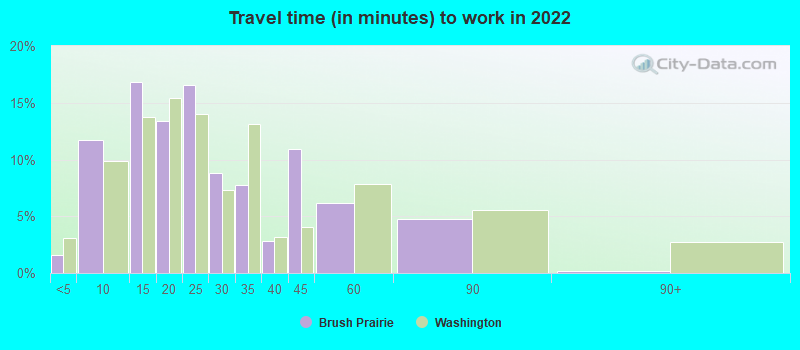
Travel time to work (commute)
- Less than 5 minutes: 0
- 5 to 9 minutes: 118
- 10 to 14 minutes: 75
- 15 to 19 minutes: 153
- 20 to 24 minutes: 236
- 25 to 29 minutes: 136
- 30 to 34 minutes: 111
- 35 to 39 minutes: 34
- 40 to 44 minutes: 22
- 45 to 59 minutes: 0
- 60 to 89 minutes: 29
- 90 or more minutes: 20
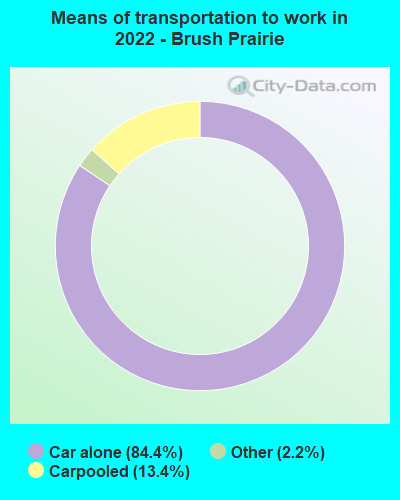
Means of transportation to work:
- Drove a car alone: 992 (61.7%)
- Carpooled: 165 (10.3%)
- Taxi: 15 (0.9%)
- Worked at home: 458 (28.5%)

- Unemployment by race in 2022
- Unemployment rate for White non-Hispanic residents
- 3.0%Males
- 3.0%Females

- Year of entry for the foreign-born population in Brush Prairie, Washington
- 122010 or later
- 272000 to 2009
- 681990 to 1999
- 131980 to 1989
- 131970 to 1979
- 33Before 1970

First ancestries reported:
- German: 150 (17.6%)
- English: 127 (14.9%)
- Norwegian: 123 (14.5%)
- American: 111 (13.0%)
- Ukrainian: 79 (9.3%)
- European: 42 (4.9%)
- Irish: 30 (3.5%)
- British: 27 (3.2%)
- French: 24 (2.8%)
- Dutch: 15 (1.8%)
- Swedish: 15 (1.8%)
- Scottish: 14 (1.6%)
- Finnish: 9 (1.1%)
Most common places of birth for foreign-born residents (%):
| Brush Prairie: | 31.5% (40) |
| Washington: | 3.1% (35,872) |
| Brush Prairie: | 22.8% (29) |
| Washington: | 21.1% (241,655) |
| Brush Prairie: | 13.4% (17) |
| Washington: | 0.2% (1,831) |
| Brush Prairie: | 11.8% (15) |
| Washington: | 5.4% (62,003) |
| Brush Prairie: | 8.7% (11) |
| Washington: | 1.2% (13,745) |
| Brush Prairie: | 8.7% (11) |
| Washington: | 0.2% (2,284) |
Place of birth for U.S.-born residents:
- This state: 1,204
- Other state: 1,330
- Northeast: 210
- Midwest: 148
- South: 57
- West: 915
97.1% of Brush Prairie residents lived in the same house 1 years ago.
Out of people who lived in different houses, 29.1% lived in this county.
Out of people who lived in different counties, 19.1% lived in Washington.
| Brush Prairie: | 97.1% |
| State average: | 85.2% |
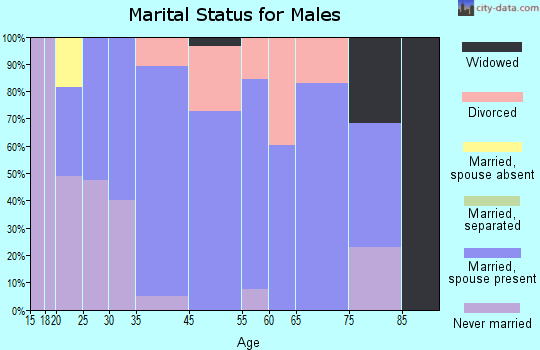
Education attainment for males 25 years and older:
- No schooling: 6
- Nursery to 4th grade: 0
- 5th and 6th grade: 0
- 7th and 8th grade: 0
- 9th grade: 0
- 10th grade: 0
- 11th grade: 7
- 12th grade, no diploma: 8
- High school graduate (or equivalency): 253
- Less than 1 year of college: 67
- Some college more than 1 year, no degree: 231
- Associate degree: 73
- Bachelor's degree: 302
- Master's degree: 74
- Professional school degree: 0
- Doctorate degree: 0

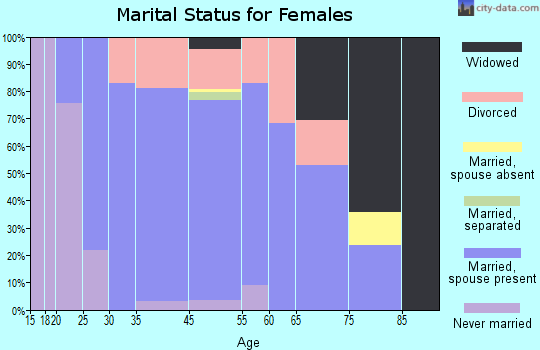
Education attainment for females 25 years and older:
- No schooling: 10
- Nursery to 4th grade: 0
- 5th and 6th grade: 0
- 7th and 8th grade: 0
- 9th grade: 0
- 10th grade: 0
- 11th grade: 0
- 12th grade, no diploma: 64
- High school graduate (or equivalency): 305
- Less than 1 year of college: 101
- Some college more than 1 year, no degree: 190
- Associate degree: 116
- Bachelor's degree: 120
- Master's degree: 76
- Professional school degree: 23
- Doctorate degree: 3

Housing units in structures:
- One, detached: 902
- 10 to 19: 28
- Mobile homes: 162
House/condo owner moved in on average 13 years ago
Renter moved in on average 5 years ago

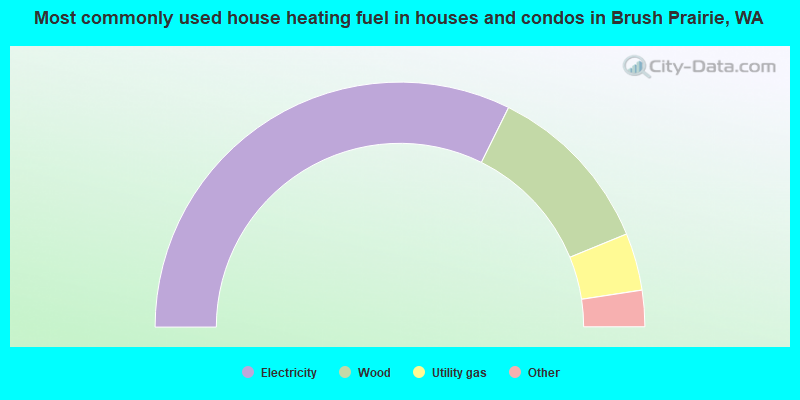
- 64.7%Electricity
- 23.0%Wood
- 7.6%Utility gas
- 3.5%Bottled, tank, or LP gas
- 1.2%No fuel used
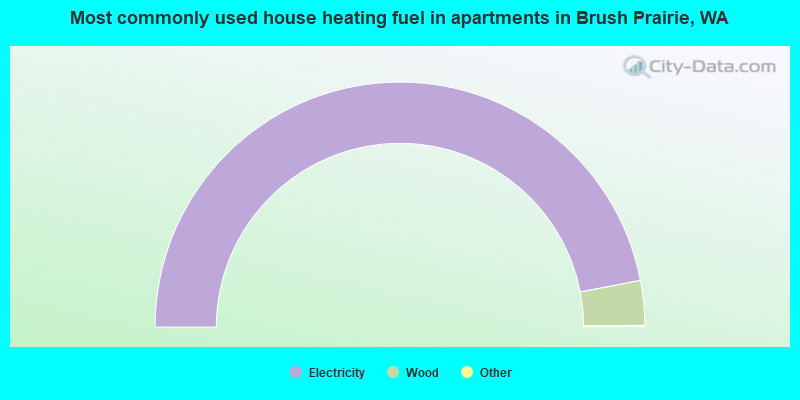
- 94.1%Electricity
- 5.9%Wood
Private vs. public school enrollment:
| Here: | 18.0% |
| Washington: | 12.4% |
| Here: | 16.4% |
| Washington: | 9.2% |
| Here: | 22.6% |
| Washington: | 16.5% |


