Bryn Mawr-Skyway, WA (Washington) Houses and Residents
Estimated median house or condo value in 2022: $668,134 (it was $177,400 in 2000 )
Bryn Mawr-Skyway:
$668,134Washington:
$569,500
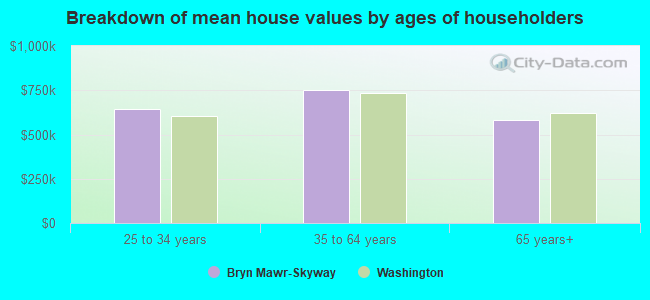
Lower value quartile - upper value quartile: $482,400 - $844,698Mean price in 2022: Detached houses: $721,257 Here:
$721,257State:
$734,307
Townhouses or other attached units: $254,355 Here:
$254,355State:
$657,697
In 2-unit structures: $464,135 Here:
$464,135State:
$534,634
In 5-or-more-unit structures: $382,519 Here:
$382,519State:
$503,183
Mobile homes: $455,865 Here:
$455,865State:
$218,362
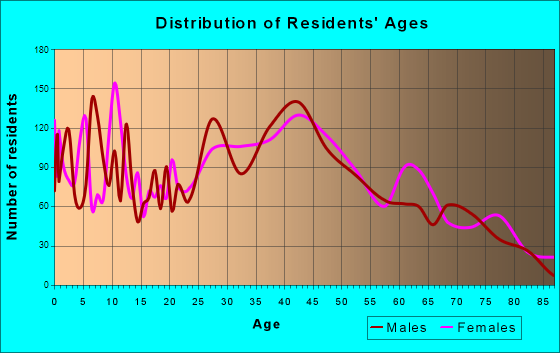
Total population: 15,645 (Urban population: 14,050, Rural population: 0)
Houses: 7,011 (6,848 occupied: 4,127 owner occupied, 2,711 renter occupied )
% of renters here:
40%State:
36%
Housing density: 2,211 houses/condos per square mile
Median price asked for vacant for-sale houses and condos in 2022 in this county: $843,880.
Median contract rent in 2022: $1,510 (lower quartile is $1,107, upper quartile is $1,911)
Median rent asked for vacant for-rent units in 2022: $2,609
Median gross rent in Bryn Mawr-Skyway, WA in 2022: $1,608
Housing units in Bryn Mawr-Skyway with a mortgage: 3,022 (568 second mortgage, 94 home equity loan, 468 both second mortgage and home equity loan )Houses without a mortgage: 0
Median household income for houses/condos with a mortgage: $130,574
Median household income for apartments without a mortgage: $95,415
Median monthly housing costs: $1,947
Data:
Median house or condo value ($)
Median house or condo value ($ change since 2000)
Median house or condo value ($) - White
Median house or condo value ($) - Black or African American
Median house or condo value ($) - Asian
Median house or condo value ($) - Hispanic or Latino
Median house or condo value ($) - American Indian and Alaska Native
Median house or condo value ($) - Multirace
Median house or condo value ($) - Other Race
Median price asked for mobile homes ($)
Household density (households per square mile)
Mean house or condo value by units in structure - 1, detached ($)
Mean house or condo value by units in structure - 1, attached ($)
Mean house or condo value by units in structure - 2 ($)
Mean house or condo value by units in structure by units in structure - 3 or 4 ($)
Mean house or condo value by units in structure - 5 or more ($)
Mean house or condo value by units in structure - Boat, RV, van, etc. ($)
Mean house or condo value by units in structure - Mobile home ($)
Median contract rent ($)
Median contract rent - Lower quartile ($)
Median contract rent - Upper quartile ($)
Median gross rent ($)
Urban houses (%)
Rural houses (%)
Houses occupied (%)
Houses occupied (% change since 2000)
Houses owner occupied (%)
Houses owner occupied (% change since 2000)
Houses renter occupied (%)
Houses renter occupied (% change since 2000)
Vacant housing units - For rent (%)
Vacant housing units - For rent (% change since 2000)
Vacant housing units - For sale only (%)
Vacant housing units - For sale only (% change since 2000)
Vacant housing units - Rented or sold, not occupied (%)
Vacant housing units - Rented or sold, not occupied (% change since 2000)
Vacant housing units - For seasonal, recreational, or occasional use (%)
Vacant housing units - For seasonal, recreational, or occasional use (% change since 2000)
Vacant housing units - For migrant workers (%)
Vacant housing units - For migrant workers (% change since 2000)
Vacant housing units - Other vacant (%)
Vacant housing units - Other vacant (% change since 2000)
Median monthly housing costs ($)
Median household income for houses/condos with a mortgage ($)
Median household income for houses/condos without a mortgage ($)
Median household income ($)
Median household income ($) - White
Median household income ($) - Black or African American
Median household income ($) - Asian
Median household income ($) - Hispanic or Latino
Median household income ($) - American Indian and Alaska Native
Median household income ($) - Multirace
Median household income ($) - Other Race
Mortgage status - with mortgage (%)
Mortgage status - with second mortgage (%)
Mortgage status - with home equity loan (%)
Mortgage status - with both second mortgage and home equity loan (%)
Mortgage status - without a mortgage (%)
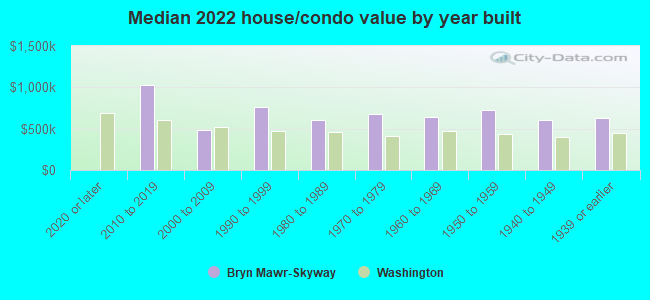
Median year house/condo built
Median year apartment built
Household type by relationship - Male householder living alone (%)
Household type by relationship - Male householder not living alone (%)
Household type by relationship - Female householder living alone (%)
Household type by relationship - Female householder not living alone (%)
Household type by relationship - Opposite-Sex spouse (%)
Household type by relationship - Same-Sex spouse (%)
Household type by relationship - Opposite-Sex unmarried partner (%)
Household type by relationship - Same-Sex unmarried partner (%)
Household type by relationship - In group quarters (%)
Size of family households - 2-person household (%)
Size of family households - 3-person household (%)
Size of family households - 4-person household (%)
Size of family households - 5-person household (%)
Size of family households - 6-person household (%)
Size of family households - 7-or-more-person household (%)
Size of nonfamily households - 1-person household (%)
Size of nonfamily households - 2-person household (%)
Size of nonfamily households - 3-person household (%)
Size of nonfamily households - 4-person household (%)
Size of nonfamily households - 5-person household (%)
Size of nonfamily households - 6-person household (%)
Size of nonfamily households - 7-or-moreperson household (%)
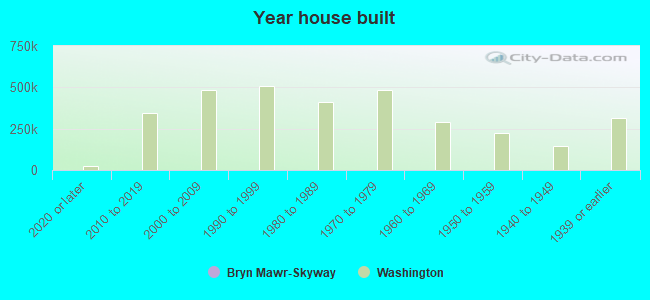
Year house built - Built 2010 or later (%)
Year house built - Built 2000 to 2009 (%)
Year house built - Built 1990 to 1999 (%)
Year house built - Built 1980 to 1989 (%)
Year house built - Built 1970 to 1979 (%)
Year house built - Built 1960 to 1969 (%)
Year house built - Built 1950 to 1959 (%)
Year house built - Built 1940 to 1949 (%)
Year house built - Built 1939 or earlier (%)
Median number of rooms in houses and condos
Median number of rooms in apartments
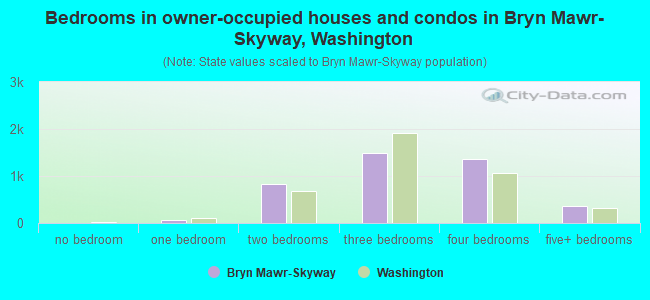
Median number of bedrooms in owner occupied houses
Mean number of bedrooms in owner occupied houses
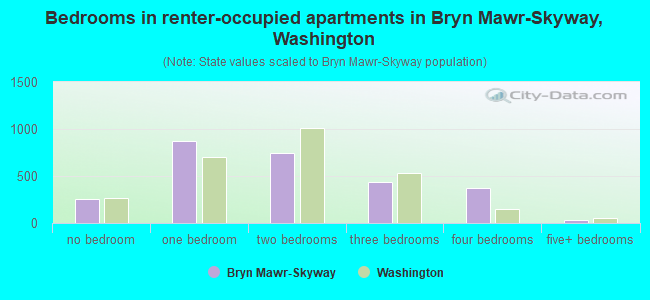
Median number of bedrooms in renter occupied houses
Mean number of bedrooms in renter occupied houses
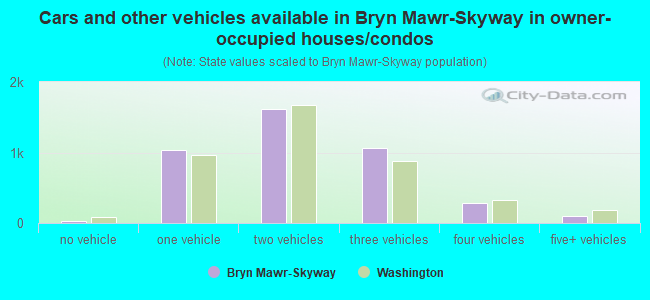
Median number of vehichles in owner occupied houses
Mean number of vehichles in owner occupied houses
Median number of vehichles in renter occupied houses
Mean number of vehichles in renter occupied houses
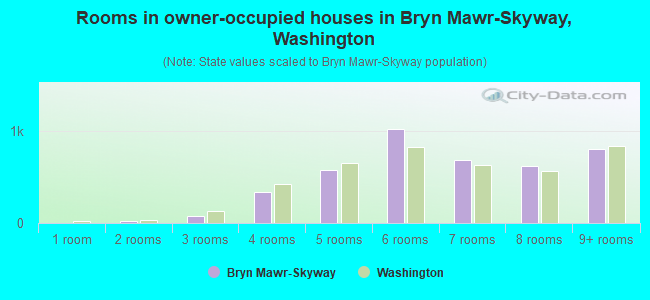
Rooms in owner-occupied houses - 1 room (%)
Rooms in owner-occupied houses - 2 rooms (%)
Rooms in owner-occupied houses - 3 rooms (%)
Rooms in owner-occupied houses - 4 rooms (%)
Rooms in owner-occupied houses - 5 rooms (%)
Rooms in owner-occupied houses - 6 rooms (%)
Rooms in owner-occupied houses - 7 rooms (%)
Rooms in owner-occupied houses - 8 rooms (%)
Rooms in owner-occupied houses - 9+ rooms (%)
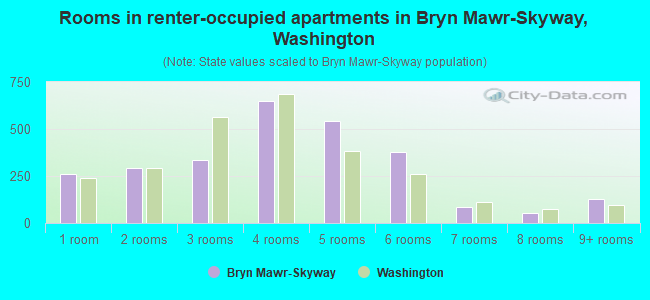
Rooms in renter-occupied houses - 1 room (%)
Rooms in renter-occupied houses - 2 rooms (%)
Rooms in renter-occupied houses - 3 rooms (%)
Rooms in renter-occupied houses - 4 rooms (%)
Rooms in renter-occupied houses - 5 rooms (%)
Rooms in renter-occupied houses - 6 rooms (%)
Rooms in renter-occupied houses - 7 rooms (%)
Rooms in renter-occupied houses - 8 rooms (%)
Rooms in renter-occupied houses - 9+ rooms (%)
Bedrooms in owner-occupied houses - no bedrooms (%)
Bedrooms in owner-occupied houses - 1 bedroom (%)
Bedrooms in owner-occupied houses - 2 bedrooms (%)
Bedrooms in owner-occupied houses - 3 bedrooms (%)
Bedrooms in owner-occupied houses - 4 bedrooms (%)
Bedrooms in owner-occupied houses - 5+ bedrooms (%)
Bedrooms in renter-occupied houses - no bedrooms (%)
Bedrooms in renter-occupied houses - 1 bedroom (%)
Bedrooms in renter-occupied houses - 2 bedrooms (%)
Bedrooms in renter-occupied houses - 3 bedrooms (%)
Bedrooms in renter-occupied houses - 4 bedrooms (%)
Bedrooms in renter-occupied houses - 5+ bedrooms (%)
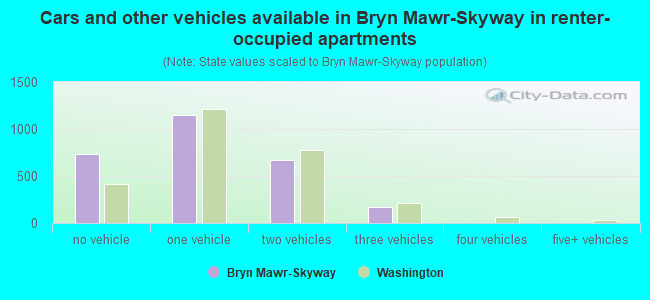
Vehicles available in owner-occupied houses - no vehicle available (%)
Vehicles available in owner-occupied houses - 1 vehicle available(%)
Vehicles available in owner-occupied houses - 2 Vehicles available (%)
Vehicles available in owner-occupied houses - 3 Vehicles available (%)
Vehicles available in owner-occupied houses - 4 Vehicles available (%)
Vehicles available in owner-occupied houses - 5+ Vehicles available (%)
Vehicles available in renter-occupied houses - no vehicle available (%)
Vehicles available in renter-occupied houses - 1 vehicle available (%)
Vehicles available in renter-occupied houses - 2 Vehicles available (%)
Vehicles available in renter-occupied houses - 3 Vehicles available (%)
Vehicles available in renter-occupied houses - 4 Vehicles available (%)
Vehicles available in renter-occupied houses - 5+ Vehicles available (%)
Housing units in structures - 1, detached (%)
Housing units in structures - 1, attached (%)
Housing units in structures - 2 (%)
Housing units in structures - 3 or 4 (%)
Housing units in structures - 5 to 9 (%)
Housing units in structures - 10 to 19 (%)
Housing units in structures - 20 to 49 (%)
Housing units in structures - 50 or more (%)
Housing units in structures - Mobile home (%)
Housing units in structures - Boat, RV, van, etc. (%)
Housing units in structures - Owners - 1, detached (%)
Housing units in structures - Owners - 1, attached (%)
Housing units in structures - Owners - 2 (%)
Housing units in structures - Owners - 3 or 4 (%)
Housing units in structures - Owners - 5 to 9 (%)
Housing units in structures - Owners - 10 to 19 (%)
Housing units in structures - Owners - 20 to 49 (%)
Housing units in structures - Owners - 50 or more (%)
Housing units in structures - Owners - Mobile home (%)
Housing units in structures - Owners - Boat, RV, van, etc. (%)
Housing units in structures - Renters - 1, detached (%)
Housing units in structures - Renters - 1, attached (%)
Housing units in structures - Renters - 2 (%)
Housing units in structures - Renters - 3 or 4 (%)
Housing units in structures - Renters - 5 to 9 (%)
Housing units in structures - Renters - 10 to 19 (%)
Housing units in structures - Renters - 20 to 49 (%)
Housing units in structures - Renters - 50 or more (%)
Housing units in structures - Renters - Mobile home (%)
Housing units in structures - Renters - Boat, RV, van, etc. (%)
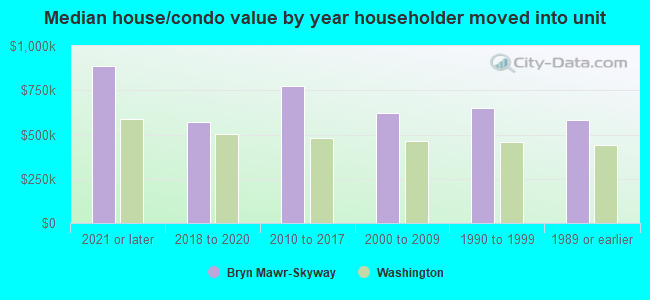
House/condo owner moved in on average (years ago)
Renter moved in on average (years ago)
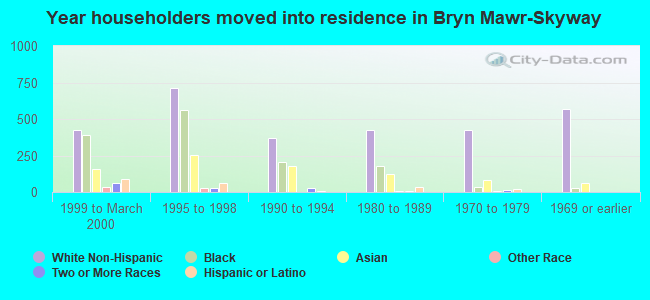
Year householder moved into unit - Moved in 1999 to March 2000 (%)
Year householder moved into unit - Moved in 1999 to March 2000 (%) - White
Year householder moved into unit - Moved in 1999 to March 2000 (%) - Black or African American
Year householder moved into unit - Moved in 1999 to March 2000 (%) - Asian
Year householder moved into unit - Moved in 1999 to March 2000 (%) - Hispanic or Latino
Year householder moved into unit - Moved in 1999 to March 2000 (%) - American Indian and Alaska Native
Year householder moved into unit - Moved in 1999 to March 2000 (%) - Multirace
Year householder moved into unit - Moved in 1999 to March 2000 (%) - Other Race
Year householder moved into unit - Moved in 1995 to 1998 (%)
Year householder moved into unit - Moved in 1995 to 1998 (%) - White
Year householder moved into unit - Moved in 1995 to 1998 (%) - Black or African American
Year householder moved into unit - Moved in 1995 to 1998 (%) - Asian
Year householder moved into unit - Moved in 1995 to 1998 (%) - Hispanic or Latino
Year householder moved into unit - Moved in 1995 to 1998 (%) - American Indian and Alaska Native
Year householder moved into unit - Moved in 1995 to 1998 (%) - Multirace
Year householder moved into unit - Moved in 1995 to 1998 (%) - Other Race
Year householder moved into unit - Moved in 1990 to 1994 (%)
Year householder moved into unit - Moved in 1990 to 1994 (%) - White
Year householder moved into unit - Moved in 1990 to 1994 (%) - Black or African American
Year householder moved into unit - Moved in 1990 to 1994 (%) - Asian
Year householder moved into unit - Moved in 1990 to 1994 (%) - Hispanic or Latino
Year householder moved into unit - Moved in 1990 to 1994 (%) - American Indian and Alaska Native
Year householder moved into unit - Moved in 1990 to 1994 (%) - Multirace
Year householder moved into unit - Moved in 1990 to 1994 (%) - Other Race
Year householder moved into unit - Moved in 1980 to 1989 (%)
Year householder moved into unit - Moved in 1980 to 1989 (%) - White
Year householder moved into unit - Moved in 1980 to 1989 (%) - Black or African American
Year householder moved into unit - Moved in 1980 to 1989 (%) - Asian
Year householder moved into unit - Moved in 1980 to 1989 (%) - Hispanic or Latino
Year householder moved into unit - Moved in 1980 to 1989 (%) - American Indian and Alaska Native
Year householder moved into unit - Moved in 1980 to 1989 (%) - Multirace
Year householder moved into unit - Moved in 1980 to 1989 (%) - Other Race
Year householder moved into unit - Moved in 1970 to 1979 (%)
Year householder moved into unit - Moved in 1970 to 1979 (%) - White
Year householder moved into unit - Moved in 1970 to 1979 (%) - Black or African American
Year householder moved into unit - Moved in 1970 to 1979 (%) - Asian
Year householder moved into unit - Moved in 1970 to 1979 (%) - Hispanic or Latino
Year householder moved into unit - Moved in 1970 to 1979 (%) - American Indian and Alaska Native
Year householder moved into unit - Moved in 1970 to 1979 (%) - Multirace
Year householder moved into unit - Moved in 1970 to 1979 (%) - Other Race
Year householder moved into unit - Moved in 1969 or earlier (%)
Year householder moved into unit - Moved in 1969 or earlier (%) - White
Year householder moved into unit - Moved in 1969 or earlier (%) - Black or African American
Year householder moved into unit - Moved in 1969 or earlier (%) - Asian
Year householder moved into unit - Moved in 1969 or earlier (%) - Hispanic or Latino
Year householder moved into unit - Moved in 1969 or earlier (%) - American Indian and Alaska Native
Year householder moved into unit - Moved in 1969 or earlier (%) - Multirace
Year householder moved into unit - Moved in 1969 or earlier (%) - Other Race
Housing units lacking complete plumbing facilities (%)
Housing units lacking complete kitchen facilities (%)
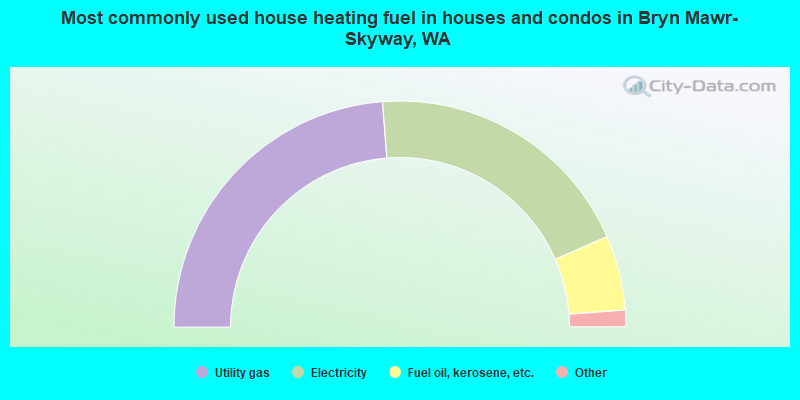
House heating fuel used in houses and condos - Utility gas (%)
House heating fuel used in houses and condos - Bottled, tank, or LP gas (%)
House heating fuel used in houses and condos - Electricity (%)
House heating fuel used in houses and condos - Fuel oil, kerosene, etc. (%)
House heating fuel used in houses and condos - Coal or coke (%)
House heating fuel used in houses and condos - Wood (%)
House heating fuel used in houses and condos - Solar energy (%)
House heating fuel used in houses and condos - Other fuel (%)
House heating fuel used in houses and condos - No fuel used (%)
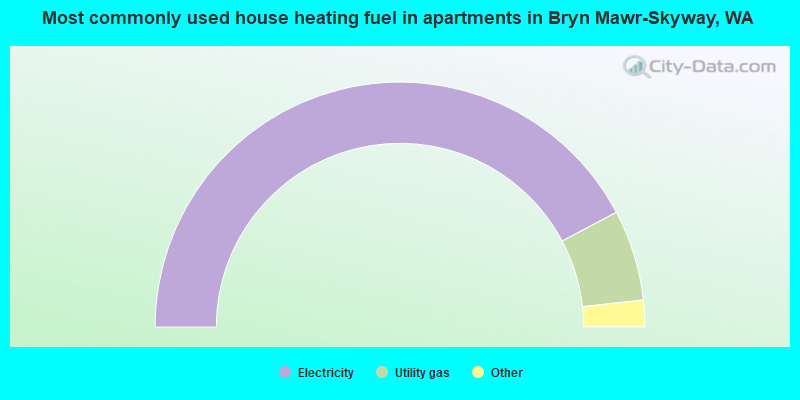
House heating fuel used in apartments - Utility gas (%)
House heating fuel used in apartments - Bottled, tank, or LP gas (%)
House heating fuel used in apartments - Electricity (%)
House heating fuel used in apartments - Fuel oil, kerosene, etc. (%)
House heating fuel used in apartments - Coal or coke (%)
House heating fuel used in apartments - Wood (%)
House heating fuel used in apartments - Solar energy (%)
House heating fuel used in apartments - Other fuel (%)
House heating fuel used in apartments - No fuel used (%)
Median year house/condo built: 1956Median year apartment built: 1991Household type by relationship:
Households: 18,131
Male householders: 3,363 (877 living alone ), Female householders: 3,304 (1,021 living alone )3,024 spouses (2,973 opposite-sex spouses ), 258 unmarried partners , (244 opposite-sex unmarried partners ), 5,409 children (5,345 natural , 29 adopted , 35 stepchildren ), 460 grandchildren , 284 brothers or sisters , 685 parents , 0 foster children , 281 other relatives , 943 non-relatives In group quarters: 115
Size of family households: 1,553 2-persons , 1,189 3-persons , 827 4-persons , 236 5-persons , 223 6-persons , 192 7-or-more-persons .
Size of nonfamily households: 2,042 1-person , 489 2-persons , 26 3-persons , 16 5-persons .
2,468 married couples with children. single-parent households (140 men , 781 women ).
62.1% of residents of Bryn Mawr-Skyway speak English at home. of residents speak Spanish at home (39% speak English very well , 36% speak English well , 25% speak English not well ).of residents speak other Indo-European language at home (88% speak English very well , 11% speak English well , 1% speak English not well ).of residents speak Asian or Pacific Island language at home (47% speak English very well , 33% speak English well , 17% speak English not well , 3% don't speak English at all ).of residents speak other language at home (78% speak English very well , 11% speak English well , 9% speak English not well , 2% don't speak English at all ).
Foreign born population: 5,286 (29.2%)of them are naturalized citizens )
Median number of rooms in houses and condos:
Median number of rooms in apartments
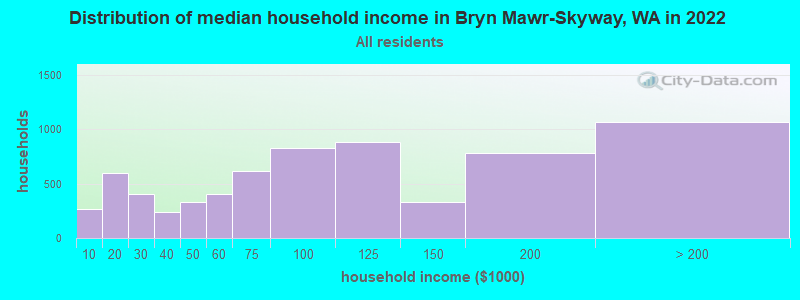
Bryn Mawr-Skyway, WA household income distribution 270 Less than $10,000603 $10,000 to $19,999404 $20,000 to $29,999239 $30,000 to $39,999329 $40,000 to $49,999404 $50,000 to $59,999621 $60,000 to $74,999828 $75,000 to $99,999885 $100,000 to $124,999335 $125,000 to $149,999785 $150,000 to $199,9991,069 $200,000 or more
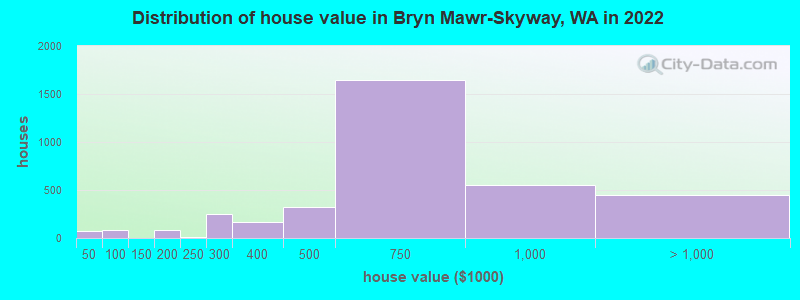
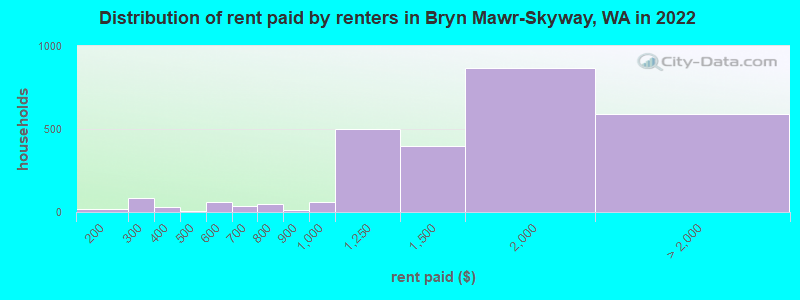
Home value of owner - occupied houses in 2022 in Bryn Mawr-Skyway, WA 20 Less than $10,00015 $10,000 to $14,99911 $25,000 to $29,99923 $30,000 to $34,99926 $50,000 to $59,99923 $60,000 to $69,99933 $70,000 to $79,99982 $150,000 to $174,9998 $200,000 to $249,999249 $250,000 to $299,999167 $300,000 to $399,999323 $400,000 to $499,9991,644 $500,000 to $749,999557 $750,000 to $999,999315 $1,000,000 to $1,499,999103 $1,500,000 to $1,999,99927 $2,000,000 or moreRent paid by renters in 2022 in Bryn Mawr-Skyway, WA 20 $150 to $19982 $200 to $24918 $300 to $34911 $350 to $3997 $400 to $44960 $550 to $59937 $600 to $64931 $700 to $74914 $750 to $79911 $800 to $89960 $900 to $999497 $1,000 to $1,249396 $1,250 to $1,499867 $1,500 to $1,999278 $2,000 to $2,49994 $2,500 to $2,99924 $3,000 to $3,49945 $3,500 or more148 No cash rent
Percentage of workers working in this county: 96.4%Number of people working at home: 1,785 (20.0% of all workers )
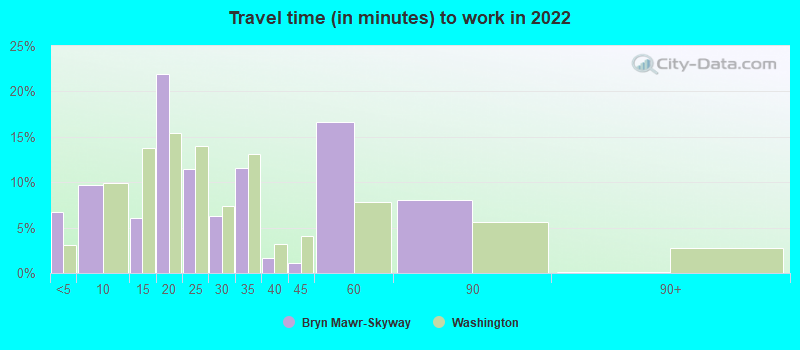
Travel time to work (commute)
Less than 5 minutes: 505 to 9 minutes: 16310 to 14 minutes: 30115 to 19 minutes: 84320 to 24 minutes: 1,20625 to 29 minutes: 77330 to 34 minutes: 1,28835 to 39 minutes: 32640 to 44 minutes: 31345 to 59 minutes: 78460 to 89 minutes: 55090 or more minutes: 95
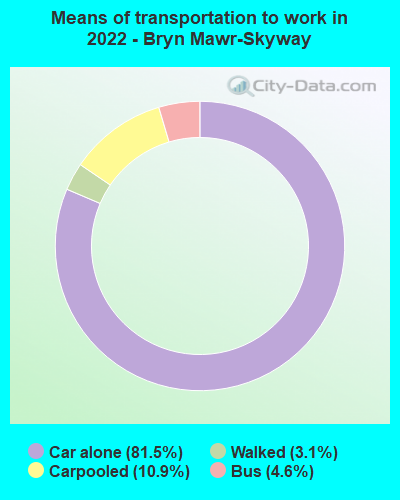
Means of transportation to work:
Drove a car alone: 967 (38.0%)Carpooled: 123 (4.8%)Bus : 33 (1.3%)Walked: 32 (1.3%)Worked at home: 1,785 (70.1%)
Unemployment by race in 2022
Unemployment rate for White non-Hispanic residents 14.0% Males0.5% FemalesUnemployment rate for Black residents 5.1% Males2.1% FemalesUnemployment rate for Asian residents 1.8% Males3.1% FemalesUnemployment rate for other race residents 16.5% MalesUnemployment rate for two or more race residents 3.0% Males17.7% FemalesUnemployment rate for Hispanic or Latino residents 17.1% Males
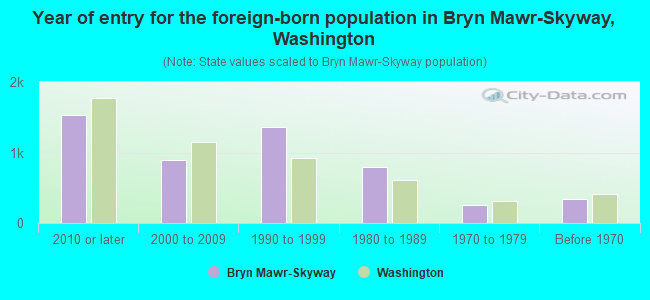
Year of entry for the foreign-born population in Bryn Mawr-Skyway, Washington
1,535 2010 or later 889 2000 to 2009 1,361 1990 to 1999 792 1980 to 1989 249 1970 to 1979 344 Before 1970
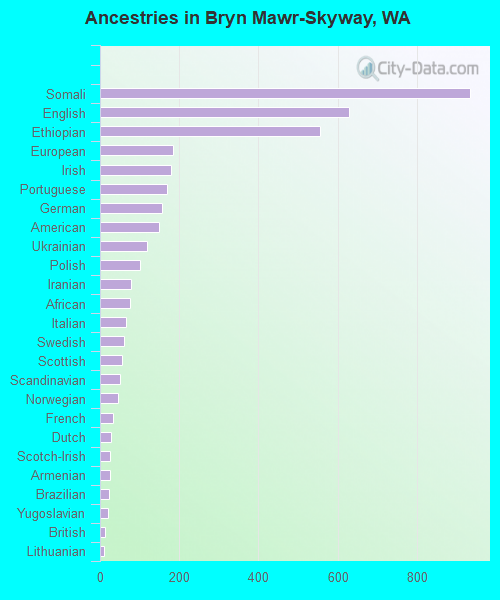
First ancestries reported:
Somali: 935 (9.1%)
English: 629 (6.1%)
Ethiopian: 556 (5.4%)
European: 185 (1.8%)
Irish: 179 (1.7%)
Portuguese: 168 (1.6%)
German: 156 (1.5%)
American: 150 (1.5%)
Ukrainian: 119 (1.2%)
Polish: 100 (1.0%)
Iranian: 79 (0.8%)
African: 75 (0.7%)
Italian: 66 (0.6%)
Swedish: 60 (0.6%)
Scottish: 55 (0.5%)
Scandinavian: 50 (0.5%)
Norwegian: 46 (0.4%)
French: 32 (0.3%)
Dutch: 27 (0.3%)
Scotch-Irish: 26 (0.3%)
Armenian: 24 (0.2%)
Brazilian: 23 (0.2%)
Yugoslavian: 19 (0.2%)
British: 13 (0.1%)
Lithuanian: 11 (0.1%)
Northern European: 10 (0.10%)
Welsh: 8 (0.08%) Most common places of birth for foreign-born residents (%): Vietnam Bryn Mawr-Skyway:
29.6% (1,567)Washington:
5.4% (62,003)
Philippines Bryn Mawr-Skyway:
17.3% (915)Washington:
6.3% (71,661)
China, excluding Hong Kong and Taiwan Bryn Mawr-Skyway:
11.6% (615)Washington:
7.4% (84,470)
Ethiopia Bryn Mawr-Skyway:
7.0% (372)Washington:
1.6% (17,938)
Somalia Bryn Mawr-Skyway:
6.6% (348)Washington:
0.7% (8,540)
Mexico Bryn Mawr-Skyway:
5.2% (277)Washington:
21.1% (241,655)
India Bryn Mawr-Skyway:
4.1% (215)Washington:
8.9% (101,353)
Other Western Africa Bryn Mawr-Skyway:
3.1% (166)Washington:
0.3% (3,638)
Thailand Bryn Mawr-Skyway:
2.2% (114)Washington:
0.9% (9,937)
Canada Bryn Mawr-Skyway:
2.1% (113)Washington:
4.1% (47,238)
Brazil Bryn Mawr-Skyway:
1.9% (100)Washington:
0.8% (9,359)
Honduras Bryn Mawr-Skyway:
1.8% (97)Washington:
0.6% (6,500)
Ukraine Bryn Mawr-Skyway:
1.6% (83)Washington:
3.1% (35,872)
Place of birth for U.S.-born residents:
This state: 7,790Other state: 4,463Northeast: 188Midwest: 804South: 1,912West: 1,516 90.9% of Bryn Mawr-Skyway residents lived in the same house 1 years ago.
Out of people who lived in different houses, 44.4% lived in this county.
Out of people who lived in different counties, 42.9% lived in Washington.
Bryn Mawr-Skyway:
90.9%State average:
85.2%
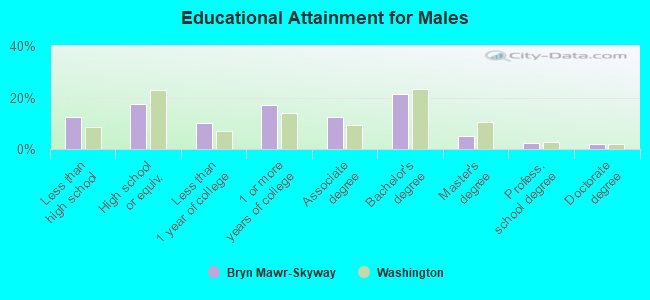
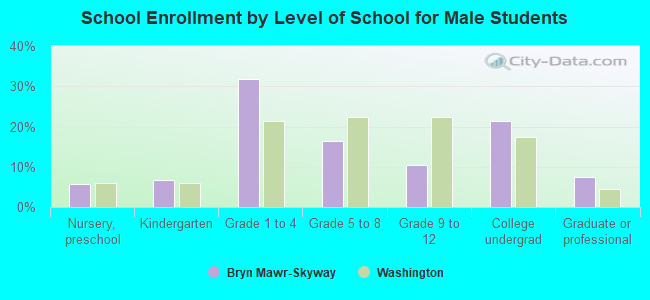
Education attainment for males 25 years and older:
No schooling: 251Nursery to 4th grade: 95th and 6th grade: 477th and 8th grade: 579th grade: 410th grade: 16011th grade: 6212th grade, no diploma: 193High school graduate (or equivalency): 1,091Less than 1 year of college: 622Some college more than 1 year, no degree: 1,083Associate degree: 780Bachelor's degree: 1,333Master's degree: 310Professional school degree: 138Doctorate degree: 126
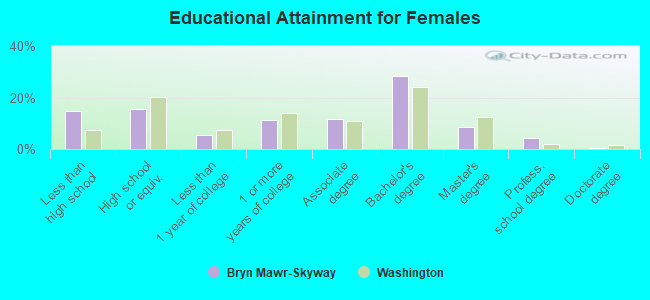
Education attainment for females 25 years and older:
No schooling: 301Nursery to 4th grade: 05th and 6th grade: 867th and 8th grade: 679th grade: 8710th grade: 6211th grade: 012th grade, no diploma: 379High school graduate (or equivalency): 1,031Less than 1 year of college: 369Some college more than 1 year, no degree: 737Associate degree: 777Bachelor's degree: 1,884Master's degree: 576Professional school degree: 273Doctorate degree: 26
Housing units in structures:
One, detached: 4,463One, attached: 130Two: 1543 or 4: 1465 to 9: 31610 to 19: 90620 to 49: 24050 or more: 584Mobile homes: 68Housing units lacking complete plumbing facilities in 2022: 1.3%Housing units lacking complete kitchen facilities in 2022: 1.6%House/condo owner moved in on average 14 years ago
Renter moved in on average 4 years ago
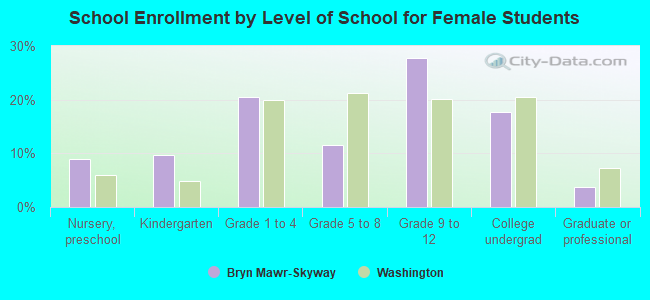
Private vs. public school enrollment:
Students in private schools in grades 1 to 8 (elementary and middle school): 159 Here:
9.5%Washington:
12.4%
Students in private schools in grades 9 to 12 (high school): 90 Here:
10.7%Washington:
9.2%
Students in private undergraduate colleges: 110 Here:
13.4%Washington:
16.5%