Bull Run, VA (Virginia) Houses and Residents
| Bull Run: | $357,013 |
| Virginia: | $365,700 |
Mean price in 2022:
Detached houses: $638,083
Here: $638,083 State: $472,865 Townhouses or other attached units: $366,931
Here: $366,931 State: $457,437 In 3-to-4-unit structures: $361,852
Here: $361,852 State: $252,346 In 5-or-more-unit structures: $241,709
Here: $241,709 State: $382,551
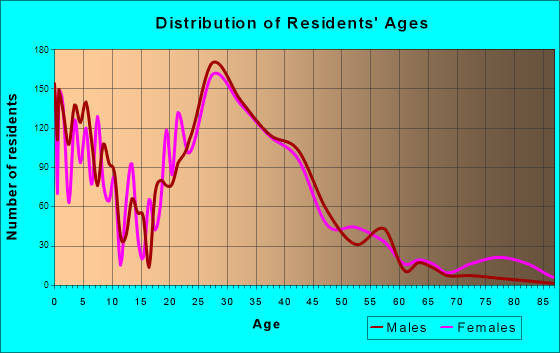
Total population: 14,983 (Urban population: 11,399, Rural population: 0)
Houses: 6,849 (6,431 occupied: 2,146 owner occupied, 4,318 renter occupied)
| % of renters here: | 67% |
| State: | 33% |
Housing density: 2,560 houses/condos per square mile
Median price asked for vacant for-sale houses and condos in 2022 in this county: $448,286.
Median contract rent in 2022: $1,698 (lower quartile is $1,468, upper quartile is $1,914)
Median rent asked for vacant for-rent units in 2022: $1,642
Median gross rent in Bull Run, VA in 2022: $1,774
Housing units in Bull Run with a mortgage: 1,647 (154 second mortgage, 10 home equity loan, 108 both second mortgage and home equity loan)
Houses without a mortgage: 0
Median household income for houses/condos with a mortgage: $99,448
Median household income for apartments without a mortgage: $52,464
Median monthly housing costs: $1,764
Compare current foreclosures near Bull Run, VA:
| Photo | Address | Area | Beds / Baths | Price | Details |
|---|---|---|---|---|---|

|
#1
Oriley Ct
Manassas, VA 20112
|
1,728 sq. feet
|
2 baths 3 beds |
show details | |

|
#2
Tamberly Lane
Manassas, VA 20111
|
- sq. feet
|
2 baths 4 beds |
show details | |

|
#3
Culpeper Dr
Woodbridge, VA 22191
|
1,224 sq. feet
|
3 baths 4 beds |
show details | |

|
#4
Lakewood Dr
Woodbridge, VA 22192
|
2,038 sq. feet
|
2 baths 4 beds |
show details | |

|
#5
Clovermeadow Dr
Vienna, VA 22182
|
3,767 sq. feet
|
4 baths 6 beds |
show details | |

|
#6
Carolyn Forest Dr
Woodbridge, VA 22192
|
1,593 sq. feet
|
2 baths 2 beds |
show details | |

|
#7
Lees Corner Rd
Chantilly, VA 20151
|
1,216 sq. feet
|
1 baths 3 beds |
show details | |

|
#8
Cabbel Dr
Manassas, VA 20111
|
1,807 sq. feet
|
1 baths 3 beds |
show details | |

|
#9
Southgate Ct
Woodbridge, VA 22193
|
1,826 sq. feet
|
2 baths 4 beds |
show details | |

|
#10
Cloverdale Rd # 22193
Woodbridge, VA 22193
|
1,410 sq. feet
|
3 baths 3 beds |
show details |
| Photo | Address | Area | Beds / Baths | Price | Details |
|---|---|---|---|---|---|

|
#11
Counsellor Dr
Vienna, VA 22181
|
1,916 sq. feet
|
2 baths 5 beds |
show details | |

|
#12
Newtowne Ct
Lorton, VA 22079
|
- sq. feet
|
2 baths 4 beds |
show details | |

|
#13
Rolling Spring Ct
Springfield, VA 22152
|
3,365 sq. feet
|
4 baths 4 beds |
show details | |

|
#14
Park Crescent Cir
Herndon, VA 20171
|
2,148 sq. feet
|
3 baths 3 beds |
show details | |

|
#15
Mckee Way
Manassas, VA 20111
|
2,510 sq. feet
|
3 baths 4 beds |
show details | |

|
#16
Labrador Loop
Manassas, VA 20112
|
2,194 sq. feet
|
3 baths 4 beds |
show details | |

|
#17
Dubois Ct
Woodbridge, VA 22193
|
1,356 sq. feet
|
2 baths 4 beds |
show details | |

|
#18
Lapene Ct
Woodbridge, VA 22192
|
2,896 sq. feet
|
2 baths 4 beds |
show details | |

|
#19
Brazilnut Ct
Woodbridge, VA 22193
|
2,146 sq. feet
|
3 baths 3 beds |
show details | |

|
#20
Sunrise Valley Dr
Reston, VA 20191
|
980 sq. feet
|
2 baths 2 beds |
show details |
| Photo | Address | Area | Beds / Baths | Price | Details |
|---|---|---|---|---|---|

|
#21
Auburn Rd
Nokesville, VA 20181
|
3,388 sq. feet
|
2 baths 5 beds |
show details | |

|
#22
Kincheloe Rd
Clifton, VA 20124
|
4,492 sq. feet
|
4 baths 5 beds |
show details | |

|
#23
Commonwealth Blvd
Fairfax, VA 22032
|
2,103 sq. feet
|
2 baths 4 beds |
show details | |

|
#24
Castle Harbor Way
Centreville, VA 20120
|
1,518 sq. feet
|
2 baths 3 beds |
show details | |

|
#25
Caribbean Ct
Haymarket, VA 20169
|
4,853 sq. feet
|
4 baths 5 beds |
show details | |

|
#26
Saddlehorn Ct
Burke, VA 22015
|
1,138 sq. feet
|
2 baths 3 beds |
show details | |

|
#27
Schwenger Pl
Herndon, VA 20170
|
1,530 sq. feet
|
2 baths 3 beds |
show details | |

|
#28
Stonepath Cir
Centreville, VA 20120
|
1,452 sq. feet
|
3 baths 4 beds |
show details | |

|
#29
Arkansas Ave
Herndon, VA 20170
|
1,025 sq. feet
|
1 baths 3 beds |
show details | |

|
#30
Rockton Ct
Centreville, VA 20121
|
1,440 sq. feet
|
2 baths 3 beds |
show details |
| Photo | Address | Area | Beds / Baths | Price | Details |
|---|---|---|---|---|---|

|
#31
Reese Ct
Warrenton, VA 20187
|
3,004 sq. feet
|
5 baths 4 beds |
show details | |

|
#32
Moore Dr
Manassas, VA 20111
|
1,872 sq. feet
|
1 baths 3 beds |
show details | |

|
#33
Scotch Heather Pl
Woodbridge, VA 22192
|
2,716 sq. feet
|
2 baths 3 beds |
show details | |

|
#34
Prosperity Ave
Fairfax, VA 22031
|
2,090 sq. feet
|
3 baths 4 beds |
show details | |

|
#35
Collis Oak Ct
Fairfax, VA 22033
|
1,362 sq. feet
|
3 baths 3 beds |
show details | |

|
#36
Middlegate Dr
Fairfax, VA 22032
|
2,220 sq. feet
|
2 baths 4 beds |
show details | |

|
#37
Nassau Dr
Woodbridge, VA 22193
|
2,300 sq. feet
|
3 baths 5 beds |
show details | |

|
#38
Forrester Ln
Manassas, VA 20109
|
1,189 sq. feet
|
2 baths 3 beds |
show details | |

|
#39
Overleigh Dr
Woodbridge, VA 22192
|
1,825 sq. feet
|
2 baths 3 beds |
show details | |

|
#40
Georgetown Rd
Broad Run, VA 20137
|
3,554 sq. feet
|
3 baths 3 beds |
show details |
| Photo | Address | Area | Beds / Baths | Price | Details |
|---|---|---|---|---|---|

|
#41
Capella Ave
Burke, VA 22015
|
2,385 sq. feet
|
2 baths 4 beds |
show details | |

|
#42
Three Dormers Ct
Woodbridge, VA 22193
|
3,592 sq. feet
|
3 baths 5 beds |
show details | |

|
#43
Gran Deur Dr
Woodbridge, VA 22193
|
1,511 sq. feet
|
2 baths 3 beds |
show details | |

|
#44
Gershwin Ct
Oakton, VA 22124
|
2,236 sq. feet
|
3 baths 4 beds |
show details | |

|
#45
Farrabow Ln
Woodbridge, VA 22192
|
1,728 sq. feet
|
2 baths 3 beds |
show details | |

|
#46
Jermantown Rd
Oakton, VA 22124
|
1,292 sq. feet
|
3 baths 3 beds |
show details | |

|
#47
Doulton Ct
Fairfax, VA 22032
|
2,551 sq. feet
|
3 baths 6 beds |
show details | |

|
#48
Packard Dr
Woodbridge, VA 22193
|
3,984 sq. feet
|
4 baths 3 beds |
show details | |

|
#49
Sudberry Ln
Woodbridge, VA 22193
|
1,408 sq. feet
|
1 baths 3 beds |
show details | |

|
Check over 1 million property listings on Foreclosure.com!
|
browse all offers | |||


Median year apartment built: 1993
Household type by relationship:
Households: 16,821- Male householders: 3,517 (894 living alone), Female householders: 2,854 (1,026 living alone)
2,337 spouses (2,337 opposite-sex spouses), 847 unmarried partners, (746 opposite-sex unmarried partners), 4,888 children (4,746 natural, 25 adopted, 116 stepchildren), 69 grandchildren, 359 brothers or sisters, 472 parents, 0 foster children, 546 other relatives, 924 non-relatives
- In group quarters: 4
Size of family households: 1,010 2-persons, 1,037 3-persons, 1,010 4-persons, 495 5-persons, 99 6-persons, 143 7-or-more-persons.
Size of nonfamily households: 2,029 1-person, 575 2-persons, 36 3-persons, 46 4-persons.
2,530 married couples with children.
1,447 single-parent households (225 men, 1,222 women).
42.9% of residents of Bull Run speak English at home.
35.5% of residents speak Spanish at home (42% speak English very well, 16% speak English well, 24% speak English not well, 18% don't speak English at all).
5.4% of residents speak other Indo-European language at home (57% speak English very well, 26% speak English well, 16% speak English not well).
9.9% of residents speak Asian or Pacific Island language at home (44% speak English very well, 25% speak English well, 29% speak English not well, 2% don't speak English at all).
6.1% of residents speak other language at home (65% speak English very well, 25% speak English well, 10% speak English not well).
Foreign born population: 7,167 (42.6%)
(43.6% of them are naturalized citizens)
| Here: | 5.9 |
| State: | 7.0 |
| Here: | 4.0 |
| State: | 4.3 |

- Bedrooms in owner-occupied houses and condos in Bull Run, Virginia
- 0no bedroom
- 431 bedroom
- 7272 bedrooms
- 9153 bedrooms
- 2384 bedrooms
- 2235+ bedrooms

- Bedrooms in renter-occupied apartments in Bull Run, Virginia
- 29no bedroom
- 7201 bedroom
- 2,5562 bedrooms
- 8803 bedrooms
- 1124 bedrooms
- 225+ bedrooms

- Cars and other vehicles available in Bull Run in owner-occupied houses/condos
- 44no vehicle
- 7121 vehicle
- 1,0212 vehicles
- 2893 vehicles
- 374 vehicles
- 445+ vehicles

- Cars and other vehicles available in Bull Run in renter-occupied apartments
- 236no vehicle
- 2,2491 vehicle
- 1,5112 vehicles
- 2903 vehicles
- 334 vehicles
- 05+ vehicles

- Rooms in owner-occupied houses in Bull Run, Virginia
- 01 room
- 172 rooms
- 1023 rooms
- 3194 rooms
- 4225 rooms
- 5866 rooms
- 2947 rooms
- 1658 rooms
- 2409+ rooms

- Rooms in renter-occupied apartments in Bull Run, Virginia
- 291 room
- 1202 rooms
- 6893 rooms
- 2,1914 rooms
- 7685 rooms
- 3826 rooms
- 607 rooms
- 168 rooms
- 639+ rooms


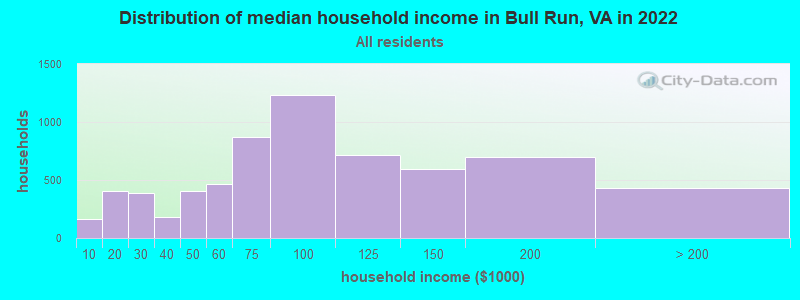
Bull Run, VA household income distribution

- 166Less than $10,000
- 408$10,000 to $19,999
- 387$20,000 to $29,999
- 178$30,000 to $39,999
- 403$40,000 to $49,999
- 462$50,000 to $59,999
- 868$60,000 to $74,999
- 1,230$75,000 to $99,999
- 715$100,000 to $124,999
- 598$125,000 to $149,999
- 698$150,000 to $199,999
- 428$200,000 or more
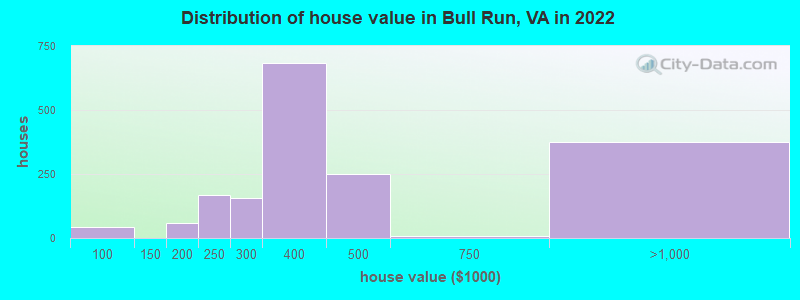
Home value of owner - occupied houses in 2022 in Bull Run, VA
-
- 0Less than $10,000
- 36$70,000 to $79,999
- 8$90,000 to $99,999
- 59$175,000 to $199,999
- 169$200,000 to $249,999
- 157$250,000 to $299,999
- 682$300,000 to $399,999
- 250$400,000 to $499,999
- 6$500,000 to $749,999
- 376$750,000 to $999,999
Rent paid by renters in 2022 in Bull Run, VA
-
- 38$100 to $149
- 36$150 to $199
- 21$250 to $299
- 16$350 to $399
- 19$400 to $449
- 46$450 to $499
- 51$600 to $649
- 9$800 to $899
- 13$900 to $999
- 73$1,000 to $1,249
- 559$1,250 to $1,499
- 2,920$1,500 to $1,999
- 554$2,000 to $2,499
- 13$2,500 to $2,999
- 55No cash rent

Percentage of workers working in this county: 52.2%
Number of people working at home: 1,219 (12.4% of all workers)
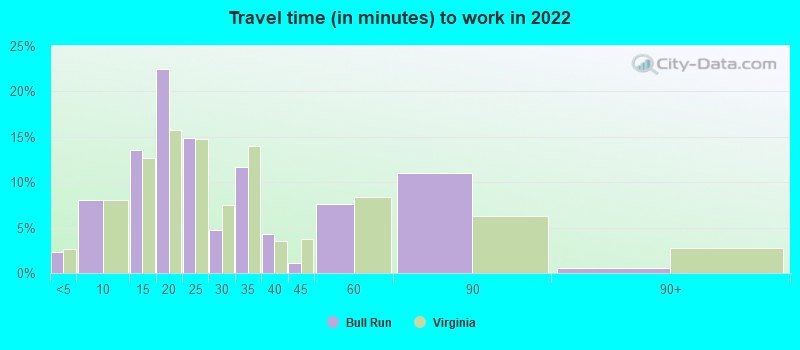
Travel time to work (commute)
- Less than 5 minutes: 154
- 5 to 9 minutes: 534
- 10 to 14 minutes: 1,435
- 15 to 19 minutes: 1,215
- 20 to 24 minutes: 672
- 25 to 29 minutes: 446
- 30 to 34 minutes: 1,271
- 35 to 39 minutes: 392
- 40 to 44 minutes: 629
- 45 to 59 minutes: 515
- 60 to 89 minutes: 1,230
- 90 or more minutes: 210
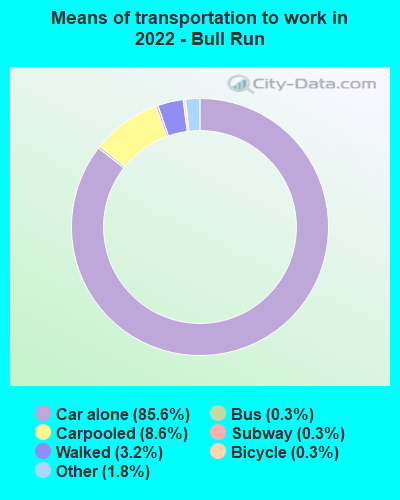
Means of transportation to work:
- Drove a car alone: 3,981 (66.2%)
- Carpooled: 398 (6.6%)
- Bus: 7 (0.1%)
- Long-distance train or commuter rail: 22 (0.4%)
- Taxi: 119 (2.0%)
- Bicycle: 11 (0.2%)
- Walked: 139 (2.3%)
- Worked at home: 1,219 (20.3%)
- Unemployment by race in 2022
- Unemployment rate for White non-Hispanic residents
- 0.2%Males
- 2.4%Females
- Unemployment rate for Black residents
- 6.9%Females
- Unemployment rate for Asian residents
- 2.9%Males
- 2.2%Females
- Unemployment rate for other race residents
- 3.7%Males
- Unemployment rate for two or more race residents
- 0.2%Males
- 1.1%Females
- Unemployment rate for Hispanic or Latino residents
- 0.6%Males
- 3.0%Females

- Year of entry for the foreign-born population in Bull Run, Virginia
- 3,3282010 or later
- 2,6912000 to 2009
- 9701990 to 1999
- 7421980 to 1989
- 1641970 to 1979
- 63Before 1970

First ancestries reported:
- Ghanaian: 489 (4.5%)
- Ethiopian: 433 (4.0%)
- American: 411 (3.8%)
- Irish: 248 (2.3%)
- Nigerian: 215 (2.0%)
- African: 188 (1.7%)
- Afghan: 183 (1.7%)
- English: 166 (1.5%)
- German: 141 (1.3%)
- European: 133 (1.2%)
- Egyptian: 95 (0.9%)
- Jamaican: 41 (0.4%)
- Eastern European: 39 (0.4%)
- Armenian: 23 (0.2%)
- Russian: 20 (0.2%)
- Bulgarian: 19 (0.2%)
- Croatian: 17 (0.2%)
- Italian: 16 (0.1%)
- French: 15 (0.1%)
- Polish: 15 (0.1%)
- Lebanese: 9 (0.08%)
- Greek: 7 (0.06%)
- Scottish: 7 (0.06%)
Most common places of birth for foreign-born residents (%):
| Bull Run: | 28.6% (2,126) |
| Virginia: | 9.9% (107,534) |
| Bull Run: | 10.5% (780) |
| Virginia: | 3.3% (35,938) |
| Bull Run: | 7.3% (541) |
| Virginia: | 3.0% (32,892) |
| Bull Run: | 6.7% (494) |
| Virginia: | 1.6% (17,346) |
| Bull Run: | 4.8% (353) |
| Virginia: | 0.3% (2,740) |
| Bull Run: | 4.4% (326) |
| Virginia: | 1.8% (19,426) |
| Bull Run: | 4.0% (296) |
| Virginia: | 0.8% (8,186) |
| Bull Run: | 3.7% (278) |
| Virginia: | 4.9% (52,857) |
| Bull Run: | 2.7% (198) |
| Virginia: | 2.4% (25,722) |
| Bull Run: | 2.5% (184) |
| Virginia: | 2.9% (32,082) |
| Bull Run: | 2.2% (165) |
| Virginia: | 0.6% (6,956) |
| Bull Run: | 2.2% (165) |
| Virginia: | 4.8% (52,629) |
| Bull Run: | 2.1% (159) |
| Virginia: | 0.9% (9,695) |
| Bull Run: | 2.1% (154) |
| Virginia: | 4.2% (45,750) |
| Bull Run: | 2.0% (149) |
| Virginia: | 0.2% (2,575) |
| Bull Run: | 1.9% (143) |
| Virginia: | 5.3% (57,498) |
| Bull Run: | 1.9% (143) |
| Virginia: | 0.2% (2,288) |
| Bull Run: | 1.9% (139) |
| Virginia: | 9.0% (97,830) |
Place of birth for U.S.-born residents:
- This state: 5,535
- Other state: 3,671
- Northeast: 1,230
- Midwest: 691
- South: 1,359
- West: 395
83.6% of Bull Run residents lived in the same house 1 years ago.
Out of people who lived in different houses, 27.5% lived in this county.
Out of people who lived in different counties, 93.4% lived in Virginia.
| Bull Run: | 83.6% |
| State average: | 86.6% |
Education attainment for males 25 years and older:
- No schooling: 187
- Nursery to 4th grade: 97
- 5th and 6th grade: 192
- 7th and 8th grade: 48
- 9th grade: 45
- 10th grade: 114
- 11th grade: 90
- 12th grade, no diploma: 31
- High school graduate (or equivalency): 1,348
- Less than 1 year of college: 460
- Some college more than 1 year, no degree: 615
- Associate degree: 534
- Bachelor's degree: 1,386
- Master's degree: 235
- Professional school degree: 56
- Doctorate degree: 36

Education attainment for females 25 years and older:
- No schooling: 238
- Nursery to 4th grade: 26
- 5th and 6th grade: 333
- 7th and 8th grade: 129
- 9th grade: 87
- 10th grade: 22
- 11th grade: 64
- 12th grade, no diploma: 113
- High school graduate (or equivalency): 1,506
- Less than 1 year of college: 319
- Some college more than 1 year, no degree: 504
- Associate degree: 224
- Bachelor's degree: 1,426
- Master's degree: 364
- Professional school degree: 95
- Doctorate degree: 22

Housing units in structures:
- One, detached: 550
- One, attached: 1,943
- Two: 52
- 3 or 4: 214
- 5 to 9: 555
- 10 to 19: 2,985
- 20 to 49: 151
- 50 or more: 396
Housing units lacking complete kitchen facilities in 2022: 0.4%
House/condo owner moved in on average 8 years ago
Renter moved in on average 1 years ago

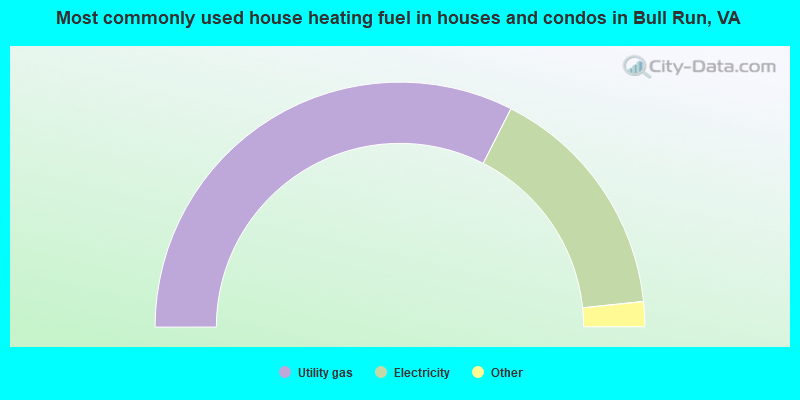
- 65.0%Utility gas
- 31.7%Electricity
- 2.7%Bottled, tank, or LP gas
- 0.5%Fuel oil, kerosene, etc.
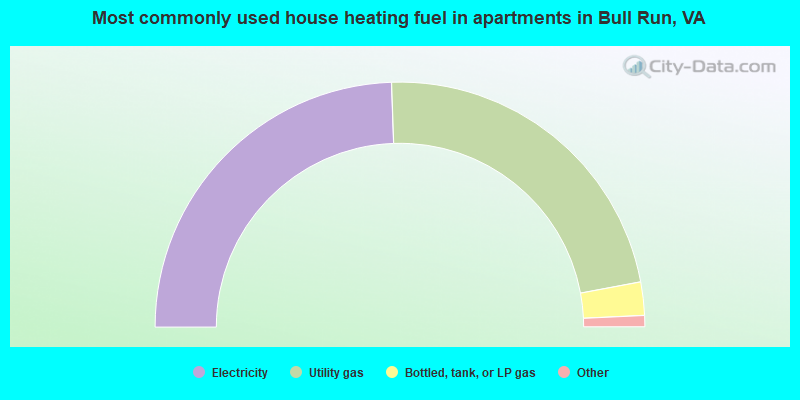
- 49.0%Electricity
- 45.3%Utility gas
- 4.4%Bottled, tank, or LP gas
- 1.3%No fuel used
- 0.1%Wood
Private vs. public school enrollment:
| Here: | 2.4% |
| Virginia: | 13.2% |
| Here: | 4.1% |
| Virginia: | 10.2% |
| Here: | 8.7% |
| Virginia: | 18.7% |


