Bull Valley, IL (Illinois) Houses and Residents
| Bull Valley: | $474,150 |
| Illinois: | $251,600 |
Mean price in 2022:
Detached houses: $609,921
Here: $609,921 State: $310,164
Total population: 1,107 (Urban population: 14 (all inside urban clusters), Rural population: 680 (32 farm, 648 nonfarm))
Houses: 546 (510 occupied: 483 owner occupied, 32 renter occupied)
| % of renters here: | 6% |
| State: | 33% |
Housing density: 97 houses/condos per square mile
Median price asked for vacant for-sale houses and condos in 2022: $1,482,535.
Median contract rent in 2022: over $2,000
Median gross rent in Bull Valley, IL in 2022: over $2,000
Housing units in Bull Valley with a mortgage: 280 (33 second mortgage, 0 home equity loan, 31 both second mortgage and home equity loan)
Houses without a mortgage: 33
Median household income for houses/condos with a mortgage: $177,035
Median household income for apartments without a mortgage: $95,507
Median monthly housing costs: $2,503
Compare current foreclosures near Bull Valley, IL:
| Photo | Address | Area | Beds / Baths | Price | Details |
|---|---|---|---|---|---|

|
#1
Sara Ln
Marengo, IL 60152
|
3,202 sq. feet
|
2 baths 4 beds |
$425,000
|
show details |

|
#2
359th Ave
Twin Lakes, WI 53181
|
1,053 sq. feet
|
1 baths 2 beds |
$212,000
|
show details |

|
#3
Wisconsin Ave
Barrington, IL 60010
|
1,297 sq. feet
|
2 baths 3 beds |
$499,000
|
show details |

|
#4
Lippincott Rd
Fox Lake, IL 60020
|
1,247 sq. feet
|
1 baths 3 beds |
show details | |

|
#5
Windridge Ct
Carpentersville, IL 60110
|
3,046 sq. feet
|
2 baths 4 beds |
show details | |

|
#6
Salem Rd
Wonder Lake, IL 60097
|
1,212 sq. feet
|
1 baths 2 beds |
show details | |

|
#7
Oak Leaf Cir
Lake Villa, IL 60046
|
2,344 sq. feet
|
2 baths 4 beds |
show details | |

|
#8
Upland Road
Hampshire, IL 60140
|
- sq. feet
|
2 baths 3 beds |
show details | |

|
#9
Partridge Ct
Algonquin, IL 60102
|
1,400 sq. feet
|
2 baths 2 beds |
show details | |

|
#10
Pine Ln
Carpentersville, IL 60110
|
2,188 sq. feet
|
3 baths 3 beds |
show details |
| Photo | Address | Area | Beds / Baths | Price | Details |
|---|---|---|---|---|---|

|
#11
W Engle Dr
Lake Villa, IL 60046
|
1,456 sq. feet
|
1 baths 3 beds |
show details | |

|
#12
Highland Ave
Wauconda, IL 60084
|
1,020 sq. feet
|
1 baths 2 beds |
show details | |

|
#13
Wayne St
Union, IL 60180
|
1,595 sq. feet
|
1 baths 3 beds |
show details | |

|
#14
Fieldbrook Dr
Wauconda, IL 60084
|
2,286 sq. feet
|
3 baths 3 beds |
show details | |

|
#15
Fairway Cir
Barrington, IL 60010
|
1,610 sq. feet
|
2 baths 3 beds |
show details | |

|
#16
Westport Dr
Hampshire, IL 60140
|
3,018 sq. feet
|
3 baths 4 beds |
show details | |

|
#17
Lancaster St
Huntley, IL 60142
|
1,914 sq. feet
|
2 baths 3 beds |
show details | |

|
#18
Harbor Rd
Wonder Lake, IL 60097
|
2,100 sq. feet
|
2 baths 4 beds |
show details | |

|
#19
Glenbrook Ct
Gilberts, IL 60136
|
2,895 sq. feet
|
2 baths 5 beds |
show details | |

|
#20
Chicago Ave
Crystal Lake, IL 60014
|
861 sq. feet
|
1 baths 2 beds |
show details |
| Photo | Address | Area | Beds / Baths | Price | Details |
|---|---|---|---|---|---|

|
#21
Otis Rd
Barrington, IL 60010
|
5,900 sq. feet
|
9 baths 7 beds |
show details | |

|
#22
Woodside Ct
Grayslake, IL 60030
|
3,078 sq. feet
|
2 baths 4 beds |
show details | |

|
#23
N Park Ave
Lake Villa, IL 60046
|
1,184 sq. feet
|
1 baths 3 beds |
show details | |

|
#24
N Hidden Trl
Spring Grove, IL 60081
|
2,463 sq. feet
|
2 baths 3 beds |
show details | |

|
#25
Fernwood Ln
Algonquin, IL 60102
|
5,776 sq. feet
|
5 baths 5 beds |
show details | |

|
#26
Lindy St
Ingleside, IL 60041
|
1,926 sq. feet
|
2 baths 3 beds |
show details | |

|
#27
W Meadowview Dr
Round Lake, IL 60073
|
2,756 sq. feet
|
2 baths 4 beds |
show details | |

|
#28
Old Barn Rd
Barrington, IL 60010
|
2,371 sq. feet
|
5 baths 4 beds |
show details | |

|
#29
Pond Gate Dr
Barrington, IL 60010
|
4,996 sq. feet
|
2 baths 4 beds |
show details | |

|
#30
Pilgrims Pass
Mchenry, IL 60051
|
2,461 sq. feet
|
3 baths 4 beds |
show details |
| Photo | Address | Area | Beds / Baths | Price | Details |
|---|---|---|---|---|---|

|
#31
Blakely St
Woodstock, IL 60098
|
1,008 sq. feet
|
1 baths 3 beds |
show details | |

|
#32
N Gilmer Rd
Mundelein, IL 60060
|
1,908 sq. feet
|
2 baths 4 beds |
show details | |

|
#33
Meadow Hill Ln
Round Lake, IL 60073
|
1,176 sq. feet
|
1 baths 3 beds |
show details | |

|
#34
N Old Lake Ave
Antioch, IL 60002
|
2,904 sq. feet
|
2 baths 3 beds |
show details | |

|
#35
Brookwood Trl
Mchenry, IL 60050
|
1,140 sq. feet
|
3 baths 3 beds |
show details | |

|
#36
Sussex Dr
Mchenry, IL 60050
|
1,110 sq. feet
|
2 baths 2 beds |
show details | |

|
#37
Sage Ln
Harvard, IL 60033
|
2,280 sq. feet
|
2 baths 4 beds |
show details | |

|
#38
Wildwood Dr
Mchenry, IL 60051
|
1,340 sq. feet
|
3 baths 2 beds |
show details | |

|
#39
S Sheridan Rd
Mchenry, IL 60051
|
999 sq. feet
|
1 baths 2 beds |
show details | |

|
#40
Aster Ct
Lake In The Hills, IL 60156
|
2,049 sq. feet
|
2 baths 4 beds |
show details |
| Photo | Address | Area | Beds / Baths | Price | Details |
|---|---|---|---|---|---|

|
#41
N Van Buren St
Dundee, IL 60118
|
2,356 sq. feet
|
2 baths 3 beds |
show details | |

|
#42
Cherokee Dr
Round Lake, IL 60073
|
1,136 sq. feet
|
2 baths 4 beds |
show details | |

|
#43
Tappan St
Woodstock, IL 60098
|
925 sq. feet
|
1 baths 3 beds |
show details | |

|
#44
W Kinley Blvd
Mchenry, IL 60050
|
1,068 sq. feet
|
3 baths 3 beds |
show details | |

|
#45
S Hough St
Barrington, IL 60010
|
1,100 sq. feet
|
1 baths 2 beds |
show details | |

|
#46
Berkshire Dr
Crystal Lake, IL 60014
|
- sq. feet
|
2 baths 4 beds |
show details | |

|
#47
Robin Ln
Crystal Lake, IL 60014
|
3,183 sq. feet
|
2 baths 4 beds |
show details | |

|
#48
Wainwright Dr
Wonder Lake, IL 60097
|
2,040 sq. feet
|
1 baths 3 beds |
show details | |

|
#49
Vintage Way
Spring Grove, IL 60081
|
2,400 sq. feet
|
2 baths 3 beds |
show details | |

|
Check over 1 million property listings on Foreclosure.com!
|
browse all offers | |||


 | Ryan Homes-The Conservancy (7 replies) |
| Suburbs w/ highest and lowest property taxes (160 replies) |
| Barrington(s), Tower Lake, Wheaton, Inverness, and ? (55 replies) |
| LITH, Crystal Lake, Cary (West of Fox River) (11 replies) |
| Woodstock- Bull Valley? (8 replies) |
| Any New Construction in Top School Districts? (44 replies) |

Median year apartment built: 1982
Household type by relationship:
Households: 1,250- Male householders: 268 (48 living alone), Female householders: 236 (52 living alone)
375 spouses (375 opposite-sex spouses), 29 unmarried partners, (29 opposite-sex unmarried partners), 227 children (227 natural, 0 adopted, 0 stepchildren), 19 grandchildren, 0 brothers or sisters, 8 parents, 0 foster children, 30 other relatives, 56 non-relatives
Size of family households: 229 2-persons, 70 3-persons, 45 4-persons, 7 5-persons, 9 6-persons, 4 7-or-more-persons.
Size of nonfamily households: 115 1-person, 10 2-persons, 3 3-persons, 14 5-persons.
75 married couples with children.
3 single-parent households (0 men, 3 women).
88.2% of residents of Bull Valley speak English at home.
3.8% of residents speak Spanish at home (60% speak English very well, 20% speak English well, 20% don't speak English at all).
6.1% of residents speak other Indo-European language at home (73% speak English very well, 16% speak English well, 11% speak English not well).
2.6% of residents speak Asian or Pacific Island language at home (39% speak English very well, 61% speak English well).
Foreign born population: 130 (10.4%)
(56.2% of them are naturalized citizens)
| Here: | 8.5 |
| State: | 6.4 |
| Here: | 9.3 |
| State: | 4.1 |

- Bedrooms in owner-occupied houses and condos in Bull Valley, Illinois
- 3no bedroom
- 11 bedroom
- 332 bedrooms
- 1923 bedrooms
- 2114 bedrooms
- 445+ bedrooms

- Bedrooms in renter-occupied apartments in Bull Valley, Illinois
- 0no bedroom
- 01 bedroom
- 22 bedrooms
- 133 bedrooms
- 44 bedrooms
- 135+ bedrooms

- Cars and other vehicles available in Bull Valley in owner-occupied houses/condos
- 9no vehicle
- 831 vehicle
- 2242 vehicles
- 1003 vehicles
- 504 vehicles
- 165+ vehicles

- Cars and other vehicles available in Bull Valley in renter-occupied apartments
- 0no vehicle
- 101 vehicle
- 92 vehicles
- 03 vehicles
- 04 vehicles
- 135+ vehicles

- Rooms in owner-occupied houses in Bull Valley, Illinois
- 31 room
- 02 rooms
- 03 rooms
- 174 rooms
- 115 rooms
- 596 rooms
- 697 rooms
- 918 rooms
- 2339+ rooms

- Rooms in renter-occupied apartments in Bull Valley, Illinois
- 01 room
- 02 rooms
- 03 rooms
- 24 rooms
- 05 rooms
- 06 rooms
- 137 rooms
- 08 rooms
- 179+ rooms


Bull Valley, IL household income distribution

- 7Less than $10,000
- 29$10,000 to $19,999
- 1$20,000 to $29,999
- 49$30,000 to $39,999
- 11$40,000 to $49,999
- 15$50,000 to $59,999
- 11$60,000 to $74,999
- 62$75,000 to $99,999
- 69$100,000 to $124,999
- 23$125,000 to $149,999
- 77$150,000 to $199,999
- 163$200,000 or more
Home value of owner - occupied houses in 2022 in Bull Valley, IL
-
- 5Less than $10,000
- 2$175,000 to $199,999
- 0$200,000 to $249,999
- 29$250,000 to $299,999
- 156$300,000 to $399,999
- 212$400,000 to $499,999
- 118$500,000 to $749,999
- 53$750,000 to $999,999
- 9$1,000,000 to $1,499,999
- 1$1,500,000 to $1,999,999
Rent paid by renters in 2022 in Bull Valley, IL
-
- 6$1,000 to $1,249
- 4$2,500 to $2,999
- 15$3,500 or more
- 8No cash rent


Percentage of workers working in this county: 65.4%
Number of people working at home: 149 (26.0% of all workers)
Travel time to work (commute)
- Less than 5 minutes: 3
- 5 to 9 minutes: 10
- 10 to 14 minutes: 71
- 15 to 19 minutes: 50
- 20 to 24 minutes: 32
- 25 to 29 minutes: 7
- 30 to 34 minutes: 114
- 35 to 39 minutes: 8
- 40 to 44 minutes: 5
- 45 to 59 minutes: 53
- 60 to 89 minutes: 76
- 90 or more minutes: 9
Means of transportation to work:
- Drove a car alone: 267 (64.0%)
- Taxi: 4 (1.0%)
- Walked: 5 (1.2%)
- Worked at home: 149 (35.7%)

- Unemployment by race in 2022
- Unemployment rate for White non-Hispanic residents
- 5.9%Males
- 1.9%Females
- Unemployment rate for two or more race residents
- 13.2%Females
- Unemployment rate for Hispanic or Latino residents
- 6.3%Females

- Year of entry for the foreign-born population in Bull Valley, Illinois
- 172010 or later
- 102000 to 2009
- 141990 to 1999
- 01980 to 1989
- 101970 to 1979
- 14Before 1970

First ancestries reported:
- German: 88 (17.6%)
- Irish: 67 (13.4%)
- American: 44 (8.8%)
- English: 37 (7.4%)
- Polish: 27 (5.4%)
- Greek: 16 (3.2%)
- Croatian: 14 (2.8%)
- Ukrainian: 13 (2.6%)
- Italian: 11 (2.2%)
- Northern European: 10 (2.0%)
- European: 7 (1.4%)
- French: 7 (1.4%)
- Scotch-Irish: 7 (1.4%)
- Czech: 5 (1.0%)
- Lebanese: 4 (0.8%)
- Swedish: 4 (0.8%)
- Swiss: 4 (0.8%)
- Scottish: 3 (0.6%)
- Dutch: 2 (0.4%)
- Russian: 2 (0.4%)
- Scandinavian: 2 (0.4%)
- British: 1 (0.2%)
Most common places of birth for foreign-born residents (%):
| Bull Valley: | 19.8% (24) |
| Illinois: | 34.7% (626,958) |
| Bull Valley: | 13.2% (16) |
| Illinois: | 1.2% (22,269) |
| Bull Valley: | 11.6% (14) |
| Illinois: | 0.2% (3,977) |
| Bull Valley: | 8.3% (10) |
| Illinois: | 5.2% (93,003) |
| Bull Valley: | 7.4% (9) |
| Illinois: | 0.3% (6,186) |
| Bull Valley: | 5.0% (6) |
| Illinois: | 0.2% (3,256) |
| Bull Valley: | 5.0% (6) |
| Illinois: | 6.9% (124,474) |
| Bull Valley: | 3.3% (4) |
| Illinois: | 1.6% (29,316) |
| Bull Valley: | 3.3% (4) |
| Illinois: | 0.5% (8,551) |
| Bull Valley: | 2.5% (3) |
| Illinois: | 0.1% (1,361) |
| Bull Valley: | 1.7% (2) |
| Illinois: | 0.1% (1,168) |
| Bull Valley: | 1.7% (2) |
| Illinois: | 0.5% (8,235) |
| Bull Valley: | 1.7% (2) |
| Illinois: | 1.0% (18,753) |
| Bull Valley: | 1.7% (2) |
| Illinois: | 2.2% (40,393) |
| Bull Valley: | 1.7% (2) |
| Illinois: | 1.1% (19,306) |
Place of birth for U.S.-born residents:
- This state: 840
- Other state: 273
- Northeast: 23
- Midwest: 128
- South: 65
- West: 52
94.3% of Bull Valley residents lived in the same house 1 years ago.
Out of people who lived in different houses, 26.0% lived in this county.
Out of people who lived in different counties, 36.1% lived in Illinois.
| Bull Valley: | 94.3% |
| State average: | 88.3% |
Education attainment for males 25 years and older:
- No schooling: 0
- Nursery to 4th grade: 0
- 5th and 6th grade: 0
- 7th and 8th grade: 7
- 9th grade: 0
- 10th grade: 0
- 11th grade: 3
- 12th grade, no diploma: 0
- High school graduate (or equivalency): 35
- Less than 1 year of college: 11
- Some college more than 1 year, no degree: 102
- Associate degree: 27
- Bachelor's degree: 236
- Master's degree: 54
- Professional school degree: 14
- Doctorate degree: 4

Education attainment for females 25 years and older:
- No schooling: 0
- Nursery to 4th grade: 0
- 5th and 6th grade: 0
- 7th and 8th grade: 0
- 9th grade: 0
- 10th grade: 8
- 11th grade: 5
- 12th grade, no diploma: 0
- High school graduate (or equivalency): 97
- Less than 1 year of college: 46
- Some college more than 1 year, no degree: 106
- Associate degree: 2
- Bachelor's degree: 171
- Master's degree: 87
- Professional school degree: 10
- Doctorate degree: 5


Housing units in structures:
- One, detached: 536
- One, attached: 10
Housing units lacking complete kitchen facilities in 2022: 0.6%
House/condo owner moved in on average 16 years ago
Renter moved in on average 7 years ago

- 96.2%Utility gas
- 3.4%Electricity
- 0.4%Bottled, tank, or LP gas
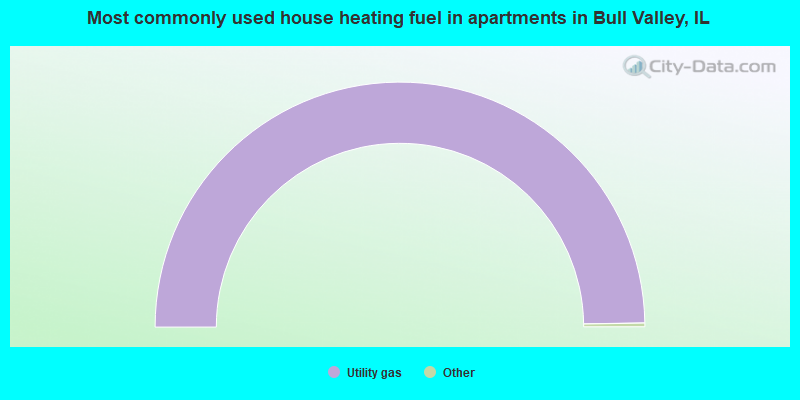
- 100.0%Utility gas
Private vs. public school enrollment:
| Here: | 0.0% |
| Illinois: | 13.3% |
| Here: | 18.9% |
| Illinois: | 9.9% |
| Here: | 23.5% |
| Illinois: | 27.4% |


