Burlington, MA (Massachusetts) Houses and Residents
| Burlington: | $696,185 |
| Massachusetts: | $534,700 |
Mean price in 2022:
Detached houses: $727,507
Here: $727,507 State: $651,570 Townhouses or other attached units: $605,527
Here: $605,527 State: $617,749 In 2-unit structures: $418,027
Here: $418,027 State: $594,808 In 3-to-4-unit structures: $491,297
Here: $491,297 State: $601,912 In 5-or-more-unit structures: $606,730
Here: $606,730 State: $555,768
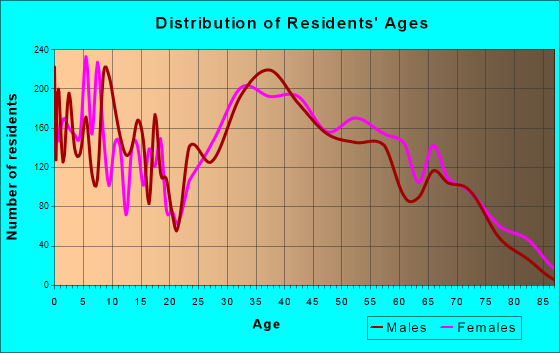
Total population: 24,498 (Urban population: 22,876, Rural population: 0)
Houses: 10,732 (10,202 occupied: 7,489 owner occupied, 2,704 renter occupied)
| % of renters here: | 27% |
| State: | 38% |
Housing density: 908 houses/condos per square mile
Median price asked for vacant for-sale houses and condos in 2022: $835,722.
Median contract rent in 2022: over $2,000 (lower quartile is $1,616, upper quartile is over $2,000)
Median rent asked for vacant for-rent units in 2022: $4,750
Median gross rent in Burlington, MA in 2022: over $2,000
Housing units in Burlington with a mortgage: 4,385 (704 second mortgage, 5 home equity loan, 613 both second mortgage and home equity loan)
Houses without a mortgage: 165
Median household income for houses/condos with a mortgage: $168,628
Median household income for apartments without a mortgage: $101,989
Median monthly housing costs: $2,178
Compare current foreclosures near Burlington, MA:
| Photo | Address | Area | Beds / Baths | Price | Details |
|---|---|---|---|---|---|

|
#1
Upland Rd
Burlington, MA 01803
|
1,428 sq. feet
|
1 baths 3 beds |
show details | |

|
#2
Richardson Rd # 24
Burlington, MA 01803
|
1,788 sq. feet
|
2 baths 2 beds |
show details | |

|
#3
Kinney Ave
Burlington, MA 01803
|
2,676 sq. feet
|
3 baths 5 beds |
show details | |

|
#4
Sandra Ave
Burlington, MA 01803
|
2,955 sq. feet
|
2 baths 4 beds |
show details | |

|
#5
Skilton Ln
Burlington, MA 01803
|
2,880 sq. feet
|
2 baths 5 beds |
show details | |

|
#6
Washington Ave
Burlington, MA 01803
|
3,811 sq. feet
|
2 baths 4 beds |
show details | |

|
#7
Crawford Rd
Burlington, MA 01803
|
2,794 sq. feet
|
4 baths 5 beds |
show details | |

|
#8
Hancock St
Burlington, MA 01803
|
3,744 sq. feet
|
3 baths 4 beds |
show details | |

|
#9
Seven Springs Ln
Burlington, MA 01803
|
1,844 sq. feet
|
2 baths 2 beds |
show details | |

|
#10
Cambridge St Apt 7
Burlington, MA 01803
|
- sq. feet
|
- baths - beds |
show details |
| Photo | Address | Area | Beds / Baths | Price | Details |
|---|---|---|---|---|---|

|
#11
Baron Park Ln Apt 16
Burlington, MA 01803
|
- sq. feet
|
- baths - beds |
show details | |

|
#12
Cambridge St
Burlington, MA 01803
|
- sq. feet
|
- baths - beds |
show details | |

|
#13
District Ave
Burlington, MA 01803
|
- sq. feet
|
- baths - beds |
show details | |

|
#14
District Ave
Burlington, MA 01803
|
- sq. feet
|
- baths - beds |
show details | |

|
#15
Maple St
Tewksbury, MA 01876
|
1,748 sq. feet
|
1 baths 4 beds |
$379,900
|
show details |

|
#16
Commonwealth Ave Apt B
Boston, MA 02116
|
- sq. feet
|
1 baths 2 beds |
$684,900
|
show details |

|
#17
Portland St
Lynn, MA 01902
|
851 sq. feet
|
2 baths 2 beds |
show details | |

|
#18
Church St
Boston, MA 02122
|
3,663 sq. feet
|
3 baths 6 beds |
show details | |

|
#19
Brahms St
Roslindale, MA 02131
|
1,604 sq. feet
|
1 baths 4 beds |
show details | |

|
#20
College Farm Rd
Waltham, MA 02451
|
879 sq. feet
|
1 baths 2 beds |
show details |
| Photo | Address | Area | Beds / Baths | Price | Details |
|---|---|---|---|---|---|

|
#21
Atlantic Street, Unit A 10 A/k/a Unit 10, Marilyn Condominium
Lynn, MA 01902
|
576 sq. feet
|
1 baths 1 beds |
show details | |

|
#22
Schaefer Cir
Hudson, NH 03051
|
4,358 sq. feet
|
3 baths 5 beds |
show details | |

|
#23
Magnolia St
Boston, MA 02125
|
3,654 sq. feet
|
3 baths 6 beds |
show details | |

|
#24
Woodbury Rd
Billerica, MA 01821
|
1,680 sq. feet
|
2 baths 3 beds |
show details | |

|
#25
Bloomfield St
Boston, MA 02124
|
2,667 sq. feet
|
2 baths 6 beds |
show details | |

|
#26
Salem Rd
Billerica, MA 01821
|
1,428 sq. feet
|
1 baths 4 beds |
show details | |

|
#27
Emily Rd
Tewksbury, MA 01876
|
1,600 sq. feet
|
1 baths 3 beds |
show details | |

|
#28
Gordon St
Allston, MA 02134
|
3,246 sq. feet
|
2 baths 5 beds |
show details | |

|
#29
3rd Ave
North Chelmsford, MA 01863
|
- sq. feet
|
1 baths 2 beds |
show details | |

|
#30
Deer Path Apt 5
Maynard, MA 01754
|
1,540 sq. feet
|
1 baths 2 beds |
show details |
| Photo | Address | Area | Beds / Baths | Price | Details |
|---|---|---|---|---|---|

|
#31
Marks Way
Maynard, MA 01754
|
2,596 sq. feet
|
2 baths 4 beds |
show details | |

|
#32
Baker St
West Roxbury, MA 02132
|
2,614 sq. feet
|
3 baths 4 beds |
show details | |

|
#33
Iroquois St
Boston, MA 02120
|
2,524 sq. feet
|
1 baths 4 beds |
show details | |

|
#34
Salem St
North Andover, MA 01845
|
1,572 sq. feet
|
1 baths 2 beds |
show details | |

|
#35
S Broadway
Lawrence, MA 01843
|
5,706 sq. feet
|
2 baths 6 beds |
show details | |

|
#36
Thornton St
Lawrence, MA 01841
|
912 sq. feet
|
1 baths 2 beds |
show details | |

|
#37
Lincoln Ave
Saugus, MA 01906
|
1,080 sq. feet
|
1 baths 3 beds |
show details | |

|
#38
Lyons St
Lowell, MA 01852
|
1,314 sq. feet
|
1 baths 2 beds |
show details | |

|
#39
Carlisle St
Lowell, MA 01852
|
1,913 sq. feet
|
1 baths 5 beds |
show details | |

|
#40
Marden Ave # 6
Boston, MA 02124
|
1,639 sq. feet
|
1 baths 3 beds |
show details |
| Photo | Address | Area | Beds / Baths | Price | Details |
|---|---|---|---|---|---|

|
#41
Merrill Ave
Lynn, MA 01902
|
1,136 sq. feet
|
1 baths 3 beds |
show details | |

|
#42
Margin Street
Lynn, MA 01905
|
1,240 sq. feet
|
2 baths 2 beds |
show details | |

|
#43
Cora St
Winthrop, MA 02152
|
1,452 sq. feet
|
1 baths 2 beds |
show details | |

|
#44
Boston Rd
Chelmsford, MA 01824
|
1,392 sq. feet
|
1 baths 3 beds |
show details | |

|
#45
Forest Park Rd
Woburn, MA 01801
|
1,132 sq. feet
|
1 baths 3 beds |
show details | |

|
#46
Essex St
Swampscott, MA 01907
|
2,029 sq. feet
|
2 baths 3 beds |
show details | |

|
#47
E 7th St
Boston, MA 02127
|
1,827 sq. feet
|
1 baths 4 beds |
show details | |

|
#48
Dalton St
Lowell, MA 01850
|
3,494 sq. feet
|
2 baths 4 beds |
show details | |

|
#49
Pawtucket Boulevard Unit # 7, Bldg 6 Camelot Court Condominium No. 1)
Lowell, MA Array
|
883 sq. feet
|
1 baths 2 beds |
show details | |

|
Check over 1 million property listings on Foreclosure.com!
|
browse all offers | |||

Latest news about housing in Burlington, MA collected exclusively by city-data.com from local newspapers, TV, and radio stations

 | How Much Massachusetts Households Make Per Year: Census Data (37 replies) |
| household income map of Boston area (75 replies) |
| Is it ok to buy new construction homes? (32 replies) |
| Billerica Houses (47 replies) |
| Current Mansfield, MA residents seeking a more exciting place to call home. Berkshires? Rhode Island? Help! (133 replies) |
| 2023 Real Estate Observations (5278 replies) |
Median year apartment built: 2002
Household type by relationship:
Households: 26,072- Male householders: 4,721 (770 living alone), Female householders: 5,300 (1,410 living alone)
5,982 spouses (5,941 opposite-sex spouses), 643 unmarried partners, (630 opposite-sex unmarried partners), 7,517 children (7,355 natural, 109 adopted, 51 stepchildren), 507 grandchildren, 91 brothers or sisters, 335 parents, 0 foster children, 287 other relatives, 472 non-relatives
- In group quarters: 212
Size of family households: 3,082 2-persons, 1,829 3-persons, 1,433 4-persons, 345 5-persons, 317 6-persons, 144 7-or-more-persons.
Size of nonfamily households: 2,273 1-person, 747 2-persons, 21 3-persons, 23 4-persons, 17 5-persons.
4,024 married couples with children.
390 single-parent households (0 men, 390 women).
78.0% of residents of Burlington speak English at home.
1.7% of residents speak Spanish at home (60% speak English very well, 3% speak English well, 37% speak English not well).
12.6% of residents speak other Indo-European language at home (78% speak English very well, 14% speak English well, 5% speak English not well, 2% don't speak English at all).
5.9% of residents speak Asian or Pacific Island language at home (78% speak English very well, 16% speak English well, 6% speak English not well).
1.7% of residents speak other language at home (75% speak English very well, 17% speak English well, 8% speak English not well).
Foreign born population: 5,219 (20.0%)
(57.0% of them are naturalized citizens)
| Here: | 7.0 |
| State: | 6.5 |
| Here: | 3.4 |
| State: | 4.0 |

- Bedrooms in owner-occupied houses and condos in Burlington, Massachusetts
- 12no bedroom
- 1571 bedroom
- 7432 bedrooms
- 3,7403 bedrooms
- 2,2694 bedrooms
- 5685+ bedrooms

- Bedrooms in renter-occupied apartments in Burlington, Massachusetts
- 211no bedroom
- 8171 bedroom
- 1,2402 bedrooms
- 2933 bedrooms
- 704 bedrooms
- 745+ bedrooms

- Cars and other vehicles available in Burlington in owner-occupied houses/condos
- 76no vehicle
- 1,5751 vehicle
- 3,8162 vehicles
- 1,3053 vehicles
- 4684 vehicles
- 2485+ vehicles

- Cars and other vehicles available in Burlington in renter-occupied apartments
- 266no vehicle
- 1,4841 vehicle
- 8152 vehicles
- 533 vehicles
- 604 vehicles
- 285+ vehicles

- Rooms in owner-occupied houses in Burlington, Massachusetts
- 121 room
- 02 rooms
- 1703 rooms
- 4214 rooms
- 8395 rooms
- 1,6506 rooms
- 1,2797 rooms
- 1,5098 rooms
- 1,6099+ rooms

- Rooms in renter-occupied apartments in Burlington, Massachusetts
- 1901 room
- 3692 rooms
- 8793 rooms
- 6744 rooms
- 2475 rooms
- 696 rooms
- 1857 rooms
- 188 rooms
- 749+ rooms


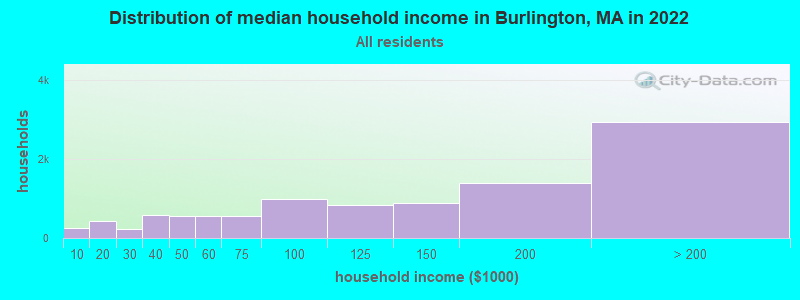
Burlington, MA household income distribution

- 244Less than $10,000
- 440$10,000 to $19,999
- 234$20,000 to $29,999
- 570$30,000 to $39,999
- 548$40,000 to $49,999
- 562$50,000 to $59,999
- 556$60,000 to $74,999
- 981$75,000 to $99,999
- 836$100,000 to $124,999
- 880$125,000 to $149,999
- 1,392$150,000 to $199,999
- 2,936$200,000 or more
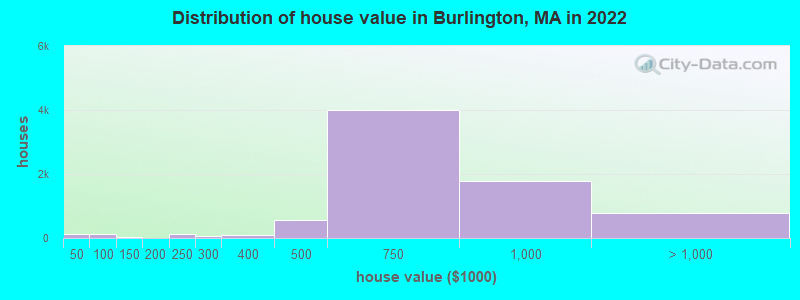
Home value of owner - occupied houses in 2022 in Burlington, MA
-
- 23Less than $10,000
- 26$20,000 to $24,999
- 38$25,000 to $29,999
- 16$30,000 to $34,999
- 19$40,000 to $49,999
- 40$60,000 to $69,999
- 80$70,000 to $79,999
- 21$100,000 to $124,999
- 9$150,000 to $174,999
- 112$200,000 to $249,999
- 54$250,000 to $299,999
- 100$300,000 to $399,999
- 548$400,000 to $499,999
- 3,985$500,000 to $749,999
- 1,771$750,000 to $999,999
- 745$1,000,000 to $1,499,999
- 42$1,500,000 to $1,999,999
Rent paid by renters in 2022 in Burlington, MA
-
- 23$200 to $249
- 15$250 to $299
- 68$300 to $349
- 20$350 to $399
- 13$450 to $499
- 12$550 to $599
- 19$650 to $699
- 10$750 to $799
- 6$800 to $899
- 30$900 to $999
- 38$1,000 to $1,249
- 258$1,250 to $1,499
- 574$1,500 to $1,999
- 541$2,000 to $2,499
- 419$2,500 to $2,999
- 331$3,000 to $3,499
- 186$3,500 or more
- 101No cash rent


Percentage of workers working in this county: 79.6%
Number of people working at home: 3,118 (22.7% of all workers)
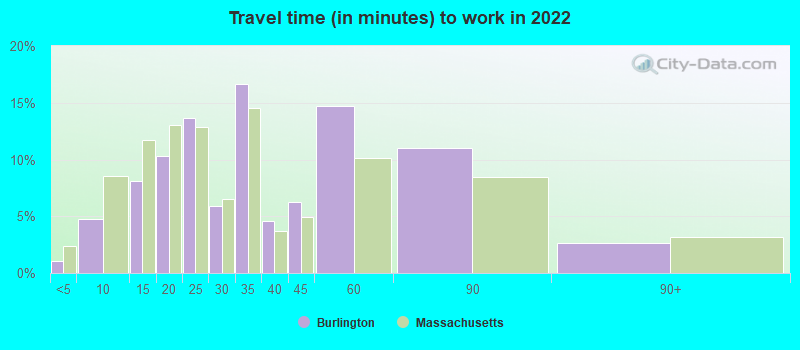
Travel time to work (commute)
- Less than 5 minutes: 210
- 5 to 9 minutes: 1,018
- 10 to 14 minutes: 1,300
- 15 to 19 minutes: 1,491
- 20 to 24 minutes: 1,162
- 25 to 29 minutes: 801
- 30 to 34 minutes: 1,592
- 35 to 39 minutes: 324
- 40 to 44 minutes: 418
- 45 to 59 minutes: 1,014
- 60 to 89 minutes: 928
- 90 or more minutes: 257
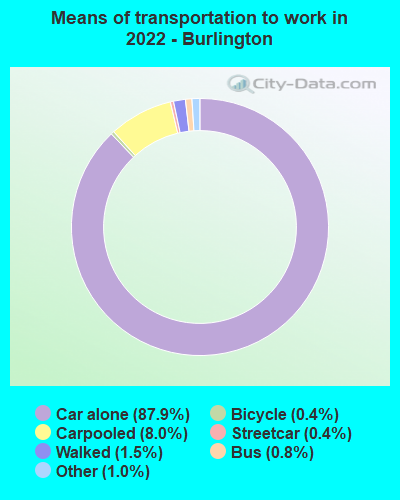
Means of transportation to work:
- Drove a car alone: 29,120 (76.6%)
- Carpooled: 2,780 (7.3%)
- Bus: 219 (0.6%)
- Subway or elevated rail: 138 (0.4%)
- Long-distance train or commuter rail: 9 (0.0%)
- Taxi: 413 (1.1%)
- Bicycle: 170 (0.4%)
- Walked: 500 (1.3%)
- Worked at home: 3,118 (8.2%)

- Unemployment by race in 2022
- Unemployment rate for White non-Hispanic residents
- 2.0%Males
- 1.7%Females
- Unemployment rate for Asian residents
- 0.7%Males
- 4.2%Females
- Unemployment rate for two or more race residents
- 1.2%Males
- 13.4%Females
- Unemployment rate for Hispanic or Latino residents
- 16.3%Males

- Year of entry for the foreign-born population in Burlington, Massachusetts
- 1,9982010 or later
- 1,1432000 to 2009
- 6081990 to 1999
- 7171980 to 1989
- 4401970 to 1979
- 683Before 1970

First ancestries reported:
- Irish: 1,783 (14.3%)
- Italian: 1,590 (12.8%)
- American: 897 (7.2%)
- English: 720 (5.8%)
- Greek: 569 (4.6%)
- Armenian: 503 (4.0%)
- Albanian: 209 (1.7%)
- Portuguese: 186 (1.5%)
- Polish: 154 (1.2%)
- French Canadian: 137 (1.1%)
- Scottish: 114 (0.9%)
- German: 94 (0.8%)
- Norwegian: 87 (0.7%)
- Canadian: 81 (0.7%)
- Ugandan: 81 (0.7%)
- Romanian: 72 (0.6%)
- Syrian: 70 (0.6%)
- Ukrainian: 70 (0.6%)
- African: 59 (0.5%)
- Russian: 58 (0.5%)
- Swedish: 49 (0.4%)
- French: 44 (0.4%)
- Arab: 34 (0.3%)
- Turkish: 33 (0.3%)
- European: 29 (0.2%)
- Hungarian: 25 (0.2%)
- Haitian: 25 (0.2%)
- Egyptian: 23 (0.2%)
- Finnish: 20 (0.2%)
- Welsh: 17 (0.1%)
- Lebanese: 14 (0.1%)
- Eastern European: 13 (0.1%)
- Scotch-Irish: 12 (0.10%)
- British: 12 (0.10%)
- Slovak: 10 (0.08%)
- Brazilian: 9 (0.07%)
- Austrian: 7 (0.06%)
- Scandinavian: 6 (0.05%)
- Lithuanian: 6 (0.05%)
Most common places of birth for foreign-born residents (%):
| Burlington: | 34.2% (1,786) |
| Massachusetts: | 6.8% (82,934) |
| Burlington: | 6.2% (323) |
| Massachusetts: | 0.6% (7,064) |
| Burlington: | 4.8% (252) |
| Massachusetts: | 1.1% (13,076) |
| Burlington: | 4.3% (226) |
| Massachusetts: | 0.4% (5,099) |
| Burlington: | 3.6% (186) |
| Massachusetts: | 8.4% (103,233) |
| Burlington: | 3.0% (159) |
| Massachusetts: | 2.3% (28,158) |
| Burlington: | 2.9% (153) |
| Massachusetts: | 1.4% (17,613) |
| Burlington: | 2.4% (123) |
| Massachusetts: | 0.9% (10,698) |
| Burlington: | 2.3% (120) |
| Massachusetts: | 0.8% (10,043) |
| Burlington: | 2.1% (112) |
| Massachusetts: | 4.1% (50,360) |
| Burlington: | 2.0% (103) |
| Massachusetts: | 1.0% (12,709) |
| Burlington: | 1.9% (99) |
| Massachusetts: | 0.6% (7,555) |
| Burlington: | 1.9% (98) |
| Massachusetts: | 8.3% (101,767) |
| Burlington: | 1.6% (82) |
| Massachusetts: | 2.7% (32,733) |
Place of birth for U.S.-born residents:
- This state: 16,647
- Other state: 3,697
- Northeast: 2,037
- Midwest: 454
- South: 796
- West: 413
90.9% of Burlington residents lived in the same house 1 years ago.
Out of people who lived in different houses, 28.9% lived in this county.
Out of people who lived in different counties, 65.1% lived in Massachusetts.
| Burlington: | 90.9% |
| State average: | 87.7% |
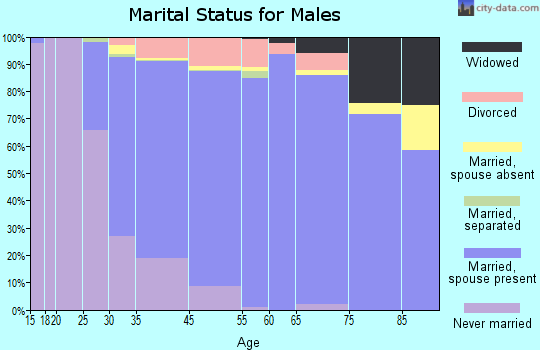
Education attainment for males 25 years and older:
- No schooling: 86
- Nursery to 4th grade: 57
- 5th and 6th grade: 8
- 7th and 8th grade: 1
- 9th grade: 25
- 10th grade: 44
- 11th grade: 8
- 12th grade, no diploma: 90
- High school graduate (or equivalency): 1,841
- Less than 1 year of college: 242
- Some college more than 1 year, no degree: 646
- Associate degree: 372
- Bachelor's degree: 3,419
- Master's degree: 1,504
- Professional school degree: 113
- Doctorate degree: 514

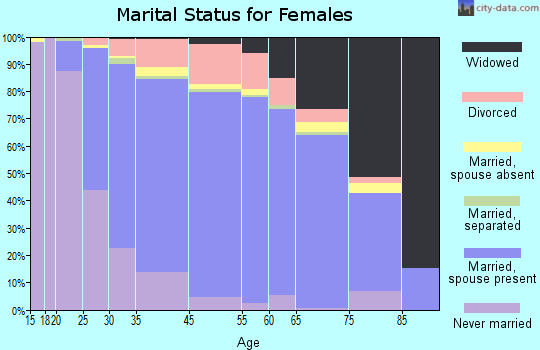
Education attainment for females 25 years and older:
- No schooling: 81
- Nursery to 4th grade: 57
- 5th and 6th grade: 30
- 7th and 8th grade: 17
- 9th grade: 49
- 10th grade: 12
- 11th grade: 36
- 12th grade, no diploma: 33
- High school graduate (or equivalency): 1,882
- Less than 1 year of college: 552
- Some college more than 1 year, no degree: 741
- Associate degree: 901
- Bachelor's degree: 3,197
- Master's degree: 1,835
- Professional school degree: 460
- Doctorate degree: 254

Housing units in structures:
- One, detached: 7,422
- One, attached: 347
- Two: 130
- 3 or 4: 59
- 5 to 9: 637
- 10 to 19: 368
- 20 to 49: 969
- 50 or more: 788
- Mobile homes: 7
Housing units lacking complete kitchen facilities in 2022: 1.5%
House/condo owner moved in on average 21 years ago
Renter moved in on average 1 years ago

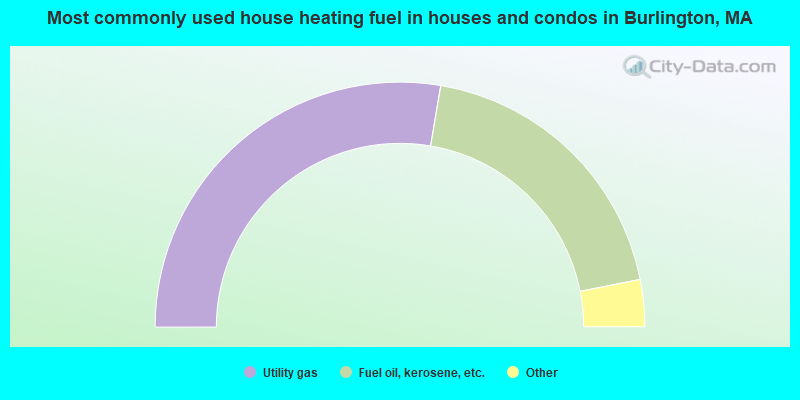
- 55.4%Utility gas
- 38.5%Fuel oil, kerosene, etc.
- 3.5%Electricity
- 2.4%Bottled, tank, or LP gas
- 0.2%Other fuel
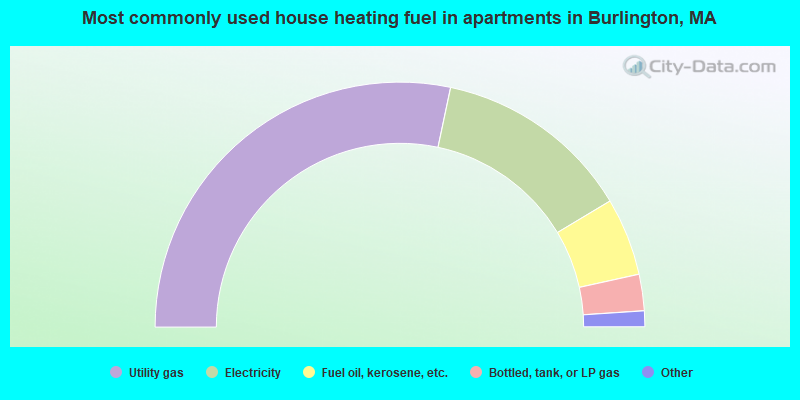
- 56.7%Utility gas
- 26.2%Electricity
- 10.3%Fuel oil, kerosene, etc.
- 4.8%Bottled, tank, or LP gas
- 1.5%No fuel used
- 0.6%Other fuel
Private vs. public school enrollment:
| Here: | 9.1% |
| Massachusetts: | 10.3% |
| Here: | 1.7% |
| Massachusetts: | 12.3% |
| Here: | 16.7% |
| Massachusetts: | 51.2% |


