Burton, SC (South Carolina) Houses and Residents
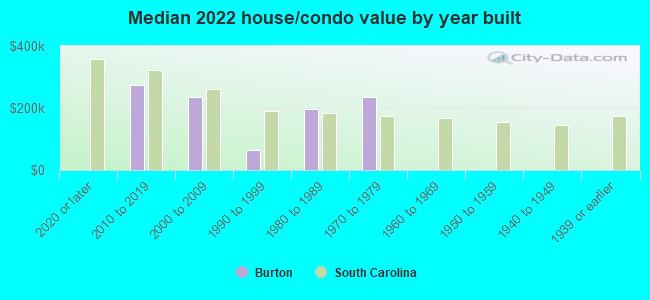
| Burton: | $231,906 |
| South Carolina: | $254,600 |
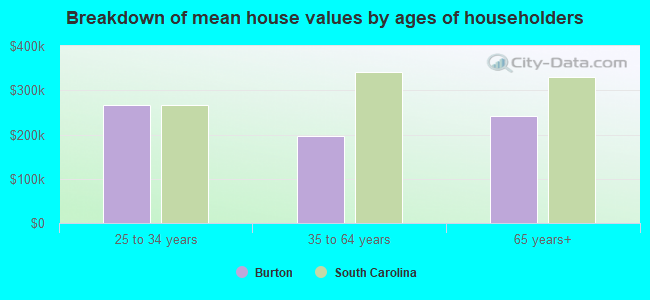
Mean price in 2022:
Detached houses: $248,135
Here: $248,135 State: $368,255 Mobile homes: $76,290
Here: $76,290 State: $102,531
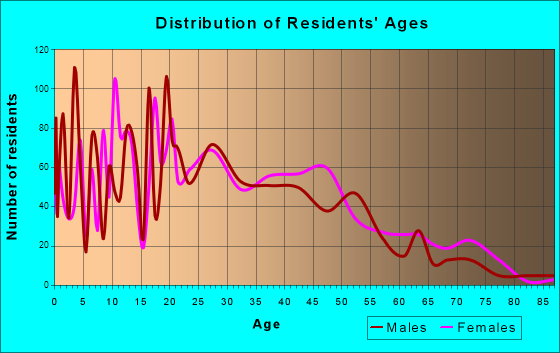
Total population: 6,976 (All urban)
Houses: 3,114 (2,738 occupied: 1,497 owner occupied, 1,280 renter occupied)
| % of renters here: | 46% |
| State: | 28% |
Housing density: 282 houses/condos per square mile
Median price asked for vacant for-sale houses and condos in 2022 in this county: $379,761.
Median contract rent in 2022: $939 (lower quartile is $691, upper quartile is $1,275)
Median rent asked for vacant for-rent units in 2022: $9,738
Median gross rent in Burton, SC in 2022: $1,186
Housing units in Burton with a mortgage: 919 (4 second mortgage, 0 home equity loan, 0 both second mortgage and home equity loan)
Houses without a mortgage: 0
Median household income for houses/condos with a mortgage: $72,965
Median household income for apartments without a mortgage: $60,219
Median monthly housing costs: $1,029
Compare current foreclosures near Burton, SC:
| Photo | Address | Area | Beds / Baths | Price | Details |
|---|---|---|---|---|---|

|
#1
St
Beaufort, SC 29902
|
- sq. feet
|
1 baths 3 beds |
show details | |

|
#2
Chesterfield Dr
Beaufort, SC 29906
|
1,601 sq. feet
|
2 baths 3 beds |
show details | |

|
#3
Ceasar Pl
Hilton Head Island, SC 29926
|
2,090 sq. feet
|
2 baths 4 beds |
show details | |

|
#4
Lake Linden Dr
Bluffton, SC 29910
|
1,288 sq. feet
|
2 baths 1 beds |
show details | |

|
#5
Island Pines Dr
Port Royal, SC 29935
|
1,088 sq. feet
|
2 baths 2 beds |
show details | |

|
#6
Pelican Cir
Beaufort, SC 29906
|
1,161 sq. feet
|
2 baths 3 beds |
show details | |

|
#7
Whitfield Ln
Saint Helena Island, SC 29920
|
1,780 sq. feet
|
1 baths 3 beds |
show details | |

|
#8
West Sq
Bluffton, SC 29910
|
1,024 sq. feet
|
1 baths 2 beds |
show details | |

|
#9
Cedar Point Dr
Ladys Island, SC 29907
|
1,120 sq. feet
|
1 baths 2 beds |
show details | |

|
#10
Fish Haul Rd
Hilton Head Island, SC 29926
|
956 sq. feet
|
1 baths 2 beds |
show details |
| Photo | Address | Area | Beds / Baths | Price | Details |
|---|---|---|---|---|---|

|
#11
Dowlingwood Dr
Beaufort, SC 29902
|
2,913 sq. feet
|
2 baths 3 beds |
show details | |

|
#12
Francis Marion Cir
Ladys Island, SC 29907
|
3,086 sq. feet
|
3 baths 4 beds |
show details | |

|
#13
Cypress St
Beaufort, SC 29906
|
1,524 sq. feet
|
2 baths 3 beds |
show details | |

|
#14
Battery Creek Rd
Beaufort, SC 29902
|
1,115 sq. feet
|
2 baths 3 beds |
show details | |

|
#15
Southside Blvd
Beaufort, SC 29902
|
1,476 sq. feet
|
2 baths 3 beds |
show details | |

|
#16
Hidden Lakes Cir
Bluffton, SC 29910
|
2,298 sq. feet
|
2 baths 3 beds |
show details | |

|
#17
Seaside Rd
Saint Helena Island, SC 29920
|
1,422 sq. feet
|
1 baths 3 beds |
show details | |

|
#18
Southern Magnolia Dr
Ladys Island, SC 29907
|
1,244 sq. feet
|
2 baths 3 beds |
show details | |

|
#19
Spanish Point Dr
Beaufort, SC 29902
|
3,487 sq. feet
|
2 baths 3 beds |
show details | |

|
#20
Jillfer Ln
Bluffton, SC 29910
|
1,708 sq. feet
|
2 baths 3 beds |
show details |
| Photo | Address | Area | Beds / Baths | Price | Details |
|---|---|---|---|---|---|

|
#21
Marquis Way
Ladys Island, SC 29907
|
2,114 sq. feet
|
2 baths 3 beds |
show details | |

|
#22
Ceasar Pl
Hilton Head Island, SC 29926
|
2,090 sq. feet
|
3 baths 3 beds |
show details | |

|
#23
Jenkins Rd
Yemassee, SC 29945
|
672 sq. feet
|
1 baths 3 beds |
show details | |

|
#24
Fairlawn Ct
Hilton Head Island, SC 29926
|
3,678 sq. feet
|
3 baths 4 beds |
show details | |

|
#25
Charles St # A
Beaufort, SC 29902
|
1,530 sq. feet
|
1 baths 2 beds |
show details | |

|
#26
Scott St
Beaufort, SC 29902
|
1,280 sq. feet
|
1 baths 3 beds |
show details | |

|
#27
Clarendon Rd
Beaufort, SC 29906
|
864 sq. feet
|
1 baths 1 beds |
show details | |

|
#28
Hilda Ave
Ladys Island, SC 29907
|
1,516 sq. feet
|
2 baths 3 beds |
show details | |

|
#29
Jeter Rd
Beaufort, SC 29906
|
1,276 sq. feet
|
2 baths 4 beds |
show details | |

|
#30
Pickens St
Ladys Island, SC 29907
|
1,806 sq. feet
|
2 baths 3 beds |
show details |
| Photo | Address | Area | Beds / Baths | Price | Details |
|---|---|---|---|---|---|

|
#31
Cross Rd
Bluffton, SC 29910
|
1,642 sq. feet
|
2 baths 3 beds |
show details | |

|
#32
Centerview Dr
Beaufort, SC 29902
|
1,152 sq. feet
|
1 baths 3 beds |
show details | |

|
#33
Heartstone Cir
Bluffton, SC 29910
|
1,636 sq. feet
|
2 baths 3 beds |
show details | |

|
#34
Middlefield Cir
Seabrook, SC 29940
|
1,388 sq. feet
|
1 baths 3 beds |
show details | |

|
#35
Mamie Frazier Ln
Beaufort, SC 29906
|
1,212 sq. feet
|
1 baths 3 beds |
show details | |

|
#36
Stoney Xing
Bluffton, SC 29910
|
1,704 sq. feet
|
2 baths 3 beds |
show details | |

|
#37
Mary Elizabeth Dr
Ladys Island, SC 29907
|
1,186 sq. feet
|
2 baths 3 beds |
show details | |

|
#38
Stuart Point Rd
Seabrook, SC 29940
|
- sq. feet
|
- baths 1 beds |
show details | |

|
#39
Castle Rock Rd
Beaufort, SC 29906
|
840 sq. feet
|
1 baths 4 beds |
show details | |

|
#40
Cotton Field Ln W
Bluffton, SC 29910
|
1,761 sq. feet
|
2 baths 3 beds |
show details |
| Photo | Address | Area | Beds / Baths | Price | Details |
|---|---|---|---|---|---|

|
#41
Broad River Blvd
Beaufort, SC 29906
|
840 sq. feet
|
1 baths 3 beds |
show details | |

|
#42
Christine Dr
Ladys Island, SC 29907
|
1,404 sq. feet
|
2 baths 3 beds |
show details | |

|
#43
Ramsey Rd
Beaufort, SC 29906
|
1,150 sq. feet
|
1 baths 3 beds |
show details | |

|
#44
Scott Hill Rd
Saint Helena Island, SC 29920
|
1,280 sq. feet
|
1 baths 3 beds |
show details | |

|
#45
Pickens St
Ladys Island, SC 29907
|
2,520 sq. feet
|
3 baths 4 beds |
show details | |

|
#46
Red Cedar St
Bluffton, SC 29910
|
1,738 sq. feet
|
2 baths 3 beds |
show details | |

|
#47
Ratel Cir
Beaufort, SC 29902
|
1,770 sq. feet
|
2 baths 3 beds |
show details | |

|
#48
Norris Ave
Bluffton, SC 29910
|
1,372 sq. feet
|
2 baths - beds |
show details | |

|
#49
10th St
Port Royal, SC 29935
|
1,782 sq. feet
|
3 baths - beds |
show details | |

|
Check over 1 million property listings on Foreclosure.com!
|
browse all offers | |||

Latest news about housing in Burton, SC collected exclusively by city-data.com from local newspapers, TV, and radio stations

 | Summer lake home on Lake Greenwood (8 replies) |
| ? Info: Superior Custom Homes in Rock Hill SC? (64 replies) |
| retire to Beaufort or Bluffton (15 replies) |
| Best home values in Beaufort/Bluffton area (2 replies) |
| Very confused. Why is there a Charleston and then a North Charleston? (53 replies) |
| The spill-over effect of Columbia's downtown development boom (111 replies) |
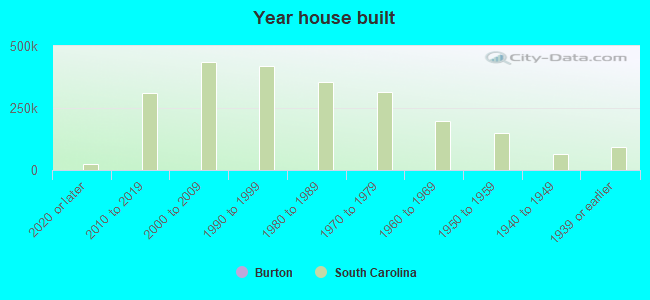
Median year apartment built: 1991
Household type by relationship:
Households: 7,896- Male householders: 1,162 (263 living alone), Female householders: 1,559 (357 living alone)
1,300 spouses (1,300 opposite-sex spouses), 127 unmarried partners, (115 opposite-sex unmarried partners), 2,774 children (2,512 natural, 181 adopted, 79 stepchildren), 329 grandchildren, 61 brothers or sisters, 98 parents, 0 foster children, 241 other relatives, 237 non-relatives
- In group quarters: 3
Size of family households: 785 2-persons, 665 3-persons, 271 4-persons, 128 5-persons, 55 6-persons, 3 7-or-more-persons.
Size of nonfamily households: 695 1-person, 86 2-persons.
920 married couples with children.
584 single-parent households (25 men, 559 women).
82.5% of residents of Burton speak English at home.
12.0% of residents speak Spanish at home (32% speak English very well, 32% speak English well, 36% speak English not well).
0.6% of residents speak other Indo-European language at home (100% speak English very well).
3.7% of residents speak Asian or Pacific Island language at home (49% speak English very well, 30% speak English well, 20% speak English not well).
Foreign born population: 592 (7.5%)
(28.0% of them are naturalized citizens)
| Here: | 6.4 |
| State: | 6.4 |
| Here: | 4.7 |
| State: | 4.5 |
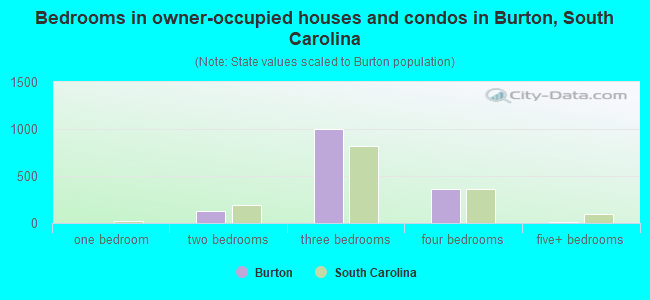
- Bedrooms in owner-occupied houses and condos in Burton, South Carolina
- 0no bedroom
- 01 bedroom
- 1302 bedrooms
- 9953 bedrooms
- 3584 bedrooms
- 145+ bedrooms
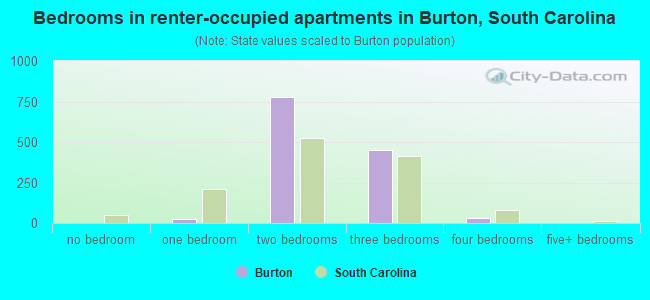
- Bedrooms in renter-occupied apartments in Burton, South Carolina
- 0no bedroom
- 241 bedroom
- 7762 bedrooms
- 4493 bedrooms
- 314 bedrooms
- 05+ bedrooms
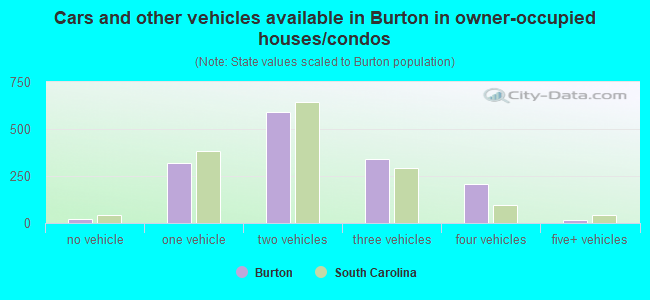
- Cars and other vehicles available in Burton in owner-occupied houses/condos
- 22no vehicle
- 3181 vehicle
- 5912 vehicles
- 3423 vehicles
- 2104 vehicles
- 145+ vehicles
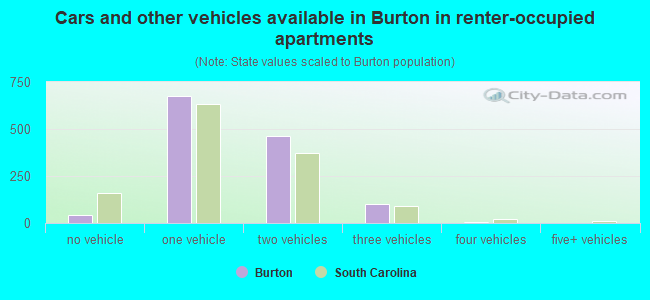
- Cars and other vehicles available in Burton in renter-occupied apartments
- 41no vehicle
- 6761 vehicle
- 4612 vehicles
- 993 vehicles
- 34 vehicles
- 05+ vehicles
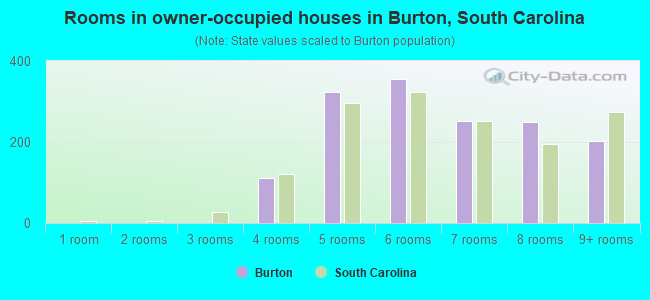
- Rooms in owner-occupied houses in Burton, South Carolina
- 01 room
- 02 rooms
- 03 rooms
- 1124 rooms
- 3245 rooms
- 3556 rooms
- 2537 rooms
- 2508 rooms
- 2029+ rooms
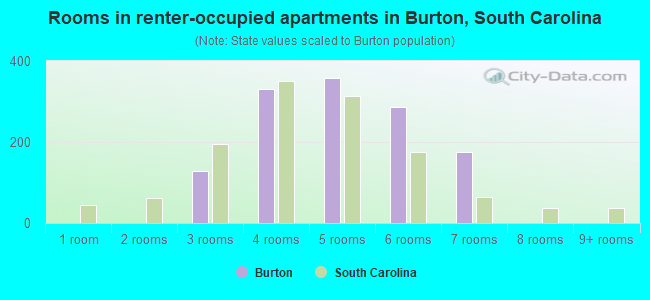
- Rooms in renter-occupied apartments in Burton, South Carolina
- 01 room
- 02 rooms
- 1293 rooms
- 3314 rooms
- 3585 rooms
- 2876 rooms
- 1757 rooms
- 08 rooms
- 09+ rooms
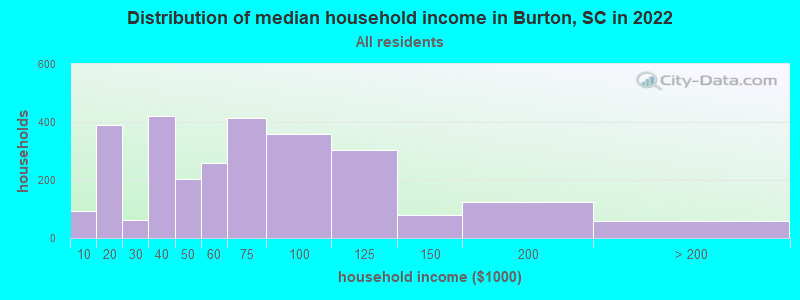
Burton, SC household income distribution

- 93Less than $10,000
- 391$10,000 to $19,999
- 63$20,000 to $29,999
- 422$30,000 to $39,999
- 205$40,000 to $49,999
- 260$50,000 to $59,999
- 415$60,000 to $74,999
- 359$75,000 to $99,999
- 302$100,000 to $124,999
- 81$125,000 to $149,999
- 124$150,000 to $199,999
- 57$200,000 or more
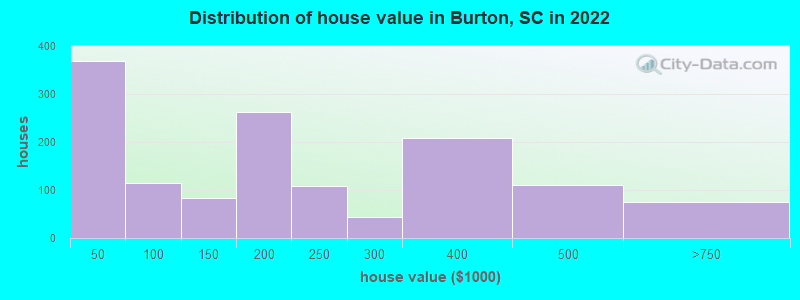
Home value of owner - occupied houses in 2022 in Burton, SC
-
- 138Less than $10,000
- 48$10,000 to $14,999
- 24$15,000 to $19,999
- 19$20,000 to $24,999
- 37$25,000 to $29,999
- 46$30,000 to $34,999
- 53$40,000 to $49,999
- 61$50,000 to $59,999
- 27$100,000 to $124,999
- 56$125,000 to $149,999
- 94$150,000 to $174,999
- 168$175,000 to $199,999
- 107$200,000 to $249,999
- 43$250,000 to $299,999
- 208$300,000 to $399,999
- 109$400,000 to $499,999
- 76$500,000 to $749,999
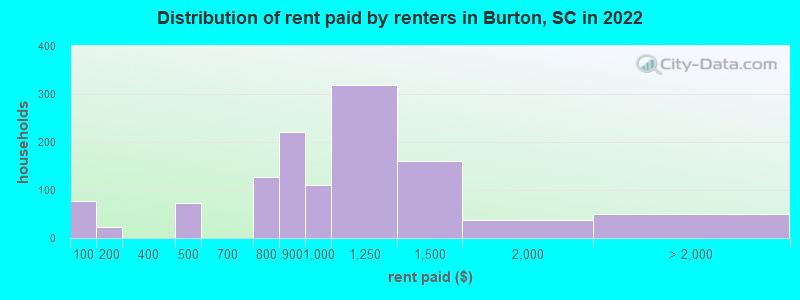
Rent paid by renters in 2022 in Burton, SC
-
- 77Less than $100
- 21$150 to $199
- 19$400 to $449
- 52$450 to $499
- 115$700 to $749
- 12$750 to $799
- 219$800 to $899
- 111$900 to $999
- 318$1,000 to $1,249
- 161$1,250 to $1,499
- 36$1,500 to $1,999
- 51No cash rent
Percentage of workers working in this county: 86.5%
Number of people working at home: 217 (5.9% of all workers)
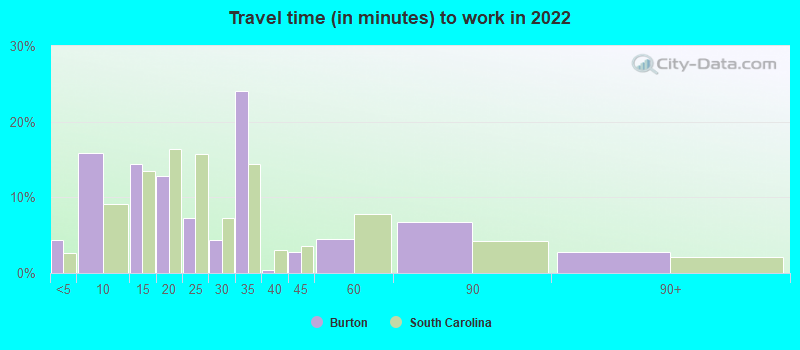
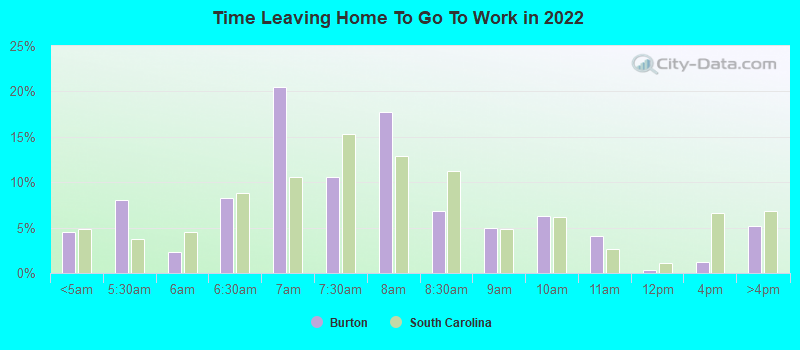
Travel time to work (commute)
- Less than 5 minutes: 99
- 5 to 9 minutes: 363
- 10 to 14 minutes: 136
- 15 to 19 minutes: 716
- 20 to 24 minutes: 389
- 25 to 29 minutes: 276
- 30 to 34 minutes: 748
- 35 to 39 minutes: 104
- 40 to 44 minutes: 35
- 45 to 59 minutes: 126
- 60 to 89 minutes: 203
- 90 or more minutes: 0
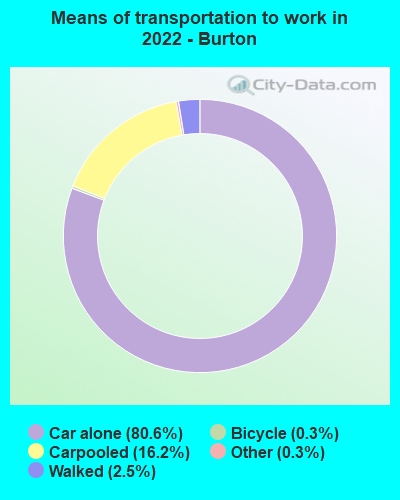
Means of transportation to work:
- Drove a car alone: 1,853 (72.6%)
- Carpooled: 391 (15.3%)
- Taxi: 8 (0.3%)
- Bicycle: 9 (0.4%)
- Walked: 53 (2.1%)
- Worked at home: 217 (8.5%)
- Unemployment by race in 2022
- Unemployment rate for Black residents
- 2.0%Males
- Unemployment rate for two or more race residents
- 58.0%Males
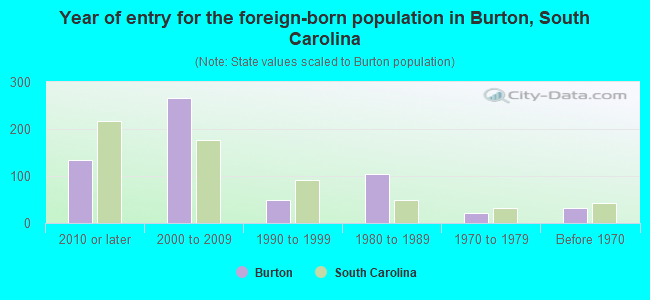
- Year of entry for the foreign-born population in Burton, South Carolina
- 1352010 or later
- 2672000 to 2009
- 491990 to 1999
- 1041980 to 1989
- 221970 to 1979
- 31Before 1970
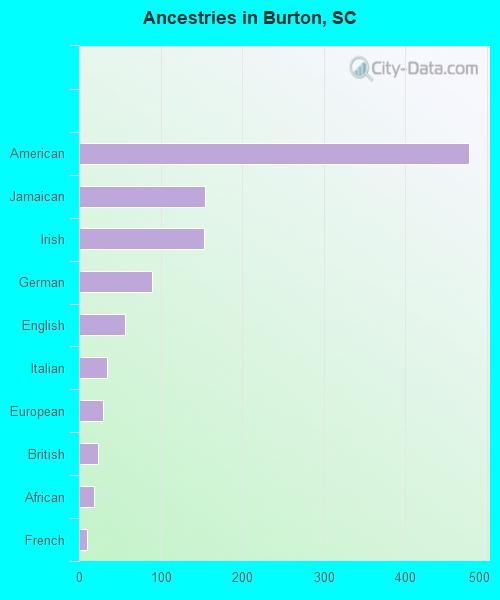
First ancestries reported:
- American: 479 (12.5%)
- Jamaican: 155 (4.0%)
- Irish: 153 (4.0%)
- German: 90 (2.3%)
- English: 56 (1.5%)
- Italian: 34 (0.9%)
- European: 30 (0.8%)
- British: 23 (0.6%)
- African: 19 (0.5%)
- French: 10 (0.3%)
Most common places of birth for foreign-born residents (%):
| Burton: | 23.8% (145) |
| South Carolina: | 22.5% (60,774) |
| Burton: | 16.9% (103) |
| South Carolina: | 2.3% (6,308) |
| Burton: | 14.0% (85) |
| South Carolina: | 2.6% (7,073) |
| Burton: | 13.7% (83) |
| South Carolina: | 3.7% (9,982) |
| Burton: | 4.8% (29) |
| South Carolina: | 4.1% (11,031) |
| Burton: | 2.5% (15) |
| South Carolina: | 0.8% (2,055) |
Place of birth for U.S.-born residents:
- This state: 4,406
- Other state: 2,216
- Northeast: 553
- Midwest: 382
- South: 1,116
- West: 203
86.5% of Burton residents lived in the same house 1 years ago.
Out of people who lived in different houses, 32.6% lived in this county.
Out of people who lived in different counties, 70.4% lived in South Carolina.
| Burton: | 86.5% |
| State average: | 86.5% |
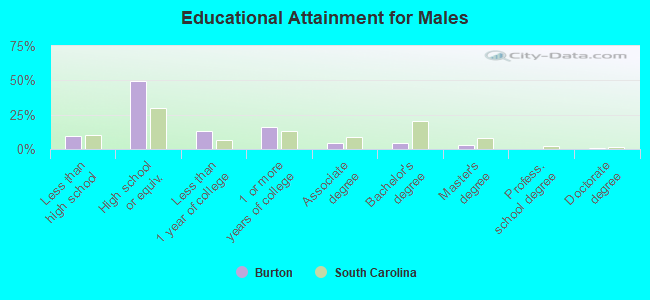
Education attainment for males 25 years and older:
- No schooling: 25
- Nursery to 4th grade: 0
- 5th and 6th grade: 0
- 7th and 8th grade: 0
- 9th grade: 81
- 10th grade: 0
- 11th grade: 45
- 12th grade, no diploma: 46
- High school graduate (or equivalency): 1,028
- Less than 1 year of college: 267
- Some college more than 1 year, no degree: 334
- Associate degree: 86
- Bachelor's degree: 96
- Master's degree: 55
- Professional school degree: 0
- Doctorate degree: 22
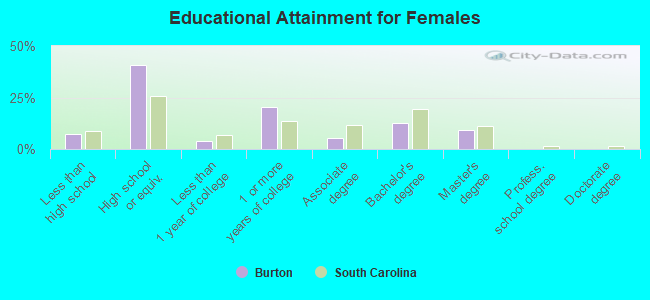
Education attainment for females 25 years and older:
- No schooling: 12
- Nursery to 4th grade: 0
- 5th and 6th grade: 0
- 7th and 8th grade: 38
- 9th grade: 0
- 10th grade: 48
- 11th grade: 68
- 12th grade, no diploma: 32
- High school graduate (or equivalency): 1,079
- Less than 1 year of college: 101
- Some college more than 1 year, no degree: 538
- Associate degree: 147
- Bachelor's degree: 339
- Master's degree: 247
- Professional school degree: 0
- Doctorate degree: 0
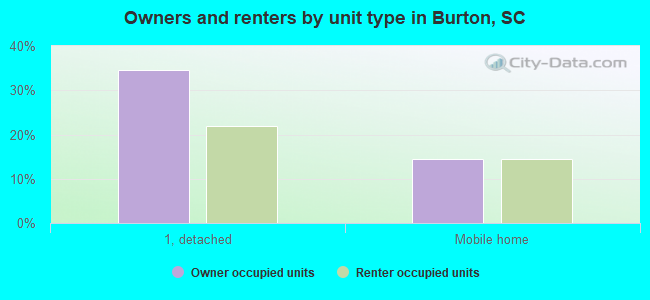
Housing units in structures:
- One, detached: 1,829
- One, attached: 3
- Two: 7
- 3 or 4: 43
- 5 to 9: 57
- 10 to 19: 59
- 20 to 49: 65
- Mobile homes: 1,048
Median worth of mobile homes: $34,092
Housing units lacking complete kitchen facilities in 2022: 6.2%
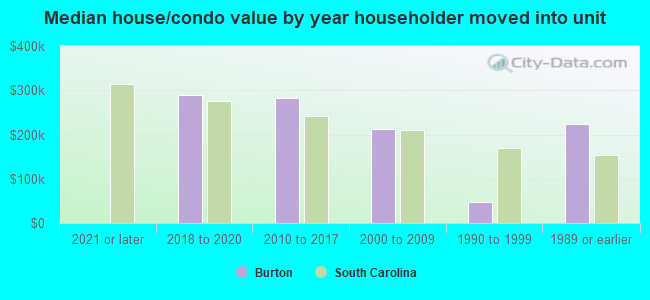
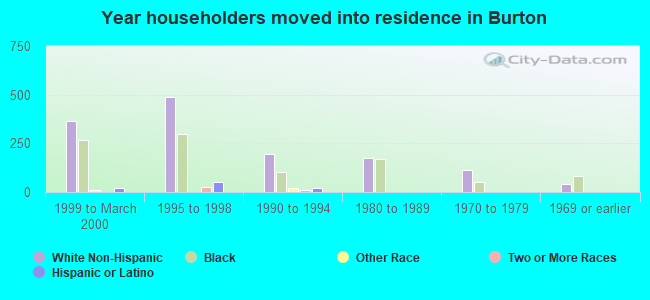
House/condo owner moved in on average 17 years ago
Renter moved in on average 3 years ago
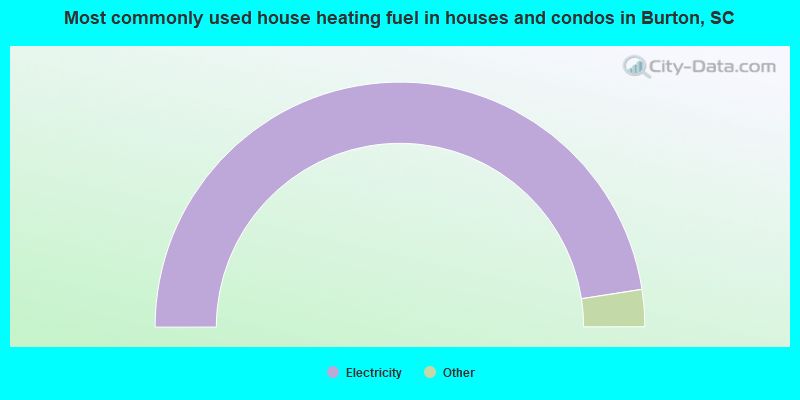
- 95.1%Electricity
- 2.0%Utility gas
- 1.6%Wood
- 1.3%Bottled, tank, or LP gas
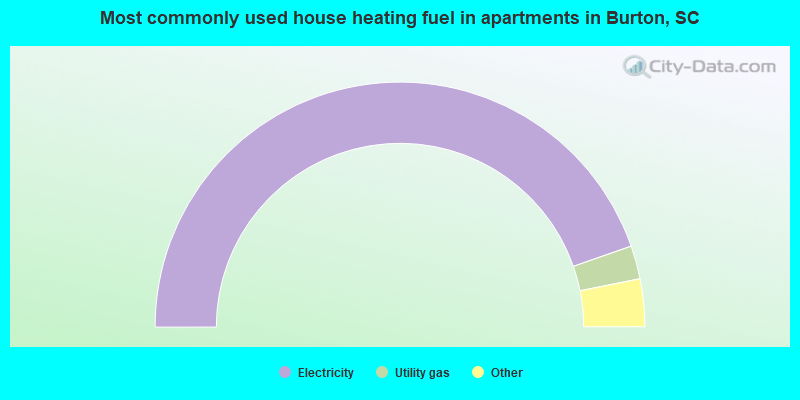
- 89.4%Electricity
- 4.4%Utility gas
- 3.8%Bottled, tank, or LP gas
- 1.2%No fuel used
- 1.2%Fuel oil, kerosene, etc.
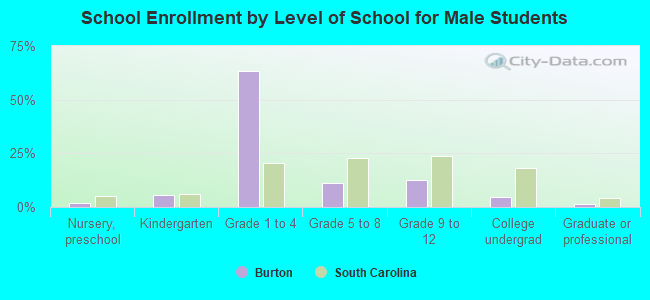
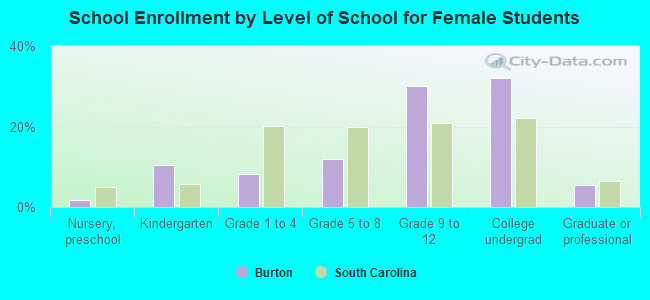
Private vs. public school enrollment:
| Here: | 11.9% |
| South Carolina: | 14.4% |
| Here: | 11.0% |
| South Carolina: | 11.1% |
| Here: | 83.2% |
| South Carolina: | 21.9% |