Butler, IN (Indiana) Houses and Residents
| Butler: | $105,032 |
| Indiana: | $208,700 |
Mean price in 2022:
Detached houses: $142,732
Here: $142,732 State: $257,916 Mobile homes: $9,909
Here: $9,909 State: $67,116
Total population: 2,690 (All urban)
Houses: 1,118 (1,024 occupied: 719 owner occupied, 317 renter occupied)
| % of renters here: | 31% |
| State: | 29% |
Housing density: 625 houses/condos per square mile
Median price asked for vacant for-sale houses and condos in 2022: $261,079.
Median contract rent in 2022: $647 (lower quartile is $481, upper quartile is $730)
Median rent asked for vacant for-rent units in 2022: $987
Median gross rent in Butler, IN in 2022: $741
Housing units in Butler with a mortgage: 505 (28 second mortgage, 0 home equity loan, 22 both second mortgage and home equity loan)
Houses without a mortgage: 113
Median household income for houses/condos with a mortgage: $54,440
Median household income for apartments without a mortgage: $64,435
Median monthly housing costs: $725
Compare current foreclosures near Butler, IN:
| Photo | Address | Area | Beds / Baths | Price | Details |
|---|---|---|---|---|---|

|
#1
Depot St
Butler, IN 46721
|
1,264 sq. feet
|
1 baths 4 beds |
show details | |

|
#2
N Ivy Ln
Butler, IN 46721
|
1,118 sq. feet
|
2 baths 3 beds |
show details | |

|
#3
Park Ln
Butler, IN 46721
|
936 sq. feet
|
1 baths 3 beds |
show details | |

|
#4
N Park Ln
Butler, IN 46721
|
1,288 sq. feet
|
1 baths 3 beds |
show details | |

|
#5
County Road 36a
Butler, IN 46721
|
1,620 sq. feet
|
1 baths 3 beds |
show details | |

|
#6
W Main St
Butler, IN 46721
|
- sq. feet
|
- baths - beds |
show details | |

|
#7
N Broadway St
Butler, IN 46721
|
- sq. feet
|
- baths - beds |
show details | |

|
#8
Walnut St
Butler, IN 46721
|
- sq. feet
|
- baths - beds |
show details | |

|
#9
Northcrest Trailer Ct # 17
Butler, IN 46721
|
- sq. feet
|
- baths - beds |
show details | |

|
#10
County Road 77
Butler, IN 46721
|
- sq. feet
|
- baths - beds |
show details |
| Photo | Address | Area | Beds / Baths | Price | Details |
|---|---|---|---|---|---|

|
#11
County Road 34
Butler, IN 46721
|
- sq. feet
|
- baths - beds |
show details | |

|
#12
E Lynn St
Edgerton, OH 43517
|
- sq. feet
|
- baths - beds |
$24,900
|
show details |

|
#13
Oak Park Dr
Hicksville, OH 43526
|
1,196 sq. feet
|
1 baths 3 beds |
show details | |

|
#14
Phillip St
Auburn, IN 46706
|
- sq. feet
|
2 baths 3 beds |
show details | |

|
#15
E Smith St
Hicksville, OH 43526
|
1,540 sq. feet
|
2 baths 4 beds |
show details | |

|
#16
Hawk Rdg
Harlan, IN 46743
|
- sq. feet
|
2 baths 3 beds |
show details | |

|
#17
S Lynn St
Bryan, OH 43506
|
1,778 sq. feet
|
2 baths 4 beds |
show details | |

|
#18
Oak Meadows Dr
Bryan, OH 43506
|
2,514 sq. feet
|
3 baths 4 beds |
show details | |

|
#19
Covered Wagon Trl
Leo, IN 46765
|
2,004 sq. feet
|
2 baths 4 beds |
show details | |

|
#20
County Road C
Bryan, OH 43506
|
1,590 sq. feet
|
1 baths 3 beds |
show details |
| Photo | Address | Area | Beds / Baths | Price | Details |
|---|---|---|---|---|---|

|
#21
W Main St
Pleasant Lake, IN 46779
|
992 sq. feet
|
2 baths 1 beds |
show details | |

|
#22
N Lynn St
Bryan, OH 43506
|
1,588 sq. feet
|
1 baths 3 beds |
show details | |

|
#23
County Road 20
Corunna, IN 46730
|
3,027 sq. feet
|
2 baths 4 beds |
show details | |

|
#24
Country Club Rd
Bryan, OH 43506
|
3,133 sq. feet
|
2 baths 3 beds |
show details | |

|
#25
Farmer St
Bryan, OH 43506
|
1,344 sq. feet
|
2 baths 4 beds |
show details | |

|
#26
State Route 576
Bryan, OH 43506
|
1,898 sq. feet
|
1 baths 3 beds |
show details | |

|
#27
South Rd
Garrett, IN 46738
|
1,044 sq. feet
|
1 baths 3 beds |
show details | |

|
#28
Garman Rd
Leo, IN 46765
|
1,832 sq. feet
|
1 baths 3 beds |
show details | |

|
#29
Springfield Center Rd
Grabill, IN 46741
|
1,248 sq. feet
|
1 baths 3 beds |
show details | |

|
#30
S 2nd St
Garrett, IN 46738
|
2,360 sq. feet
|
2 baths 5 beds |
show details |
| Photo | Address | Area | Beds / Baths | Price | Details |
|---|---|---|---|---|---|

|
#31
S Franklin St
Garrett, IN 46738
|
1,086 sq. feet
|
1 baths 2 beds |
show details | |

|
#32
N Randolph St
Garrett, IN 46738
|
2,640 sq. feet
|
1 baths 4 beds |
show details | |

|
#33
Roberts Rd
Harlan, IN 46743
|
1,364 sq. feet
|
1 baths 2 beds |
show details | |

|
#34
S Cowen St
Garrett, IN 46738
|
1,758 sq. feet
|
1 baths 3 beds |
show details | |

|
#35
N Cross St
Angola, IN 46703
|
1,474 sq. feet
|
1 baths 4 beds |
show details | |

|
#36
Clyde Ave
Angola, IN 46703
|
960 sq. feet
|
1 baths 3 beds |
show details | |

|
#37
Carlin Pl
Angola, IN 46703
|
1,744 sq. feet
|
1 baths 4 beds |
show details | |

|
#38
N James St
Garrett, IN 46738
|
872 sq. feet
|
1 baths 2 beds |
show details | |

|
#39
Ohio Dr
Bryan, OH 43506
|
1,744 sq. feet
|
2 baths 3 beds |
show details | |

|
#40
S Main St
Bryan, OH 43506
|
1,103 sq. feet
|
1 baths 3 beds |
show details |
| Photo | Address | Area | Beds / Baths | Price | Details |
|---|---|---|---|---|---|

|
#41
Donald Ave
Leo, IN 46765
|
2,328 sq. feet
|
1 baths 4 beds |
show details | |

|
#42
Manahan Dr
Angola, IN 46703
|
1,100 sq. feet
|
1 baths 3 beds |
show details | |

|
#43
Lions Psge
Leo, IN 46765
|
2,792 sq. feet
|
3 baths 4 beds |
show details | |

|
#44
Calvary Ln
Angola, IN 46703
|
1,490 sq. feet
|
1 baths 3 beds |
show details | |

|
#45
N 200 E
Angola, IN 46703
|
2,597 sq. feet
|
2 baths 3 beds |
show details | |

|
#46
Maple Dr
Grabill, IN 46741
|
1,626 sq. feet
|
2 baths 4 beds |
show details | |

|
#47
Red Fox Way
Leo, IN 46765
|
2,651 sq. feet
|
3 baths 4 beds |
show details | |

|
#48
Hidden Creek Dr
Auburn, IN 46706
|
1,390 sq. feet
|
2 baths 3 beds |
show details | |

|
#49
N Michigan St
Edon, OH 43518
|
1,952 sq. feet
|
1 baths 3 beds |
show details | |

|
Check over 1 million property listings on Foreclosure.com!
|
browse all offers | |||

Latest news about housing in Butler, IN collected exclusively by city-data.com from local newspapers, TV, and radio stations

 | Apartment rec’s (4 replies) |
| Help Finding Rental House In Decent Area (7 replies) |
| Housing prices by suburb? (14 replies) |
| Safest Apartments in IN (Out of Town Couple Needs Help) (31 replies) |
| Have a question about two apartments I have in mind... (25 replies) |
| Help choosing apartment/rental (3 replies) |
Median year apartment built: 1959
Household type by relationship:
Households: 2,765- Male householders: 500 (120 living alone), Female householders: 515 (158 living alone)
403 spouses (403 opposite-sex spouses), 123 unmarried partners, (119 opposite-sex unmarried partners), 917 children (833 natural, 5 adopted, 78 stepchildren), 94 grandchildren, 10 brothers or sisters, 20 parents, 0 foster children, 29 other relatives, 34 non-relatives
- In group quarters: 115
Size of family households: 227 2-persons, 211 3-persons, 133 4-persons, 71 5-persons, 24 6-persons, 24 7-or-more-persons.
Size of nonfamily households: 286 1-person, 54 2-persons, 3 3-persons.
312 married couples with children.
376 single-parent households (163 men, 213 women).
96.8% of residents of Butler speak English at home.
2.7% of residents speak Spanish at home (100% speak English very well).
Foreign born population: 18 (0.7%)
(105.6% of them are naturalized citizens)
| Here: | 6.6 |
| State: | 6.6 |
| Here: | 4.7 |
| State: | 4.3 |

- Bedrooms in owner-occupied houses and condos in Butler, Indiana
- 0no bedroom
- 111 bedroom
- 1042 bedrooms
- 4043 bedrooms
- 1494 bedrooms
- 515+ bedrooms

- Bedrooms in renter-occupied apartments in Butler, Indiana
- 21no bedroom
- 691 bedroom
- 1492 bedrooms
- 583 bedrooms
- 224 bedrooms
- 05+ bedrooms

- Cars and other vehicles available in Butler in owner-occupied houses/condos
- 68no vehicle
- 2201 vehicle
- 2762 vehicles
- 1093 vehicles
- 424 vehicles
- 45+ vehicles

- Cars and other vehicles available in Butler in renter-occupied apartments
- 22no vehicle
- 1751 vehicle
- 792 vehicles
- 333 vehicles
- 94 vehicles
- 05+ vehicles

- Rooms in owner-occupied houses in Butler, Indiana
- 01 room
- 02 rooms
- 63 rooms
- 354 rooms
- 1595 rooms
- 1436 rooms
- 1517 rooms
- 1098 rooms
- 1169+ rooms

- Rooms in renter-occupied apartments in Butler, Indiana
- 211 room
- 02 rooms
- 553 rooms
- 554 rooms
- 1065 rooms
- 86 rooms
- 207 rooms
- 388 rooms
- 149+ rooms


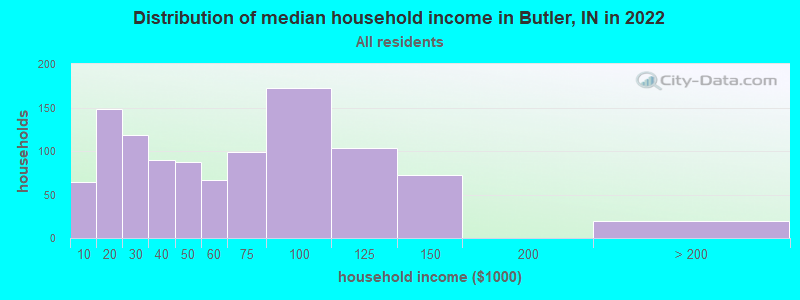
Butler, IN household income distribution

- 64Less than $10,000
- 148$10,000 to $19,999
- 118$20,000 to $29,999
- 90$30,000 to $39,999
- 87$40,000 to $49,999
- 67$50,000 to $59,999
- 99$60,000 to $74,999
- 172$75,000 to $99,999
- 103$100,000 to $124,999
- 72$125,000 to $149,999
- 20$200,000 or more
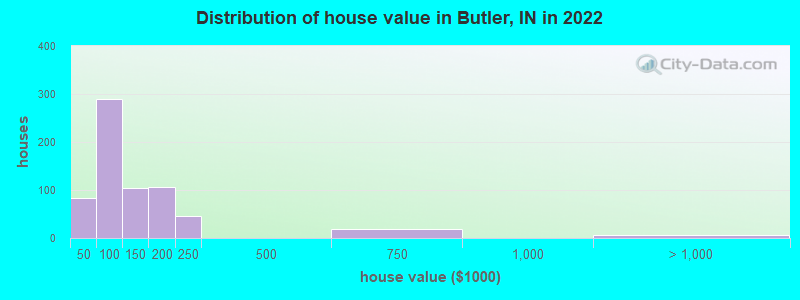
Home value of owner - occupied houses in 2022 in Butler, IN
-
- 29Less than $10,000
- 13$10,000 to $14,999
- 11$15,000 to $19,999
- 15$25,000 to $29,999
- 12$40,000 to $49,999
- 54$50,000 to $59,999
- 41$60,000 to $69,999
- 59$70,000 to $79,999
- 68$80,000 to $89,999
- 52$90,000 to $99,999
- 97$100,000 to $124,999
- 7$125,000 to $149,999
- 49$150,000 to $174,999
- 57$175,000 to $199,999
- 45$200,000 to $249,999
- 18$500,000 to $749,999
- 6$1,500,000 to $1,999,999
Rent paid by renters in 2022 in Butler, IN
-
- 35$150 to $199
- 7$200 to $249
- 27$400 to $449
- 12$450 to $499
- 9$500 to $549
- 31$550 to $599
- 28$600 to $649
- 75$650 to $699
- 22$700 to $749
- 17$750 to $799
- 13$800 to $899
- 12$900 to $999
- 6$1,250 to $1,499
- 4No cash rent


Percentage of workers working in this county: 71.2%
Number of people working at home: 52 (4.7% of all workers)
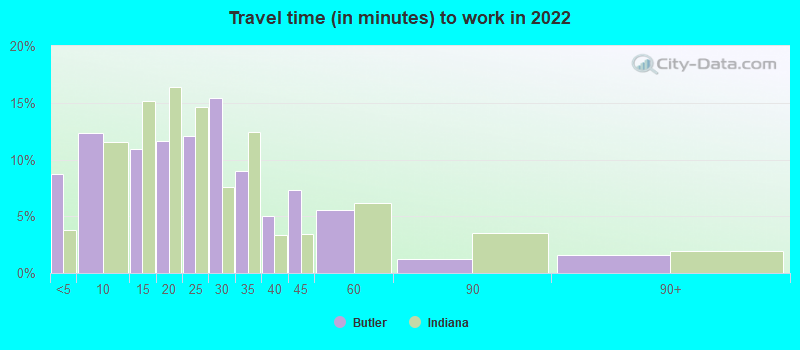
Travel time to work (commute)
- Less than 5 minutes: 135
- 5 to 9 minutes: 224
- 10 to 14 minutes: 173
- 15 to 19 minutes: 41
- 20 to 24 minutes: 92
- 25 to 29 minutes: 58
- 30 to 34 minutes: 134
- 35 to 39 minutes: 31
- 40 to 44 minutes: 24
- 45 to 59 minutes: 85
- 60 to 89 minutes: 18
- 90 or more minutes: 19
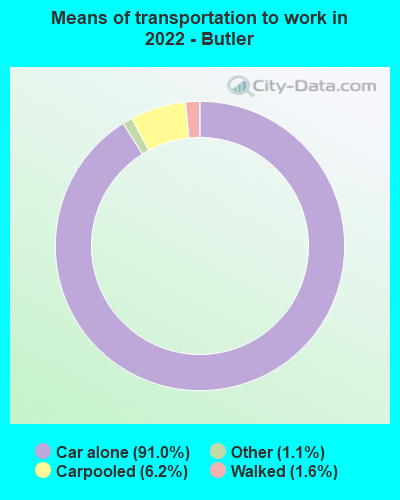
Means of transportation to work:
- Drove a car alone: 1,933 (86.0%)
- Carpooled: 146 (6.5%)
- Taxi: 28 (1.2%)
- Walked: 34 (1.5%)
- Worked at home: 52 (2.3%)

- Unemployment by race in 2022
- Unemployment rate for White non-Hispanic residents
- 3.8%Males
- 2.3%Females

First ancestries reported:
- German: 345 (31.7%)
- English: 267 (24.6%)
- American: 171 (15.7%)
- Irish: 103 (9.5%)
- Dutch: 46 (4.2%)
- European: 43 (4.0%)
- French: 14 (1.3%)
- Scottish: 14 (1.3%)
- Swiss: 10 (0.9%)
- Italian: 7 (0.6%)
- Norwegian: 4 (0.4%)
Most common places of birth for foreign-born residents (%):
| Butler: | 77.8% (14) |
| Indiana: | 0.7% (2,504) |
Place of birth for U.S.-born residents:
- This state: 1,950
- Other state: 776
- Northeast: 14
- Midwest: 532
- South: 163
- West: 69
81.6% of Butler residents lived in the same house 1 years ago.
Out of people who lived in different houses, 30.6% lived in this county.
Out of people who lived in different counties, 66.5% lived in Indiana.
| Butler: | 81.6% |
| State average: | 87.1% |
Education attainment for males 25 years and older:
- No schooling: 0
- Nursery to 4th grade: 9
- 5th and 6th grade: 0
- 7th and 8th grade: 4
- 9th grade: 7
- 10th grade: 36
- 11th grade: 59
- 12th grade, no diploma: 42
- High school graduate (or equivalency): 424
- Less than 1 year of college: 57
- Some college more than 1 year, no degree: 43
- Associate degree: 66
- Bachelor's degree: 74
- Master's degree: 7
- Professional school degree: 0
- Doctorate degree: 12

Education attainment for females 25 years and older:
- No schooling: 18
- Nursery to 4th grade: 0
- 5th and 6th grade: 0
- 7th and 8th grade: 37
- 9th grade: 28
- 10th grade: 11
- 11th grade: 44
- 12th grade, no diploma: 21
- High school graduate (or equivalency): 392
- Less than 1 year of college: 65
- Some college more than 1 year, no degree: 75
- Associate degree: 128
- Bachelor's degree: 66
- Master's degree: 11
- Professional school degree: 0
- Doctorate degree: 0

Housing units in structures:
- One, detached: 778
- One, attached: 44
- Two: 49
- 3 or 4: 26
- 5 to 9: 99
- 10 to 19: 24
- 20 to 49: 19
- Mobile homes: 75
Housing units lacking complete kitchen facilities in 2022: 5.0%
House/condo owner moved in on average 9 years ago
Renter moved in on average 5 years ago

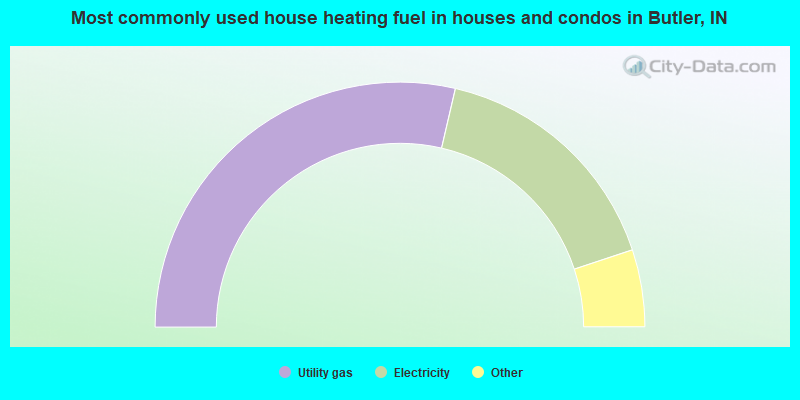
- 57.4%Utility gas
- 32.6%Electricity
- 3.9%Fuel oil, kerosene, etc.
- 3.6%Bottled, tank, or LP gas
- 2.6%Wood
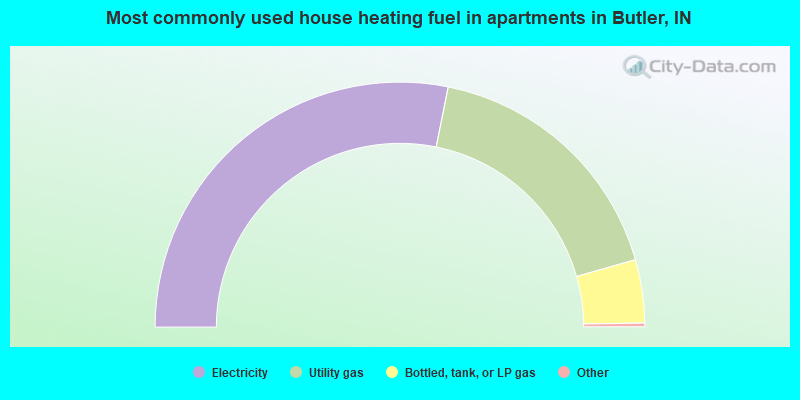
- 56.6%Electricity
- 35.0%Utility gas
- 8.4%Bottled, tank, or LP gas
Private vs. public school enrollment:
| Here: | 13.8% |
| Indiana: | 14.9% |
| Here: | 13.1% |
| Indiana: | 11.4% |
| Here: | 38.9% |
| Indiana: | 22.3% |


