Butler, TX (Texas) Houses and Residents
| Butler: | $221,531 |
| Texas: | $275,400 |
Total population: 1,475 (Urban population: 0, Rural population: 1,422 (76 farm, 1,346 nonfarm))
Houses: 877 (604 occupied: 502 owner occupied, 102 renter occupied)
| % of renters here: | 17% |
| State: | 38% |
Housing density: 4 houses/condos per square mile
Median price asked for vacant for-sale houses and condos in 2022 in this county: $187,968.
Median contract rent in 2022: $367 (lower quartile is $314, upper quartile is $435)
Median rent asked for vacant for-rent units in 2022: $369
Median gross rent in Butler, TX in 2022: $588
Housing units in Butler with a mortgage: 42 (0 second mortgage, 2 home equity loan, 0 both second mortgage and home equity loan)
Houses without a mortgage: 150


Household type by relationship:
Households: 18,235- In family households: 15,710 (3,702 male householders, 1,339 female householders)
3,957 spouses, 5,129 children (4,625 natural, 128 adopted, 376 stepchildren), 606 grandchildren, 152 brothers or sisters, 125 parents, foster children, 223 other relatives, 357 non-relatives
- In nonfamily households: 2,525 (1,030 male householders (870 living alone)), 1,188 female householders (1,089 living alone)), 307 nonrelatives
- In group quarters: 1,581 (1,574 institutionalized population)
2,815 married couples with children.
924 single-parent households (217 men, 707 women).
96.8% of residents of Butler speak English at home.
1.7% of residents speak Spanish at home (96% speak English very well, 4% speak English well).
1.1% of residents speak other Indo-European language at home (62% speak English very well, 38% speak English not well).
0.4% of residents speak Asian or Pacific Island language at home (40% speak English very well, 60% speak English well).
Foreign born population: 34 (1.8%)
(20.6% of them are naturalized citizens)
| Here: | 6.0 |
| State: | 6.3 |
| Here: | 4.8 |
| State: | 4.0 |

- Bedrooms in owner-occupied houses and condos in Butler, Texas
- 2no bedroom
- 191 bedroom
- 1742 bedrooms
- 2603 bedrooms
- 454 bedrooms
- 25+ bedrooms

- Bedrooms in renter-occupied apartments in Butler, Texas
- 0no bedroom
- 201 bedroom
- 452 bedrooms
- 373 bedrooms
- 04 bedrooms
- 05+ bedrooms

- Cars and other vehicles available in Butler in owner-occupied houses/condos
- 41no vehicle
- 1581 vehicle
- 2172 vehicles
- 753 vehicles
- 114 vehicles
- 05+ vehicles

- Cars and other vehicles available in Butler in renter-occupied apartments
- 8no vehicle
- 421 vehicle
- 262 vehicles
- 183 vehicles
- 84 vehicles
- 05+ vehicles

- Rooms in owner-occupied houses in Butler, Texas
- 21 room
- 02 rooms
- 493 rooms
- 864 rooms
- 1375 rooms
- 1426 rooms
- 577 rooms
- 218 rooms
- 89+ rooms

- Rooms in renter-occupied apartments in Butler, Texas
- 01 room
- 02 rooms
- 263 rooms
- 284 rooms
- 135 rooms
- 356 rooms
- 07 rooms
- 08 rooms
- 09+ rooms


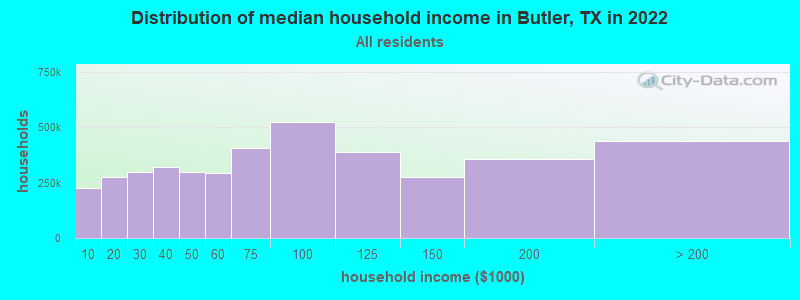
Butler, TX household income distribution

- 66,335Less than $10,000
- 90,183$10,000 to $19,999
- 98,109$20,000 to $29,999
- 103,334$30,000 to $39,999
- 97,491$40,000 to $49,999
- 93,565$50,000 to $59,999
- 129,523$60,000 to $74,999
- 177,346$75,000 to $99,999
- 134,439$100,000 to $124,999
- 99,114$125,000 to $149,999
- 115,259$150,000 to $199,999
- 129,555$200,000 or more
Percentage of workers working in this county: 48.5%
Number of people working at home: 77 (11.0% of all workers)
Travel time to work (commute)
- Less than 5 minutes: 16
- 5 to 9 minutes: 38
- 10 to 14 minutes: 13
- 15 to 19 minutes: 72
- 20 to 24 minutes: 69
- 25 to 29 minutes: 25
- 30 to 34 minutes: 118
- 35 to 39 minutes: 10
- 40 to 44 minutes: 10
- 45 to 59 minutes: 47
- 60 to 89 minutes: 31
- 90 or more minutes: 30
Means of transportation to work:
- Drove a car alone: 373 (72.9%)
- Carpooled: 87 (17.0%)
- Bus or trolley bus: 3 (0.6%)
- Walked: 14 (2.7%)
- Other means: 2 (0.4%)
- Worked at home: 33 (6.4%)


- Year of entry for the foreign-born population in Butler, Texas
- 01995 to March 2000
- 01990 to 1994
- 61985 to 1989
- 61980 to 1984
- 01975 to 1979
- 01970 to 1974
- 31965 to 1969
- 0Before 1965
Most common places of birth for foreign-born residents (%):
| Butler: | 40.0% (6) |
| Texas: | 0.1% (3,452) |
| Butler: | 40.0% (6) |
| Texas: | 0.3% (8,214) |
| Butler: | 20.0% (3) |
| Texas: | 0.3% (7,904) |
Place of birth for U.S.-born residents:
- This state: 1,215
- Other state: 190
- Northeast: 11
- Midwest: 32
- South: 114
- West: 33
62% of Butler residents lived in the same house 5 years ago.
Out of people who lived in different houses, 17% lived in this county.
Out of people who lived in different counties, 84% lived in Texas.
Education attainment for males 25 years and older:
- No schooling: 0
- Nursery to 4th grade: 0
- 5th and 6th grade: 24
- 7th and 8th grade: 28
- 9th grade: 20
- 10th grade: 29
- 11th grade: 64
- 12th grade, no diploma: 10
- High school graduate (or equivalency): 167
- Less than 1 year of college: 36
- Some college more than 1 year, no degree: 41
- Associate degree: 27
- Bachelor's degree: 60
- Master's degree: 8
- Professional school degree: 0
- Doctorate degree: 0

Education attainment for females 25 years and older:
- No schooling: 5
- Nursery to 4th grade: 0
- 5th and 6th grade: 8
- 7th and 8th grade: 17
- 9th grade: 16
- 10th grade: 39
- 11th grade: 18
- 12th grade, no diploma: 18
- High school graduate (or equivalency): 203
- Less than 1 year of college: 59
- Some college more than 1 year, no degree: 57
- Associate degree: 39
- Bachelor's degree: 39
- Master's degree: 8
- Professional school degree: 5
- Doctorate degree: 0

Housing units in structures:
- One, detached: 552
- One, attached: 2
- Mobile homes: 318
- Boats, RVs, vans, etc.: 5
Median worth of mobile homes: $138,656
Housing units lacking complete kitchen facilities: 4.0%

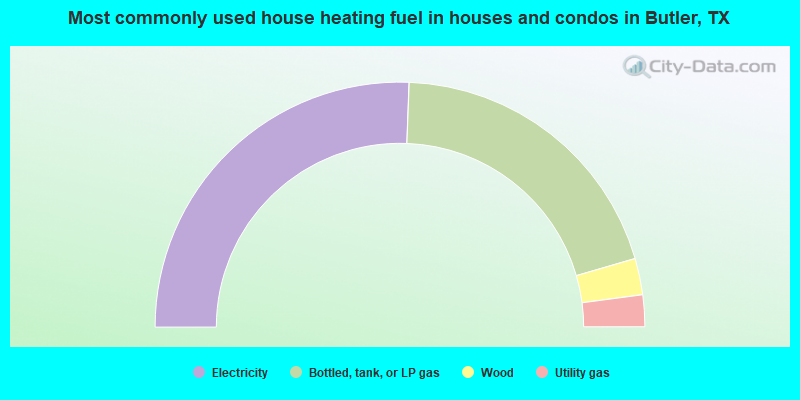
- 51.2%Electricity
- 39.8%Bottled, tank, or LP gas
- 4.8%Wood
- 4.2%Utility gas
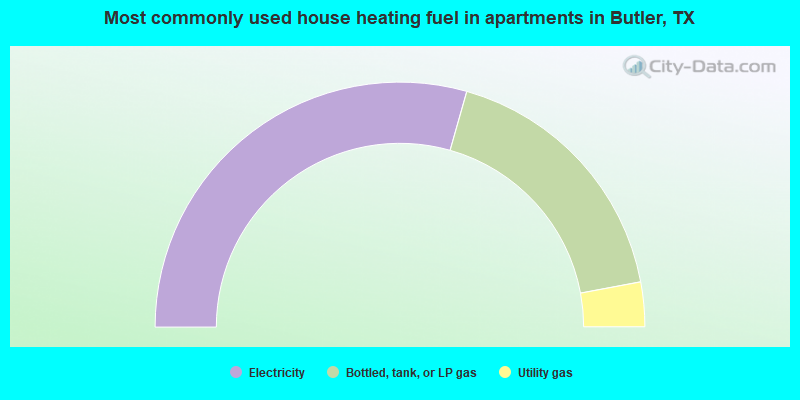
- 58.8%Electricity
- 35.3%Bottled, tank, or LP gas
- 5.9%Utility gas
Private vs. public school enrollment:
| Here: | 17.5% |
| Texas: | 6.8% |
| Here: | 0.0% |
| Texas: | 6.2% |
| Here: | 22.2% |
| Texas: | 15.4% |


