Byron, CA (California) Houses and Residents
| Byron: | $803,227 |
| California: | $715,900 |
Mean price in 2022:
Detached houses: $1,074,305
Here: $1,074,305 State: $988,808 Mobile homes: $32,653
Here: $32,653 State: $184,506
Total population: 1,277 (Urban population: 348 (all inside urban clusters), Rural population: 536 (all nonfarm))
Houses: 556 (556 occupied: 371 owner occupied, 185 renter occupied)
| % of renters here: | 33% |
| State: | 44% |
Housing density: 219 houses/condos per square mile
Median price asked for vacant for-sale houses and condos in 2022 in this county: $378,161.
Median contract rent in 2022: $1,952 (lower quartile is $1,665, upper quartile is over $2,000)
Median rent asked for vacant for-rent units in 2022: $2,453
Median gross rent in Byron, CA in 2022: over $2,000
Housing units in Byron with a mortgage: 216 (7 second mortgage, 0 home equity loan, 7 both second mortgage and home equity loan)
Houses without a mortgage: 0
Median household income for houses/condos with a mortgage: $118,254
Median household income for apartments without a mortgage: $46,731
Median monthly housing costs: $2,134
Compare current foreclosures near Byron, CA:
| Photo | Address | Area | Beds / Baths | Price | Details |
|---|---|---|---|---|---|

|
#1
Kelso Rd
Byron, CA 94514
|
- sq. feet
|
2 baths 5 beds |
show details | |

|
#2
Christensen Rd
Byron, CA 94514
|
- sq. feet
|
- baths - beds |
show details | |

|
#3
E 12th St
Pittsburg, CA 94565
|
1,345 sq. feet
|
1 baths 2 beds |
$540,000
|
show details |

|
#4
Shasta Cir
Pittsburg, CA 94565
|
1,053 sq. feet
|
1 baths 3 beds |
show details | |

|
#5
Mulberry Ct
Tracy, CA 95377
|
2,720 sq. feet
|
3 baths 5 beds |
show details | |

|
#6
Filbert St
Antioch, CA 94509
|
1,137 sq. feet
|
2 baths 3 beds |
show details | |

|
#7
Drake Ct
Oakley, CA 94561
|
1,164 sq. feet
|
2 baths 3 beds |
show details | |

|
#8
Carpino Ave
Pittsburg, CA 94565
|
975 sq. feet
|
1 baths 3 beds |
show details | |

|
#9
Yellowstone Dr
Antioch, CA 94509
|
2,128 sq. feet
|
3 baths 4 beds |
show details | |

|
#10
Hilliard Cir
Antioch, CA 94509
|
2,332 sq. feet
|
3 baths 4 beds |
show details |
| Photo | Address | Area | Beds / Baths | Price | Details |
|---|---|---|---|---|---|

|
#11
Crestwood Dr
Antioch, CA 94509
|
1,360 sq. feet
|
2 baths 3 beds |
show details | |

|
#12
Beede Way
Antioch, CA 94509
|
2,228 sq. feet
|
2 baths 2 beds |
show details | |

|
#13
Pinzano Wy
Antioch, CA 94531
|
- sq. feet
|
2 baths 3 beds |
show details | |

|
#14
S Royal Links Cir
Antioch, CA 94509
|
1,219 sq. feet
|
2 baths 3 beds |
show details | |

|
#15
Treana Ct
Tracy, CA 95377
|
2,126 sq. feet
|
2 baths 4 beds |
show details | |

|
#16
W 15th St
Antioch, CA 94509
|
1,338 sq. feet
|
2 baths 3 beds |
show details | |

|
#17
Turnstone Cir
Pittsburg, CA 94565
|
1,805 sq. feet
|
2 baths 3 beds |
show details | |

|
#18
Shetland Way
Antioch, CA 94531
|
3,249 sq. feet
|
3 baths 5 beds |
show details | |

|
#19
Merrill Dr
Antioch, CA 94509
|
2,113 sq. feet
|
3 baths 3 beds |
show details | |

|
#20
Pendleton Ct
Oakley, CA 94561
|
3,075 sq. feet
|
3 baths 5 beds |
show details |
| Photo | Address | Area | Beds / Baths | Price | Details |
|---|---|---|---|---|---|

|
#21
Deer Trail Dr
Danville, CA 94506
|
3,856 sq. feet
|
3 baths 3 beds |
show details | |

|
#22
Rockspring Way
Antioch, CA 94531
|
1,631 sq. feet
|
2 baths 4 beds |
show details | |

|
#23
Monterey Ct
Tracy, CA 95376
|
1,880 sq. feet
|
2 baths 3 beds |
show details | |

|
#24
Keys Way
Tracy, CA 95377
|
4,098 sq. feet
|
4 baths 5 beds |
show details | |

|
#25
Poplar Dr
Oakley, CA 94561
|
3,341 sq. feet
|
3 baths 4 beds |
show details | |

|
#26
Laguna Dr
Tracy, CA 95376
|
1,577 sq. feet
|
2 baths 3 beds |
show details | |

|
#27
San Jose Dr Unit 228
Antioch, CA 94509
|
830 sq. feet
|
2 baths 2 beds |
show details | |

|
#28
Miller St
Antioch, CA 94509
|
1,070 sq. feet
|
1 baths 3 beds |
show details | |

|
#29
Oriole Ave
Livermore, CA 94551
|
1,573 sq. feet
|
2 baths 4 beds |
show details | |

|
#30
Monitor Pass Way
Antioch, CA 94531
|
1,657 sq. feet
|
2 baths 4 beds |
show details |
| Photo | Address | Area | Beds / Baths | Price | Details |
|---|---|---|---|---|---|

|
#31
Shorelake Ct
Stockton, CA 95219
|
2,668 sq. feet
|
3 baths 4 beds |
show details | |

|
#32
Nandina Ct
Antioch, CA 94531
|
1,267 sq. feet
|
2 baths 3 beds |
show details | |

|
#33
Panoramic Ave
Pittsburg, CA 94565
|
1,364 sq. feet
|
1 baths 4 beds |
show details | |

|
#34
Sonora Ct
Oakley, CA 94561
|
3,852 sq. feet
|
3 baths 5 beds |
show details | |

|
#35
Doyle Rd
Oakley, CA 94561
|
2,067 sq. feet
|
2 baths 4 beds |
show details | |

|
#36
W Brannan Island Rd
Isleton, CA 95641
|
- sq. feet
|
2 baths 3 beds |
show details | |

|
#37
Jones Ln
Tracy, CA 95377
|
2,516 sq. feet
|
3 baths 5 beds |
show details | |

|
#38
Bridle Creek Cir
Tracy, CA 95377
|
2,447 sq. feet
|
3 baths 5 beds |
show details | |

|
#39
Doncaster Dr
Antioch, CA 94509
|
1,856 sq. feet
|
2 baths 3 beds |
show details | |

|
#40
Dover Ln
Tracy, CA 95377
|
2,130 sq. feet
|
4 baths 5 beds |
show details |
| Photo | Address | Area | Beds / Baths | Price | Details |
|---|---|---|---|---|---|

|
#41
Peachtree Cir
Antioch, CA 94509
|
2,043 sq. feet
|
2 baths 4 beds |
show details | |

|
#42
Glendale Cir
Antioch, CA 94509
|
2,060 sq. feet
|
2 baths 4 beds |
show details | |

|
#43
Tabora Dr
Antioch, CA 94509
|
2,511 sq. feet
|
2 baths 4 beds |
show details | |

|
#44
Peachtree Cir
Antioch, CA 94509
|
2,132 sq. feet
|
2 baths 4 beds |
show details | |

|
#45
Kennsington Ct
Tracy, CA 95377
|
1,800 sq. feet
|
3 baths 4 beds |
show details | |

|
#46
Fuente Ct
Antioch, CA 94509
|
1,666 sq. feet
|
2 baths 4 beds |
show details | |

|
#47
Putnam St
Antioch, CA 94509
|
1,245 sq. feet
|
2 baths 3 beds |
show details | |

|
#48
Lincoln Blvd
Tracy, CA 95376
|
1,661 sq. feet
|
2 baths 3 beds |
show details | |

|
#49
Enea Way
Antioch, CA 94509
|
1,400 sq. feet
|
2 baths 3 beds |
show details | |

|
Check over 1 million property listings on Foreclosure.com!
|
browse all offers | |||

Latest news about housing in Byron, CA collected exclusively by city-data.com from local newspapers, TV, and radio stations


Median year apartment built: 1967
Household type by relationship:
Households: 1,908- Male householders: 249 (7 living alone), Female householders: 296 (67 living alone)
254 spouses (254 opposite-sex spouses), 136 unmarried partners, (136 opposite-sex unmarried partners), 823 children (641 natural, 23 adopted, 158 stepchildren), 34 grandchildren, 0 brothers or sisters, 70 parents, 0 foster children, 0 other relatives, 28 non-relatives
- In group quarters: 12
Size of family households: 169 2-persons, 100 3-persons, 34 4-persons, 35 5-persons, 40 6-persons, 64 7-or-more-persons.
Size of nonfamily households: 76 1-person, 41 2-persons.
90 married couples with children.
251 single-parent households (147 men, 104 women).
70.6% of residents of Byron speak English at home.
26.6% of residents speak Spanish at home (55% speak English very well, 39% speak English well, 6% speak English not well).
1.9% of residents speak Asian or Pacific Island language at home (100% speak English very well).
Foreign born population: 286 (15.0%)
(64.7% of them are naturalized citizens)
| Here: | 6.3 |
| State: | 6.0 |
| Here: | 4.8 |
| State: | 3.9 |

- Bedrooms in owner-occupied houses and condos in Byron, California
- 0no bedroom
- 01 bedroom
- 702 bedrooms
- 1573 bedrooms
- 734 bedrooms
- 725+ bedrooms

- Bedrooms in renter-occupied apartments in Byron, California
- 25no bedroom
- 201 bedroom
- 972 bedrooms
- 353 bedrooms
- 94 bedrooms
- 05+ bedrooms

- Cars and other vehicles available in Byron in owner-occupied houses/condos
- 17no vehicle
- 681 vehicle
- 1052 vehicles
- 523 vehicles
- 464 vehicles
- 845+ vehicles

- Cars and other vehicles available in Byron in renter-occupied apartments
- 0no vehicle
- 01 vehicle
- 592 vehicles
- 283 vehicles
- 294 vehicles
- 695+ vehicles

- Rooms in owner-occupied houses in Byron, California
- 01 room
- 02 rooms
- 73 rooms
- 504 rooms
- 765 rooms
- 686 rooms
- 537 rooms
- 08 rooms
- 1189+ rooms

- Rooms in renter-occupied apartments in Byron, California
- 251 room
- 02 rooms
- 63 rooms
- 344 rooms
- 1035 rooms
- 06 rooms
- 97 rooms
- 98 rooms
- 09+ rooms


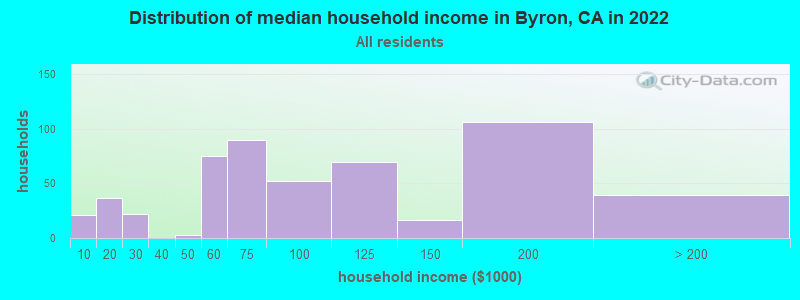
Byron, CA household income distribution

- 21Less than $10,000
- 37$10,000 to $19,999
- 22$20,000 to $29,999
- 3$40,000 to $49,999
- 75$50,000 to $59,999
- 90$60,000 to $74,999
- 52$75,000 to $99,999
- 69$100,000 to $124,999
- 16$125,000 to $149,999
- 106$150,000 to $199,999
- 39$200,000 or more
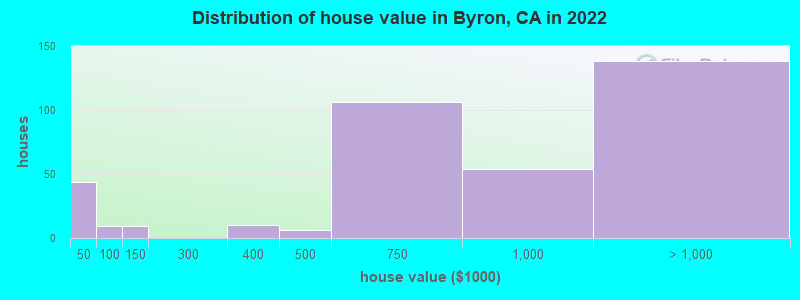
Home value of owner - occupied houses in 2022 in Byron, CA
-
- 11Less than $10,000
- 7$10,000 to $14,999
- 24$30,000 to $34,999
- 8$50,000 to $59,999
- 8$100,000 to $124,999
- 9$300,000 to $399,999
- 5$400,000 to $499,999
- 106$500,000 to $749,999
- 54$750,000 to $999,999
- 115$1,000,000 to $1,499,999
- 22$2,000,000 or more
Rent paid by renters in 2022 in Byron, CA
-
- 8$550 to $599
- 12$800 to $899
- 4$1,000 to $1,249
- 68$1,500 to $1,999
- 52$2,000 to $2,499
- 26$2,500 to $2,999


Percentage of workers working in this county: 66.8%
Number of people working at home: 35 (4.8% of all workers)
Travel time to work (commute)
- Less than 5 minutes: 16
- 5 to 9 minutes: 6
- 10 to 14 minutes: 94
- 15 to 19 minutes: 22
- 20 to 24 minutes: 67
- 25 to 29 minutes: 16
- 30 to 34 minutes: 78
- 35 to 39 minutes: 0
- 40 to 44 minutes: 81
- 45 to 59 minutes: 34
- 60 to 89 minutes: 201
- 90 or more minutes: 34
Means of transportation to work:
- Drove a car alone: 198 (60.6%)
- Carpooled: 112 (34.3%)
- Walked: 17 (5.2%)

- Unemployment by race in 2022
- Unemployment rate for White non-Hispanic residents
- 24.8%Females
- Unemployment rate for Hispanic or Latino residents
- 5.7%Males

- Year of entry for the foreign-born population in Byron, California
- 262010 or later
- 512000 to 2009
- 491990 to 1999
- 71980 to 1989
- 121970 to 1979
- 10Before 1970

First ancestries reported:
- Irish: 206 (21.7%)
- German: 57 (6.0%)
- American: 29 (3.1%)
- English: 26 (2.7%)
- Italian: 21 (2.2%)
- European: 18 (1.9%)
- Portuguese: 16 (1.7%)
- Eastern European: 6 (0.6%)
- Lithuanian: 4 (0.4%)
- African: 1 (0.1%)
Most common places of birth for foreign-born residents (%):
| Byron: | 70.7% (191) |
| California: | 37.2% (3,881,193) |
| Byron: | 17.8% (48) |
| California: | 7.8% (818,297) |
| Byron: | 5.6% (15) |
| California: | 0.7% (74,025) |
| Byron: | 3.7% (10) |
| California: | 0.6% (57,953) |
Place of birth for U.S.-born residents:
- This state: 978
- Other state: 589
- Northeast: 40
- Midwest: 358
- South: 194
- West: 7
91.3% of Byron residents lived in the same house 1 years ago.
Out of people who lived in different houses, 29.3% lived in this county.
Out of people who lived in different counties, 100.0% lived in California.
| Byron: | 91.3% |
| State average: | 88.9% |
Education attainment for males 25 years and older:
- No schooling: 12
- Nursery to 4th grade: 0
- 5th and 6th grade: 0
- 7th and 8th grade: 0
- 9th grade: 5
- 10th grade: 9
- 11th grade: 8
- 12th grade, no diploma: 51
- High school graduate (or equivalency): 163
- Less than 1 year of college: 18
- Some college more than 1 year, no degree: 117
- Associate degree: 31
- Bachelor's degree: 77
- Master's degree: 38
- Professional school degree: 0
- Doctorate degree: 0

Education attainment for females 25 years and older:
- No schooling: 40
- Nursery to 4th grade: 0
- 5th and 6th grade: 0
- 7th and 8th grade: 0
- 9th grade: 0
- 10th grade: 0
- 11th grade: 27
- 12th grade, no diploma: 8
- High school graduate (or equivalency): 125
- Less than 1 year of college: 22
- Some college more than 1 year, no degree: 138
- Associate degree: 130
- Bachelor's degree: 27
- Master's degree: 88
- Professional school degree: 0
- Doctorate degree: 0


Housing units in structures:
- One, detached: 457
- One, attached: 25
- 10 to 19: 20
- Mobile homes: 53
Median worth of mobile homes: $38,359
House/condo owner moved in on average 15 years ago
Renter moved in on average 7 years ago

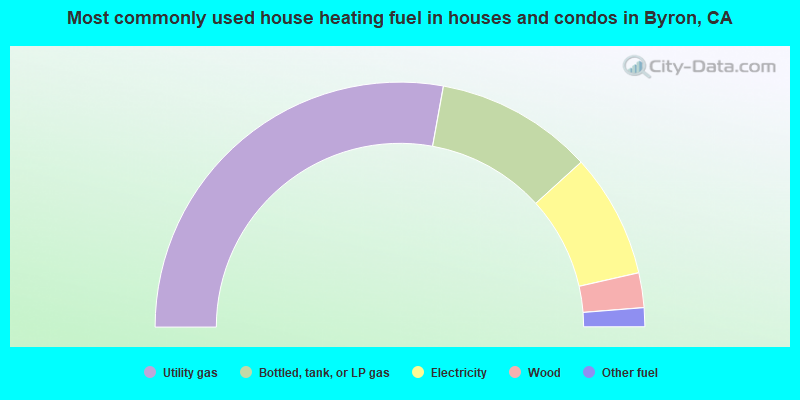
- 55.7%Utility gas
- 20.8%Bottled, tank, or LP gas
- 16.4%Electricity
- 4.6%Wood
- 2.5%Other fuel
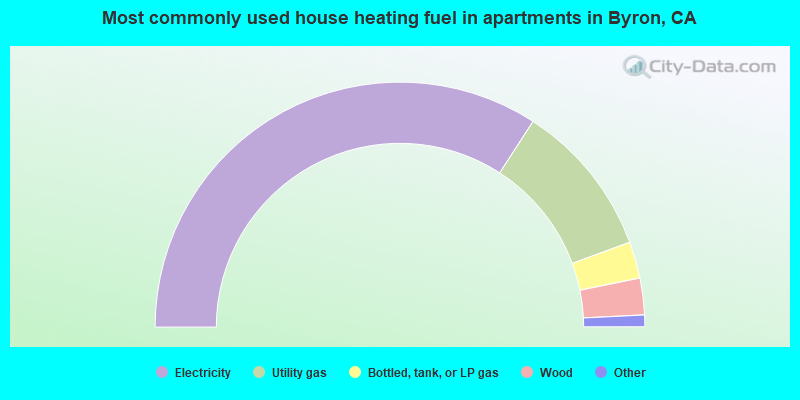
- 69.4%Electricity
- 20.8%Utility gas
- 4.9%Bottled, tank, or LP gas
- 4.9%Wood
Private vs. public school enrollment:
| Here: | 0.0% |
| California: | 10.5% |
| Here: | 0.0% |
| California: | 8.5% |
| Here: | 46.2% |
| California: | 15.9% |


